This is an implementation of the Largest-Triangle-Three-Buckets (LTTB) downsampling algorithm in Python.
The code has been translated from the work of Sveinn Steinarsson in his plugin for Flot charts.
More information is available on his page,
and you can find the thesis describing the algorithm here.
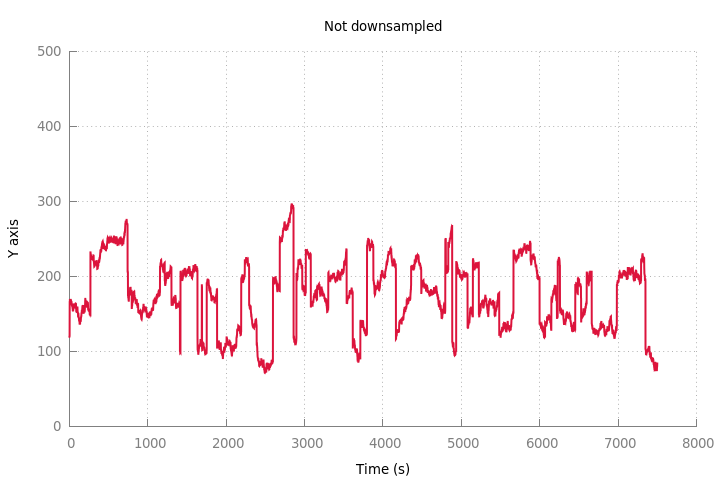
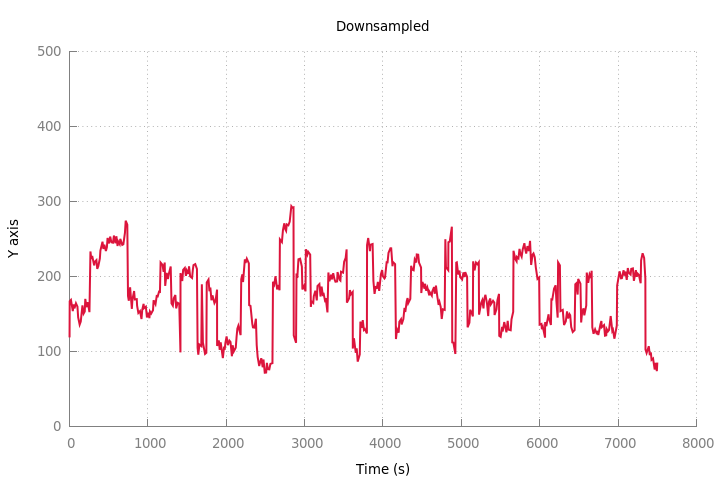
The first chart contains 7500 points, and the downsampled one 500 points :


- /!\ This code has only been tested with python 3.4
- You can use run.sh to generate and produce the demo graph