A simple load generator to test the performance of the ACA-PY agent.
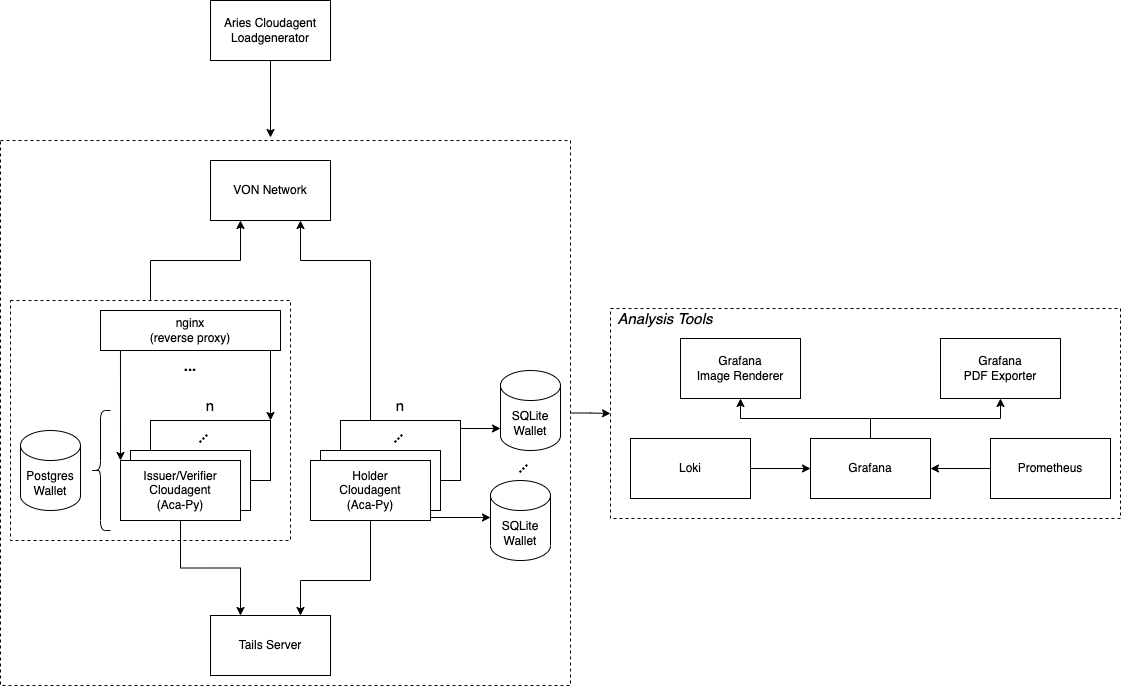
This repository comes with an automated testing setup consisting of:
- n Issuer/Verifier ACA-Py instance(s) depending on the configuration (+ 1 shared Postgres Wallet DB)
- nginx as reverse proxy for the Issuer/Verifier instances
- n Holder ACA-Py instance(s) (+ SQLite Wallet DB for each one)
- Tails Server to support revocation
- VON-Network for a local deployment of an indy ledger
- Analysis Tools (see below)
- Aries Clouadagent Load Generator itself
You need to have Docker and Docker-Compose installed.
Further, you need to ensure to not use Docker Compose V2 as it is
incompatible to the setup used by the load generator. To deactivate Compose V2 run docker-compose disable-v2.
To configure the environment create a ./setup/.env file similar to ./setup/.env.example
Declarative deployment approach is used. All variables in the ./setup/.env which have prefix SYSTEM_ indicate what
and how components must be deployed.
SYSTEM_LEDGER=true- ledger will be deployedSYSTEM_ISSUER_POSTGRES_DB=true- Postgres database wallet will be deployedSYSTEM_ISSUER_POSTGRES_DB_CLUSTER=true- Postgres database will be deployed as clusterSYSTEM_METRICS_DASHBOARD=true- Dashboard to collect system metrics will be deployedSYSTEM_AGENTS=true- Issuers and Holders will be deployedSYSTEM_LOAD_GENERATOR=true- Load generator which immediately generates load is deployed
To start the environment and execute the load generator run:
./setup/manage.sh start
This will start all necessary components as well as registering a DID from the given seed in the .env file. The Load Generator itself is also included as a Docker container using this command.
To restart the environment, run:
./setup/manage.sh restart
If stop the system, delete all data, and remove all containers, run:
./setup/manage.sh down
This project includes a setup for analyzing and visualizing the test results. The whole analysis setup is started automatically when starting the test environment and available under http://localhost:3000/d/0Pe9llbnz/test-results.
- Grafana: is used to visualize the collected data on a dashboard
- Grafane Image Renderer: used to render Grafana graphs as images to export them to a PDF (uses the Image Renderer Plugin)
- Grafana PDF Exporter: used to export a Grafana dashboard as a PDF ( uses IzakMarais/reporter)
- Grafana Loki: is used to collect logs from services like the Load Generator
- Prometheus: is used to collect metrics from services like cAdvisor, node-exporter
Prometheus Node Exporter exposes a wide variety of hardware- and kernel-related metrics.
Follow the installation guide to install node-exporter as a native application: Prometheus Node Exporter
You may consider running node-exporter on system startup, by adding it to sudo crontab -e
@reboot [INSTALLATION-DIR]/node_exporter > /dev/null 2>&1
Grafana runs on http://localhost:3000. It comes preconfigured with dashboards to visualize the test results from the load tests. You can for example open http://localhost:3000/d/0Pe9llbnz/test-results to the test results.
To see any data on the dashboard, ensure to select the right time range in Grafana for which data has been collected.
Using IzakMarais/reporter it is possible to export a dashboard as a PDF. For
this a link exists in the top right corner of the dashboards. The PDF generation can take multiple minutes depending on
the Dashboard complexity. Check the logs of the grafana-pdf-exporter container in case you want to see the progress of
the PDF generation.
In case you want to debug the AcaPy while running the load-tests you can
set ISSUER_VERIFIER_AGENT_ENABLE_DEBUGGING=true in the .env. Afterwards, you can start the test environment
using ./setup/manage.sh debug. This will build an AcaPy docker image based on the AcaPy version currently checked out
under ./setup/agents/acapy and includes a Python debugger into the docker image.
Once the test environment started the issuer-verifier-acapy will state === Waiting for debugger to attach ===. To
attach a debugger open ./setup/agents/acapy in VS Code, add the following debug configuration to the launch.json,
and start the debugging.
{
  "version": "0.2.0",
  "configurations": [

    {
      "name": "Python: Remote Attach",
      "type": "python",
      "request": "attach",
      "connect": {
        "host": "localhost",
        "port": 5678
      },
      "pathMappings": [
        {
          "localRoot": "${workspaceFolder}",
          "remoteRoot": "."
        }
      ]
    }
  ]
}
Finally, you can start the load-generator from the IDE or by running ./mvnw spring-boot:run.
The startup process is orchestrated by the manage.sh. During this process sleep XX
is used to wait for Docker containers to properly start before continuing with the setup. Depending on the system's
performance the sleep durations might need to be increased to ensure that the containers get enough time to boot.
In case the VON network is not up and running before the manage.sh script tries to publish the DID
on the ledger, the DID will not be published. Consequently, the issuer-verifier-acapy will fail to start and throws a
error message similar to
Ledger rejected transaction request: client request invalid: could not authenticate, verkey for VfHmVDbSvAdnM7Ph2PFh2a cannot be found
.
Increase the sleep time between starting the ledger and registering the DID to avoid this issue.
This is likely caused by a communication issue between the AcaPy and the Load Generator. The AcaPy should notify the Load Generator about updates via the Webhook Endpoint. If the Load Generator does not receive the updates or is unable to process the updates it will not log any progress on the "Test Results" dashboard in Grafana.
Alternatively, it can also indicate that the load generator is not able to reach out to the issuer-verifier and/or holder agents' admin API. Ensure that issuer-verifier as well as holder agent containers are running and that the load-generator is using the correct URLs to reach out to the admin APIs.
Further, the holder agents need to be able to reach the issuer-verifier DIDcomm endpoint to accept connection invitations.
