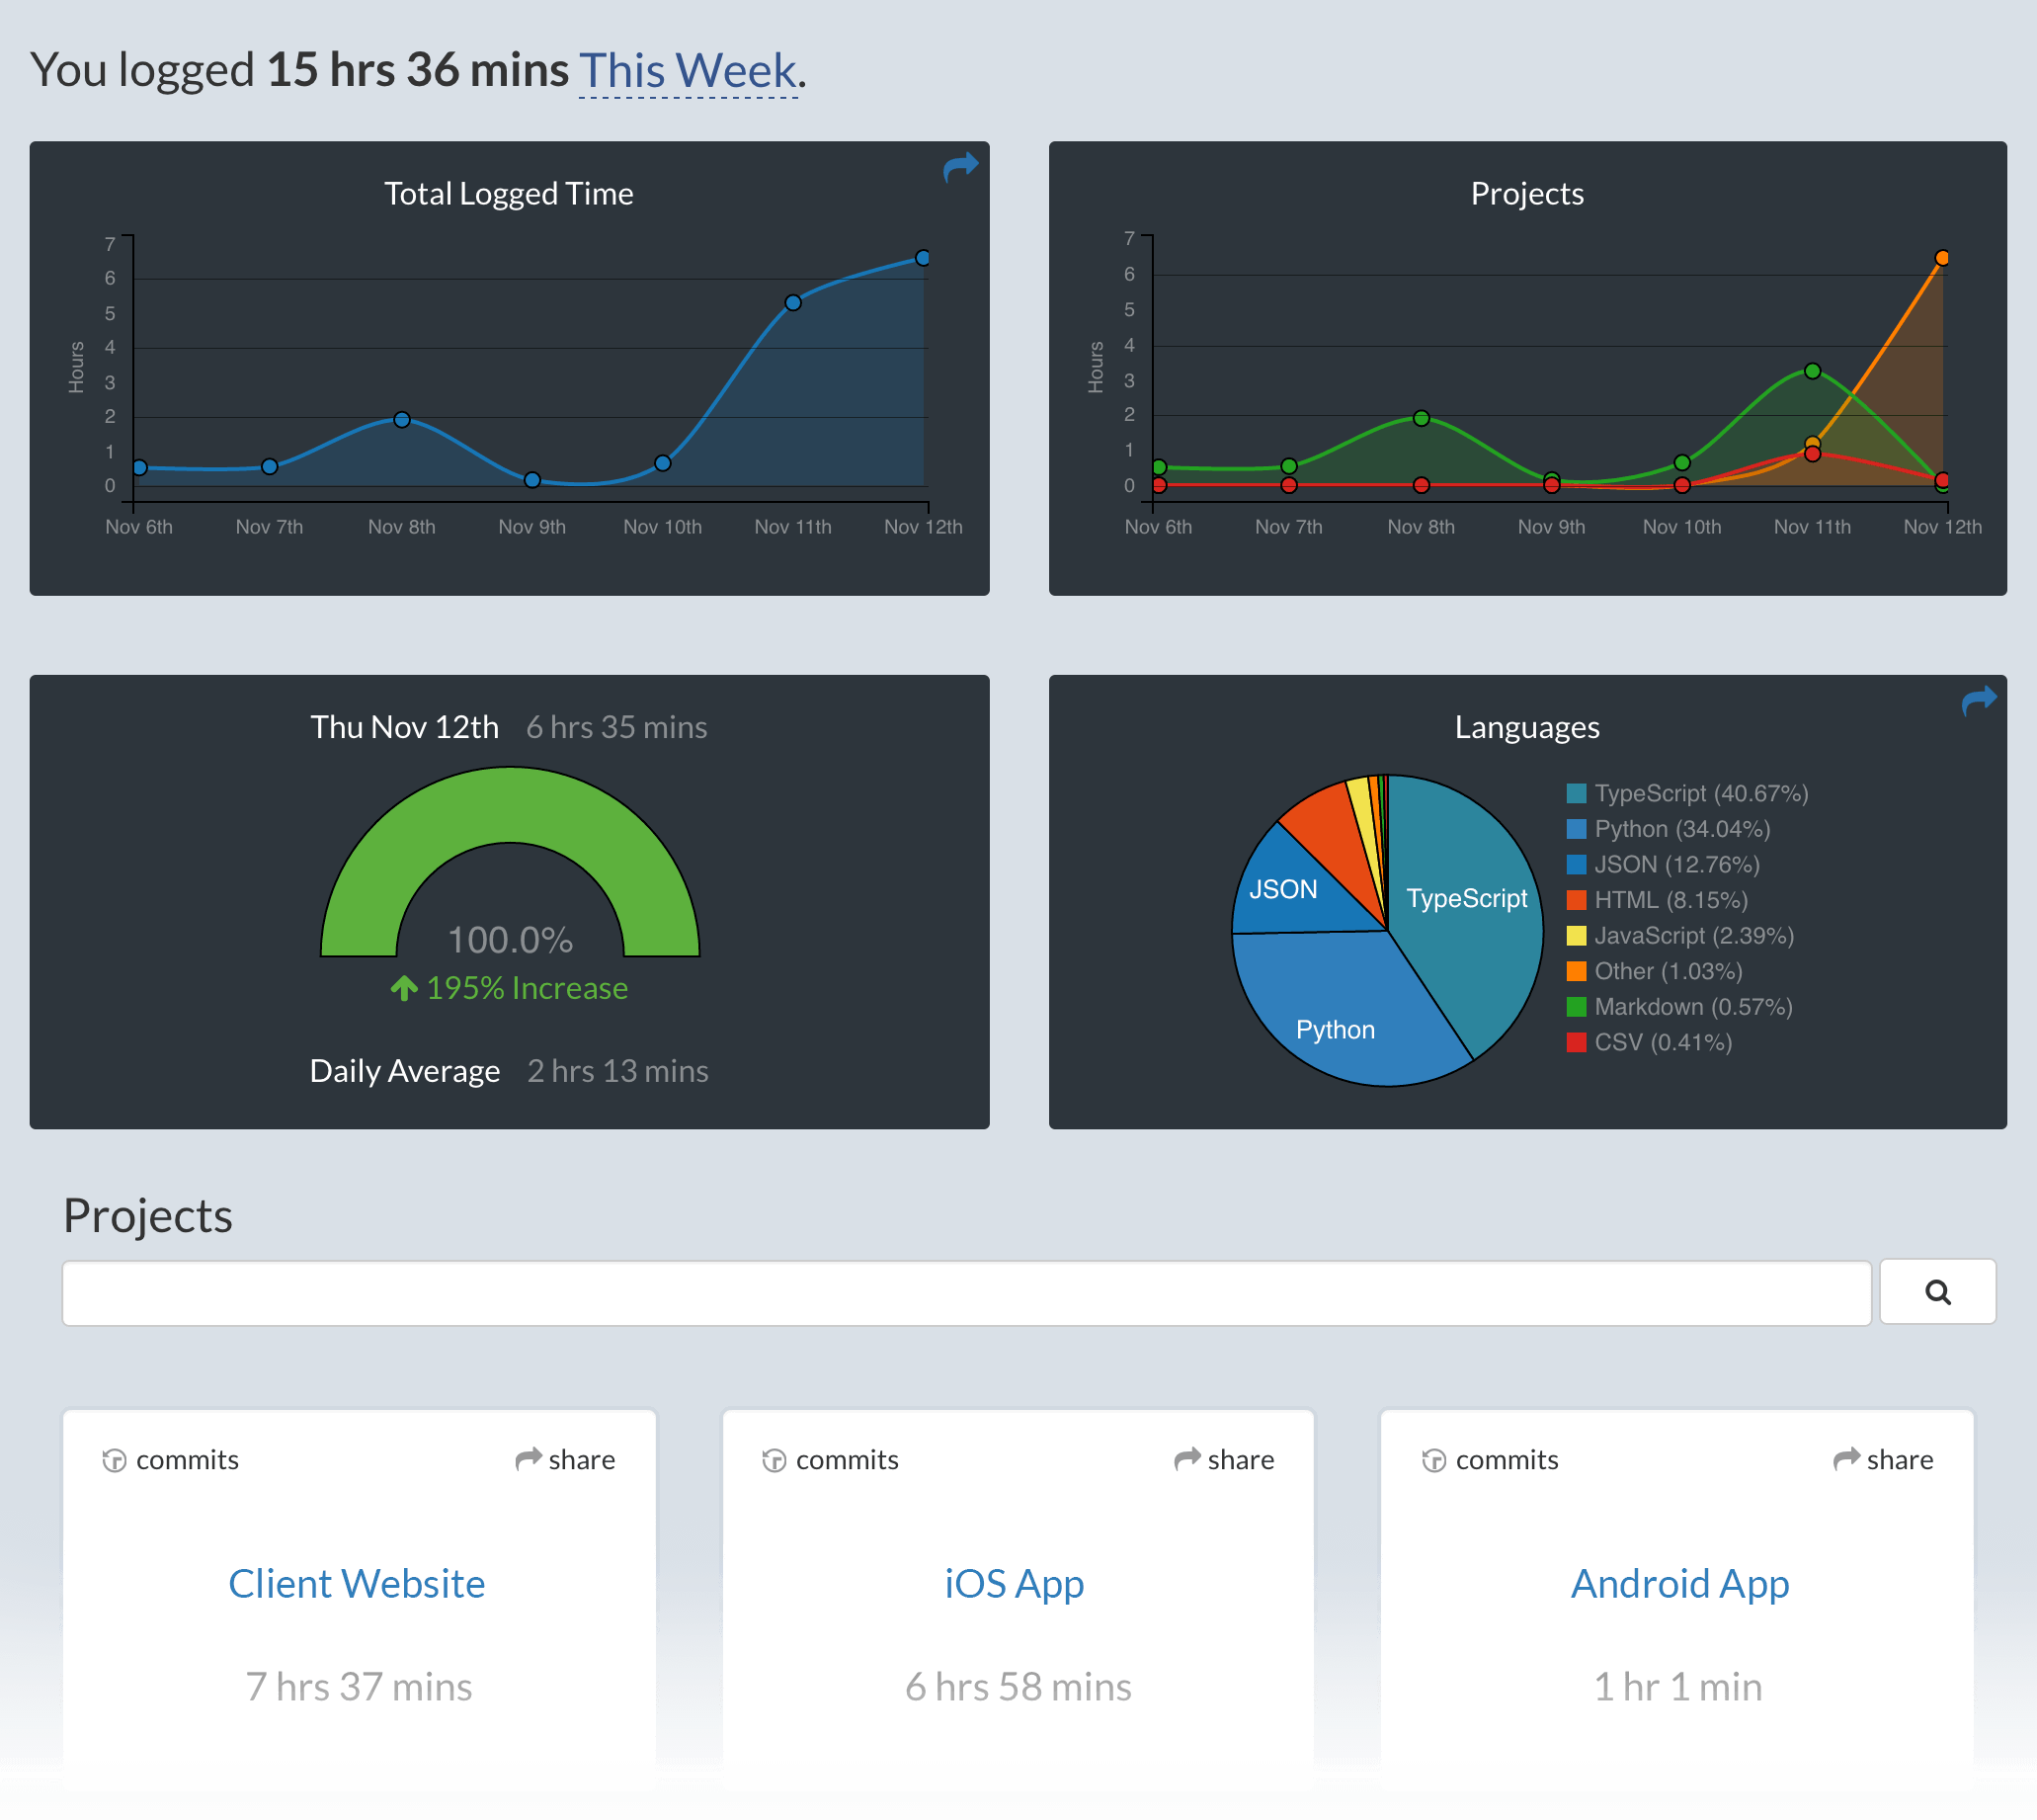
Metrics, insights, and time tracking automatically generated from your programming activity.
Using the plugin manager:
micro -plugin install wakatimeOr from within micro (must restart micro afterwards for the plugin to be loaded):
> plugin install wakatimeOr manually install by cloning this repo as wakatime into your plug directory:
git clone https://github.com/wakatime/micro-wakatime ~/.config/micro/plug/wakatimeFor the first time you install WakaTime in your machine the Micro startup could delay a bit.
-
Enter your api key, then hit
Enter.(If you’re not prompted, press ctrl + e then type
wakatime.apikey.) -
Use Micro Editor and your coding activity will be displayed on your WakaTime dashboard.
Visit https://wakatime.com to see your coding activity.
Extension settings are stored in the INI file at $HOME/.wakatime.cfg.
More information can be found from wakatime core.
First, turn on debug mode:
- Run micro with flag
-debug.Logs are only generated when running with debug flag. Any other previous logs haven't been recorded.
Next, navigate to the folder you started micro and open log.txt.
Errors outside the scope of this plugin go to $HOME/.wakatime/wakatime.log from wakatime-cli.
The How to Debug Plugins guide shows how to check when coding activity was last received from your editor using the Plugins Status Page.
For more general troubleshooting info, see the wakatime-cli Troubleshooting Section.

