Build a Traffic Sign Recognition Project
The goals / steps of this project are the following:
- Load the data set (see below for links to the project data set)
- Explore, summarize and visualize the data set
- Design, train and test a model architecture
- Use the model to make predictions on new images
- Analyze the softmax probabilities of the new images
- Summarize the results with a written report
Here I will consider the rubric points individually and describe how I addressed each point in my implementation.
1. Provide a Writeup / README that includes all the rubric points and how you addressed each one. You can submit your writeup as markdown or pdf. You can use this template as a guide for writing the report. The submission includes the project code.
You're reading it! and here is a link to my project code
1. Provide a basic summary of the data set. In the code, the analysis should be done using python, numpy and/or pandas methods rather than hardcoding results manually.
I used the pandas library to calculate summary statistics of the traffic signs data set:
- The size of training set is 34799
- The size of the validation set is 4410
- The size of test set is 12630
- The shape of a traffic sign image is (32, 32, 3)
- The number of unique classes/labels in the data set is 43
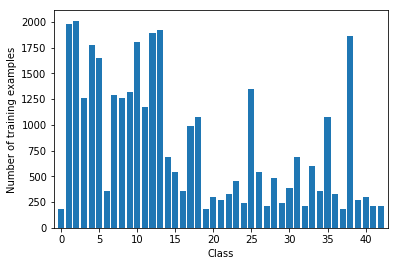
Here is an exploratory visualization of the data set. It is a bar chart showing how the training dataset is distributed acrosses the different classes of traffic signs
As a last step, I normalized the image data because ...
I chose to generate additional augmented data because tests showed that the model performed significantly better with more dataset
To add more data to the the data set, I used basically generated additional 2 rotated versions of the original images, by rotating the images st +5 and -5 degrees.
My final model consisted of the following layers:
| Layer | Description |
|---|---|
| Input | 32x32x3 RGB image |
| Convolution 5x5 | 1x1 stride, same padding, outputs 28x28x6 |
| Activation | RELU |
| Max pooling | Reduces the size to 14x14x6 |
| Convolution 5x5 | Input 14x14x6, outputs 10x10x6 |
| Activation | RELU |
| Max pooling | Reduces the size to 5x5x16 |
| Flatten | Output is 400 |
| Fully Connected | None-Linear - output - 120 |
| Activation | RELU |
| Dropout | |
| Fully Connected | None-Linear - output - 84 |
| Activation | RELU |
| Dropout | |
| Fully Connected + RELU | None-Linear - output - 43 (Class Size) |
To train the model, I used a model based of the LeNet architecture. I used the AdamOptimizer, using a Batch size of 256 and ran 20 Epochs. I found that using a learning rate of 0,001 provided best results.
My final model results:
- Validation set accuracy of 93.4%
- Training set accuracy of 98.9%
- Test set accuracy of 92.3%
I iteratively adjusted the parameters and approaches to achieve the results described here. I figured that the model performed much better with more data set, I augmented the input images by generating slightly rotated version of the images (Rotating by about +5 and -5 degrees of each image)
I struggled with over-fitting, where the model performed well in test data, but did very badly with the validation dataset. Adding a dropout of 0.7 improved the accuracy of both the validation and training set. I tried running with 5, 10, 15, 20, 25 epochs, and settled for 20 epochs.
I found the learning rate of 0.001 to be just fine.
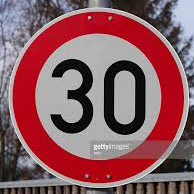
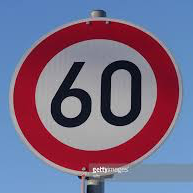
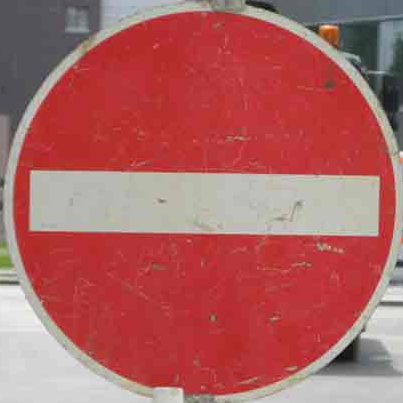
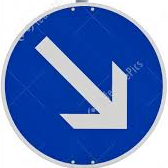
Here are five German traffic signs that I found on the web: This images were randomly selected across a couple of sources
I find that the model should not find it difficult to classify these images as they are sufficiently bright and properly aligned; I cropped the images to remove most of the irrelevant background.
Here are the results of the prediction:
| Image | Prediction |
|---|---|
| 30 km/h Zone | End of all speed and passing limits |
| 60 km/h Zone | 60 km/h Zone |
| No Entry | No Entry |
| Turn right ahead | Turn right ahead |
| Keep Right | Keep right |
The model was able to correctly guess 4 of the 5 traffic signs, which gives an accuracy of 80%. This compares favorably to the accuracy on the test set of 92% from the training
The model is provides a very high degree of probabilities when predicting new images.
1:
 1: 100.00%
 32: 0.00%
 2: 0.00%
 6: 0.00%
 13: 0.00%
3:
 3: 99.75%
 9: 0.14%
 32: 0.11%
 1: 0.00%
 0: 0.00%
17:
 17: 100.00%
 0: 0.00%
 22: 0.00%
 14: 0.00%
 26: 0.00%
33:
 33: 98.79%
 35: 1.21%
 40: 0.00%
 39: 0.00%
 9: 0.00%
38:
 38: 100.00%
 40: 0.00%
 13: 0.00%
 36: 0.00%
 39: 0.00%
