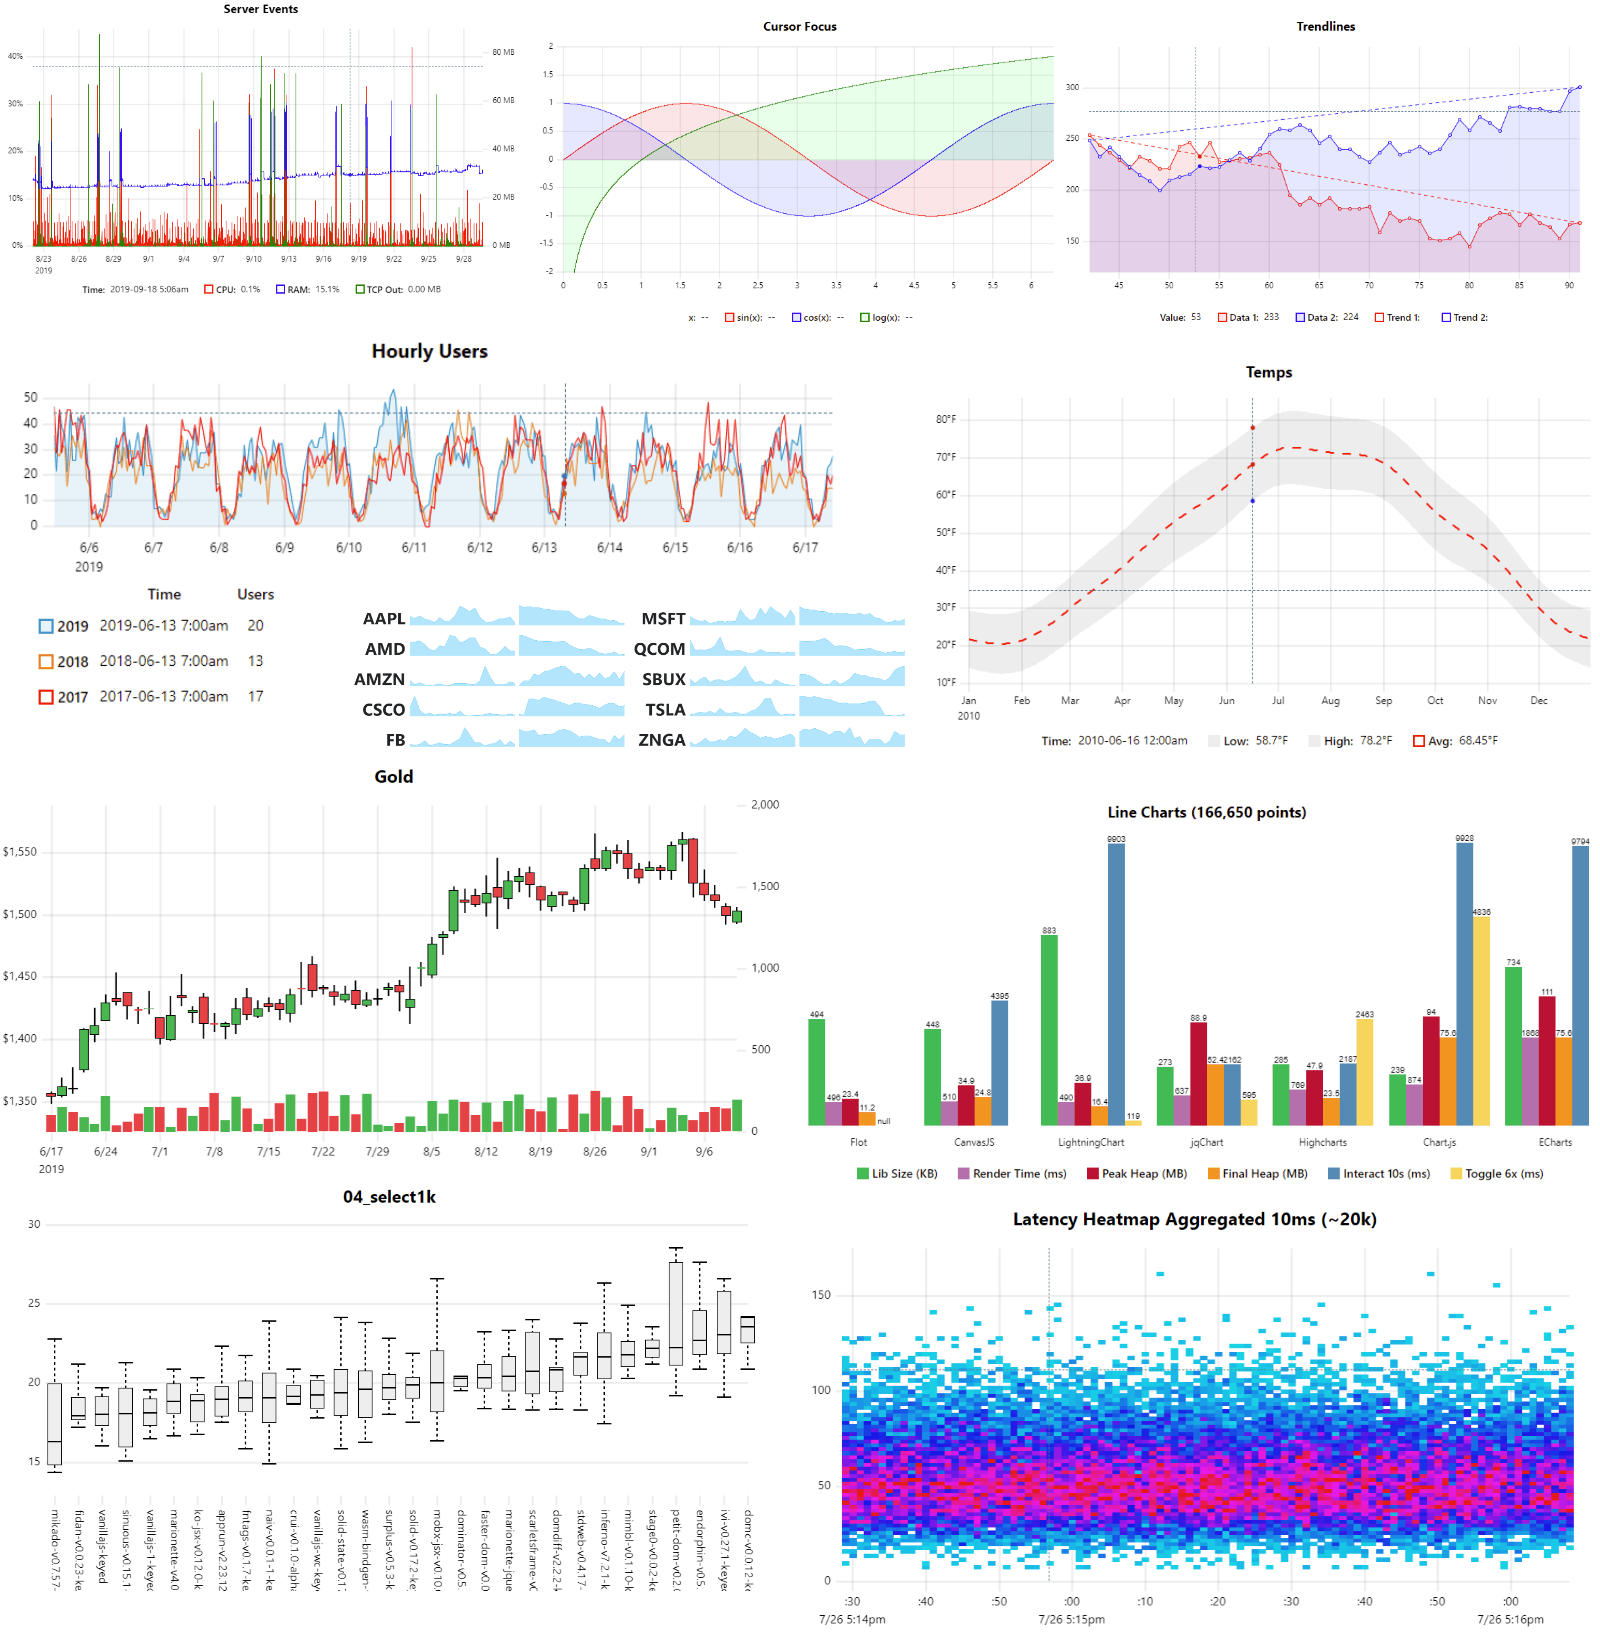
A small (~40 KB min), fast chart for time series, lines, areas, ohlc & bars (MIT Licensed)
μPlot is a fast, memory-efficient Canvas 2D-based chart for plotting time series, lines, areas, ohlc & bars; from a cold start it can create an interactive chart containing 150,000 data points in 135ms, scaling linearly at ~25,000 pts/ms. In addition to fast initial render, the zooming and cursor performance is by far the best of any similar charting lib; at ~40 KB, it's likely the smallest and fastest time series plotter that doesn't make use of context-limited WebGL shaders or WASM, both of which have much higher startup cost and code size.
166,650 point bench: https://leeoniya.github.io/uPlot/bench/uPlot.html
However, if you need 60fps performance with massive streaming datasets, uPlot can only get you so far. If you decide to venture into this realm with uPlot, make sure to unclog your rendering pipeline. WebGL should still be the tool of choice for applications like realtime signal or waveform visualizations: See danchitnis/webgl-plot, huww98/TimeChart, epezent/implot, or commercial products like LightningChart®.
- Multiple series w/toggle
- Multiple y-axes, scales & grids
- Temporal or numeric x-axis
- Linear, uniform or logarithmic scales
- Line & Area styles (stroke, fill, width, dash)
- Pluggable path renderers linear, spline, stepped, bars
- Zoom with auto-rescale
- Legend with live values
- Support for IANA Time Zone Names & DST
- Support for missing data
- Cursor sync for multiple charts
- Focus closest series
- Data streaming (live update)
- High / Low bands
- A lean, consistent, and powerful API with hooks & plugins
In order to stay lean, fast and focused the following features will not be added:
- No data parsing, aggregation, summation or statistical processing - just do it in advance. e.g. https://simplestatistics.org/, https://www.papaparse.com/
- No transitions or animations - they're always pure distractions.
- No collision avoidance for axis tick labels, so may require manual tweaking of spacing metrics if label customization significiantly increases default label widths.
- No stacked series: see "Stacked Area Graphs Are Not Your Friend" and a horrific demo. While smooth spline interpolation is available, its use is strongly discouraged: Your data is misrepresented!. Both visualizations are terrible at accurately communicating information.
- No built-in drag scrolling/panning due to ambiguous native zoom/selection behavior. However, this can be added externally via the plugin/hooks API: zoom-wheel, zoom-touch.
The docs are a perpetual work in progress, it seems. Start with /docs/README.md for a conceptual overview. The full API is further documented via comments in /dist/uPlot.d.ts. Additionally, an ever-expanding collection of runnable /demos covers the vast majority of uPlot's API.
- Jupyter widget (Sohail Somani)
- React and Vue.js (Sergey Kalinichev)
Benchmarks done on this hardware:
- Date: 2021-04-24
- Windows 10 x64, Chrome 90.0.4430.85 (64-bit)
- Core i7-8700 @ 3.2GHz, 16GB RAM
- AMD Radeon RX480, 2560x1440 res
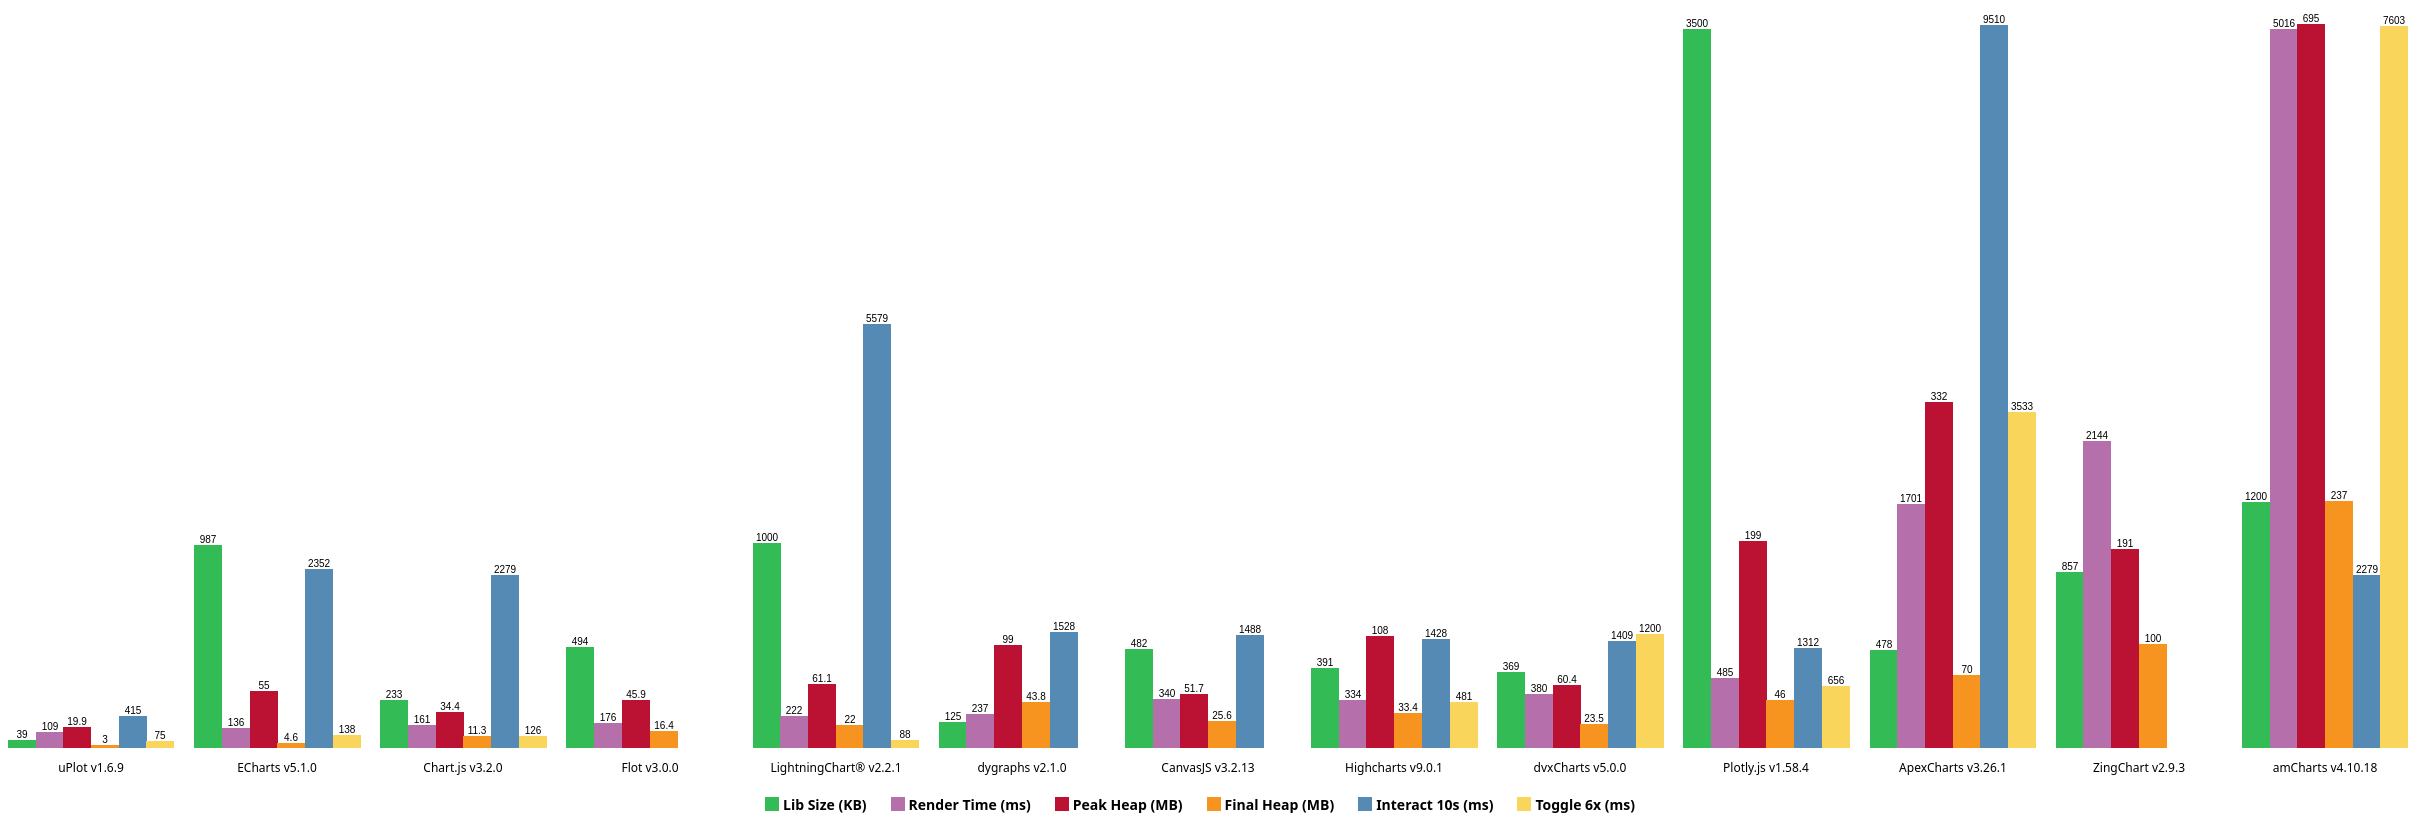
Full size: https://leeoniya.github.io/uPlot/demos/multi-bars.html
Raw data: https://github.com/leeoniya/uPlot/blob/master/bench/results.json
| lib                    | size    | done    | js,rend,paint,sys | heap peak,final | mousemove (10s)     |
| ---------------------- | ------- | ------- | ----------------- | --------------- | ------------------- |
| uPlot v1.6.9           |   39 KB |   58 ms |   70   1   1   38 |  20 MB   3 MB   |   65  159   88  103 |
| ECharts v5.1.0         |  987 KB |   88 ms |   87   1   1   47 |  55 MB   5 MB   | 1463  284   84  521 |
| Chart.js v3.2.0        |  233 KB |   80 ms |  118   1   1   41 |  34 MB  11 MB   |  725   30   57 1467 |
| Flot v3.0.0            |  494 KB |   91 ms |  118   3   1   55 |  46 MB  16 MB   | ---                 |
| LightningChart® v2.2.1 | 1000 KB |  --- ms |  178   2   1   42 |  61 MB  22 MB   | 5310   46   43  180 |
| dygraphs v2.1.0        |  125 KB |  135 ms |  159   2   1   75 |  99 MB  44 MB   | 1087  162   74  205 |
| CanvasJS v3.2.13       |  482 KB |  241 ms |  271   2   1   66 |  52 MB  26 MB   |  961  256   76  195 |
| Highcharts v9.0.1      |  391 KB |  --- ms |  286   4   2   42 | 108 MB  33 MB   |  840  301  132  155 |
| dvxCharts v5.0.0       |  369 KB |  253 ms |  310  18   1   51 |  60 MB  24 MB   |  674  442  148  145 |
| Plotly.js v1.58.4      | 3500 KB |  377 ms |  408   5   1   71 | 199 MB  46 MB   | 1087  114   29   82 |
| Chart.js v2.9.4        |  245 KB |  495 ms |  524   2   1   75 | 103 MB  54 MB   | 8397    5    6 1158 |
| ECharts v4.9.0         |  785 KB |  366 ms |  498   1   1  581 | 224 MB  78 MB   | 2265   64   17 7551 |
| ApexCharts v3.26.1     |  478 KB |  --- ms | 1634  22   1   44 | 332 MB  70 MB   | 8611  646   99  154 |
| ZingChart v2.9.3       |  857 KB | 2081 ms | 2101   5   1   38 | 191 MB 100 MB   | ---                 |
| amCharts v4.10.18      | 1200 KB | 5564 ms | 4925  19   6   67 | 695 MB 237 MB   | 1494  336  164  285 |
Normally, all libs are updated to their latest versions before each benchmark round. However, libraries which show significant performance improvements in latest versions will have prior versions shown to encourage migration; this is especially true for still-widely-deployed libs, such as Chart.js v2.9.4, and ECharts v4.9.0. Deployment prevalence is assessed from public npm and CDN download stats for the prior few months.
- libs are sorted by their initial, cold-start, render performance (excluding network transfer time to download the lib)
sizeincludes the lib itself plus any dependencies required to render the benchmark, e.g. Moment, jQuery, etc.- Flot does not make available any minified assets and all their examples use the uncompressed sources; they also use an uncompressed version of jQuery :/
Some libraries provide their own performance demos:
- https://echarts.apache.org/next/examples/en/index.html
- https://github.com/sveinn-steinarsson/flot-downsample/
- https://dygraphs.com/tests/dygraph-many-points-benchmark.html
- https://www.chartjs.org/docs/latest/general/performance.html
- https://dash.plotly.com/performance
- https://www.highcharts.com/docs/advanced-chart-features/boost-module
- https://danchitnis.github.io/webgl-plot-examples/vanilla/
- https://huww98.github.io/TimeChart/docs/performance
- https://www.arction.com/lightningchart-js-performance/
TODO (all of these use SVG, so performance should be similar to Highcharts):
- Chartist.js
- d3-based
- C3.js
- dc.js
- MetricsGraphics
- rickshaw
Your browser's performance is highly dependent on your hardware, operating system, and GPU drivers.
If you're using a Chromium-based browser, there are some hidden settings that can unlock significant performance improvements for Canvas2D rendering. Most of these have to do with where and how the rasterization is performed.
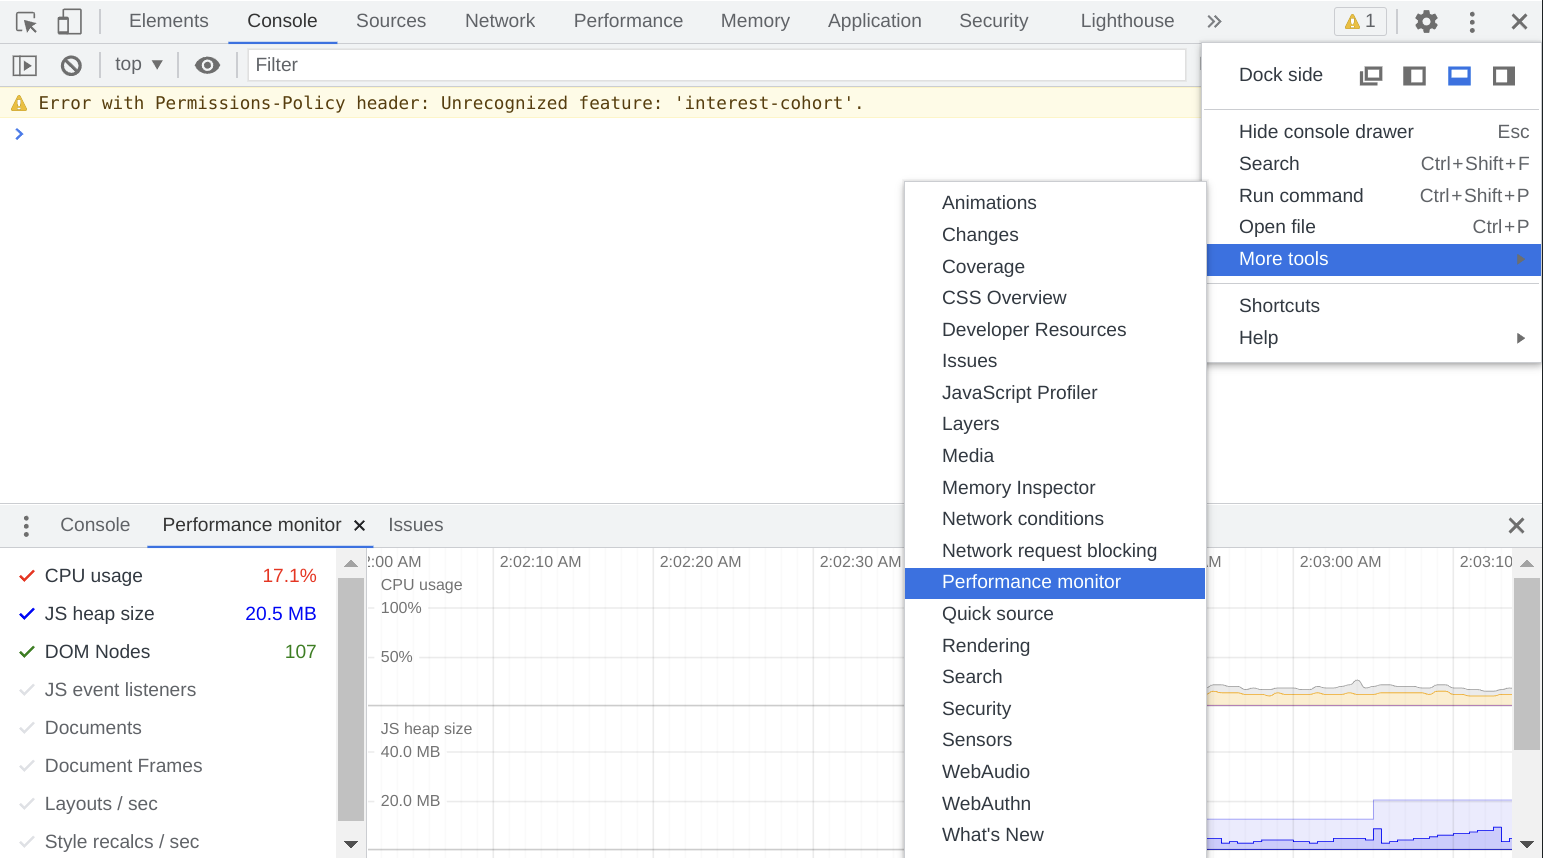
Head over to https://leeoniya.github.io/uPlot/demos/sine-stream.html and open up Chrome's DevTools (F12), then toggle the Performance Monitor.
For me:
- On Windows 10 Desktop, Core i7-8700, 16GB RAM, AMD RX480 GPU, 2048 x 1080 resolution = 57% CPU usage
- On Manjaro Laptop (Arch Linux), AMD Ryzen 7 PRO 5850U, 48GB RAM, AMD Radeon RX Vega 8 (integrated GPU), 4K resolution = 99% CPU usage
If your CPU is close to 100%, it may be rasterizing everything in the same CPU process.
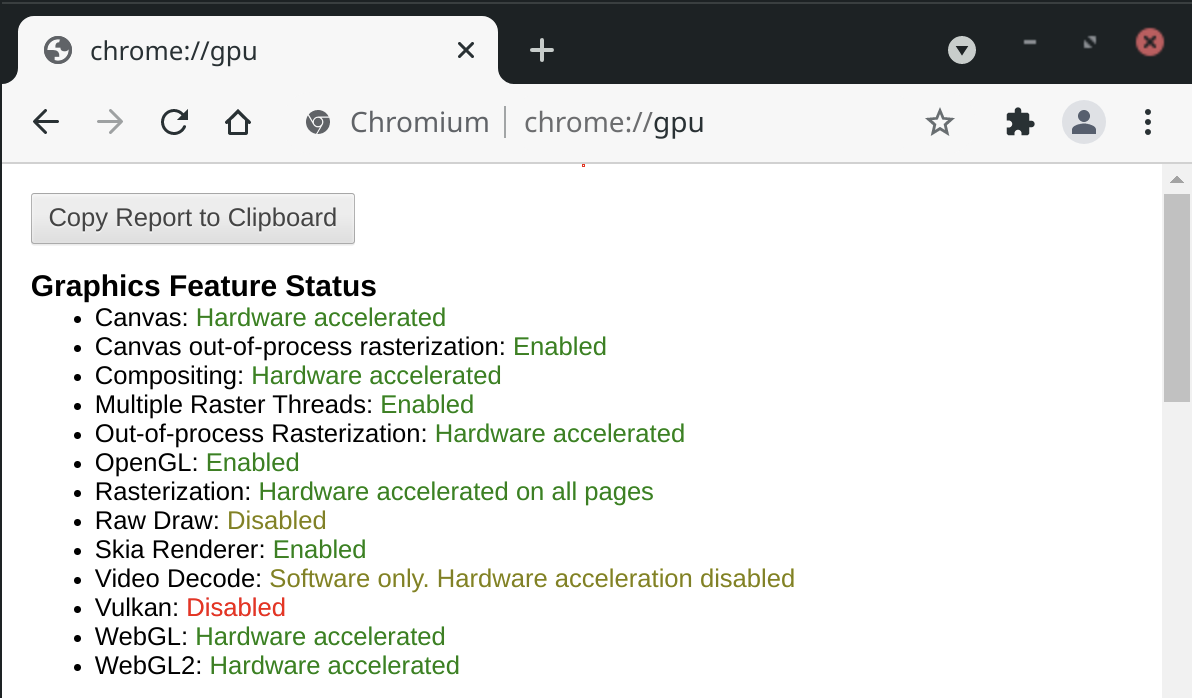
Pop open chrome://gpu and see what's orange or red.
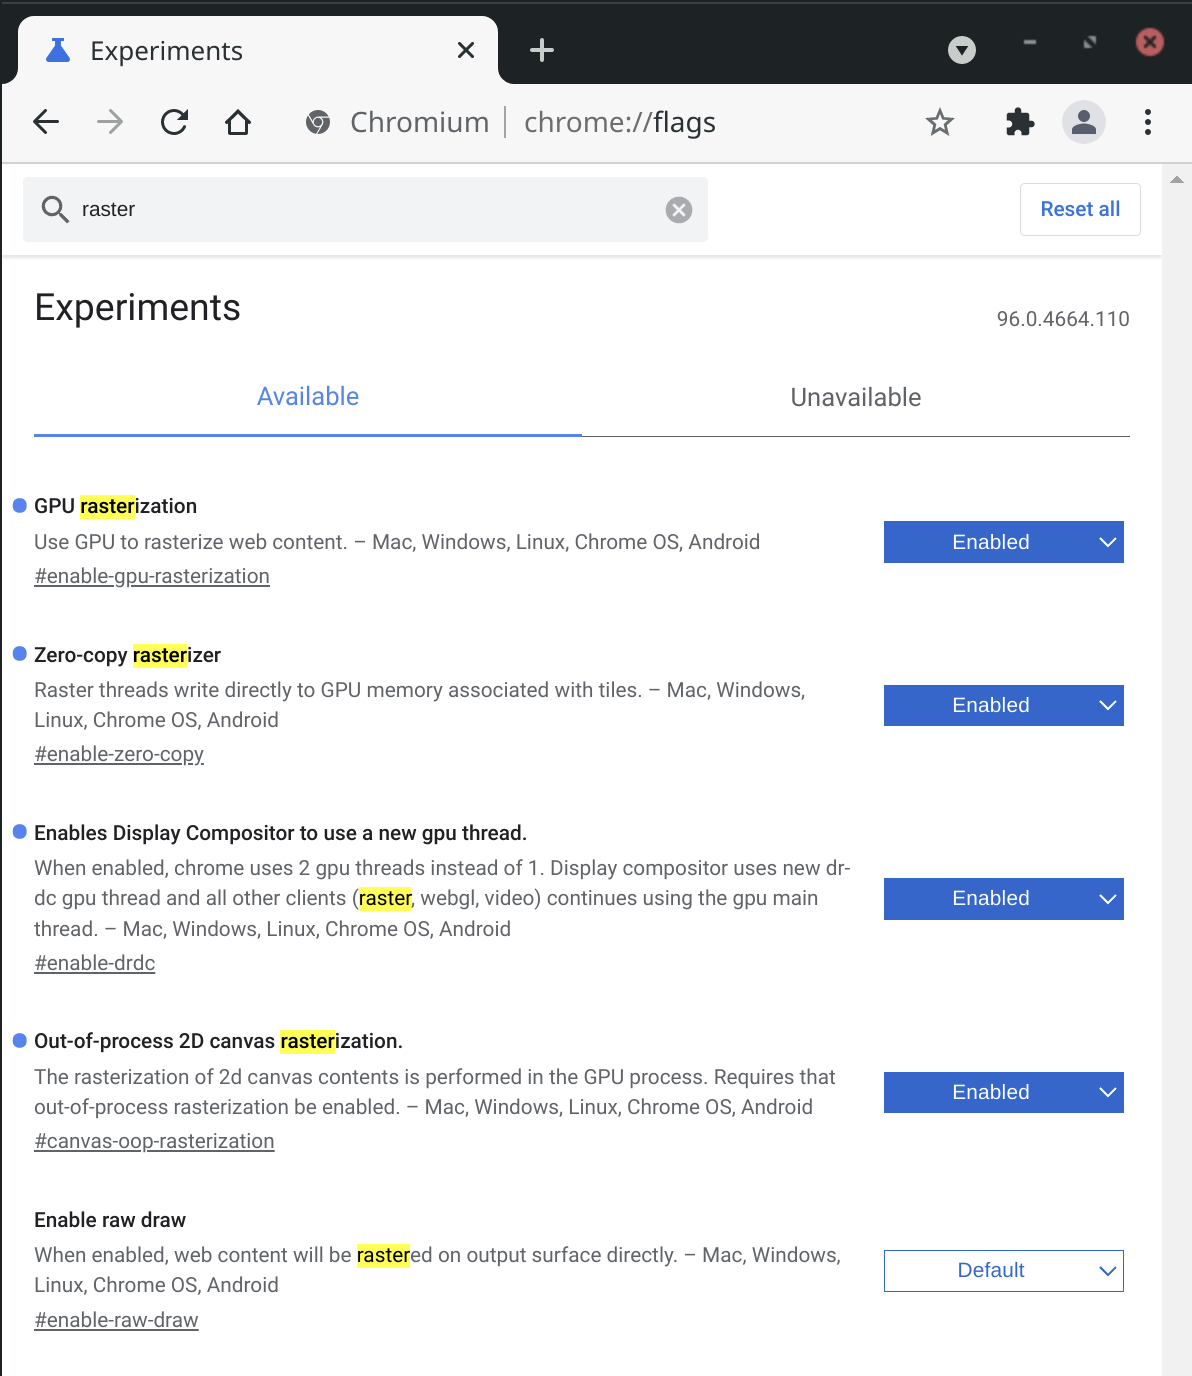
Then open chrome://flags and search for "raster" to see what can be force-enabled.
- On my Manjaro/Ryzen/Integrated GPU setup, force-enabling
Canvas out-of-process rasterizationresulted in a dramatic framerate improvement. - On my Windows/i7/Dedicated GPU setup, toggling the same flags moved the work to another process (still good), but did not have a significant framerate impact.
YMMV!
- Dan Vanderkam's dygraphs was a big inspiration; in fact, my stale pull request #948 was a primary motivator for μPlot's inception.
- Adam Pearce for #15 - remove redundant lineTo commands.
