Kubernetes Dashboard
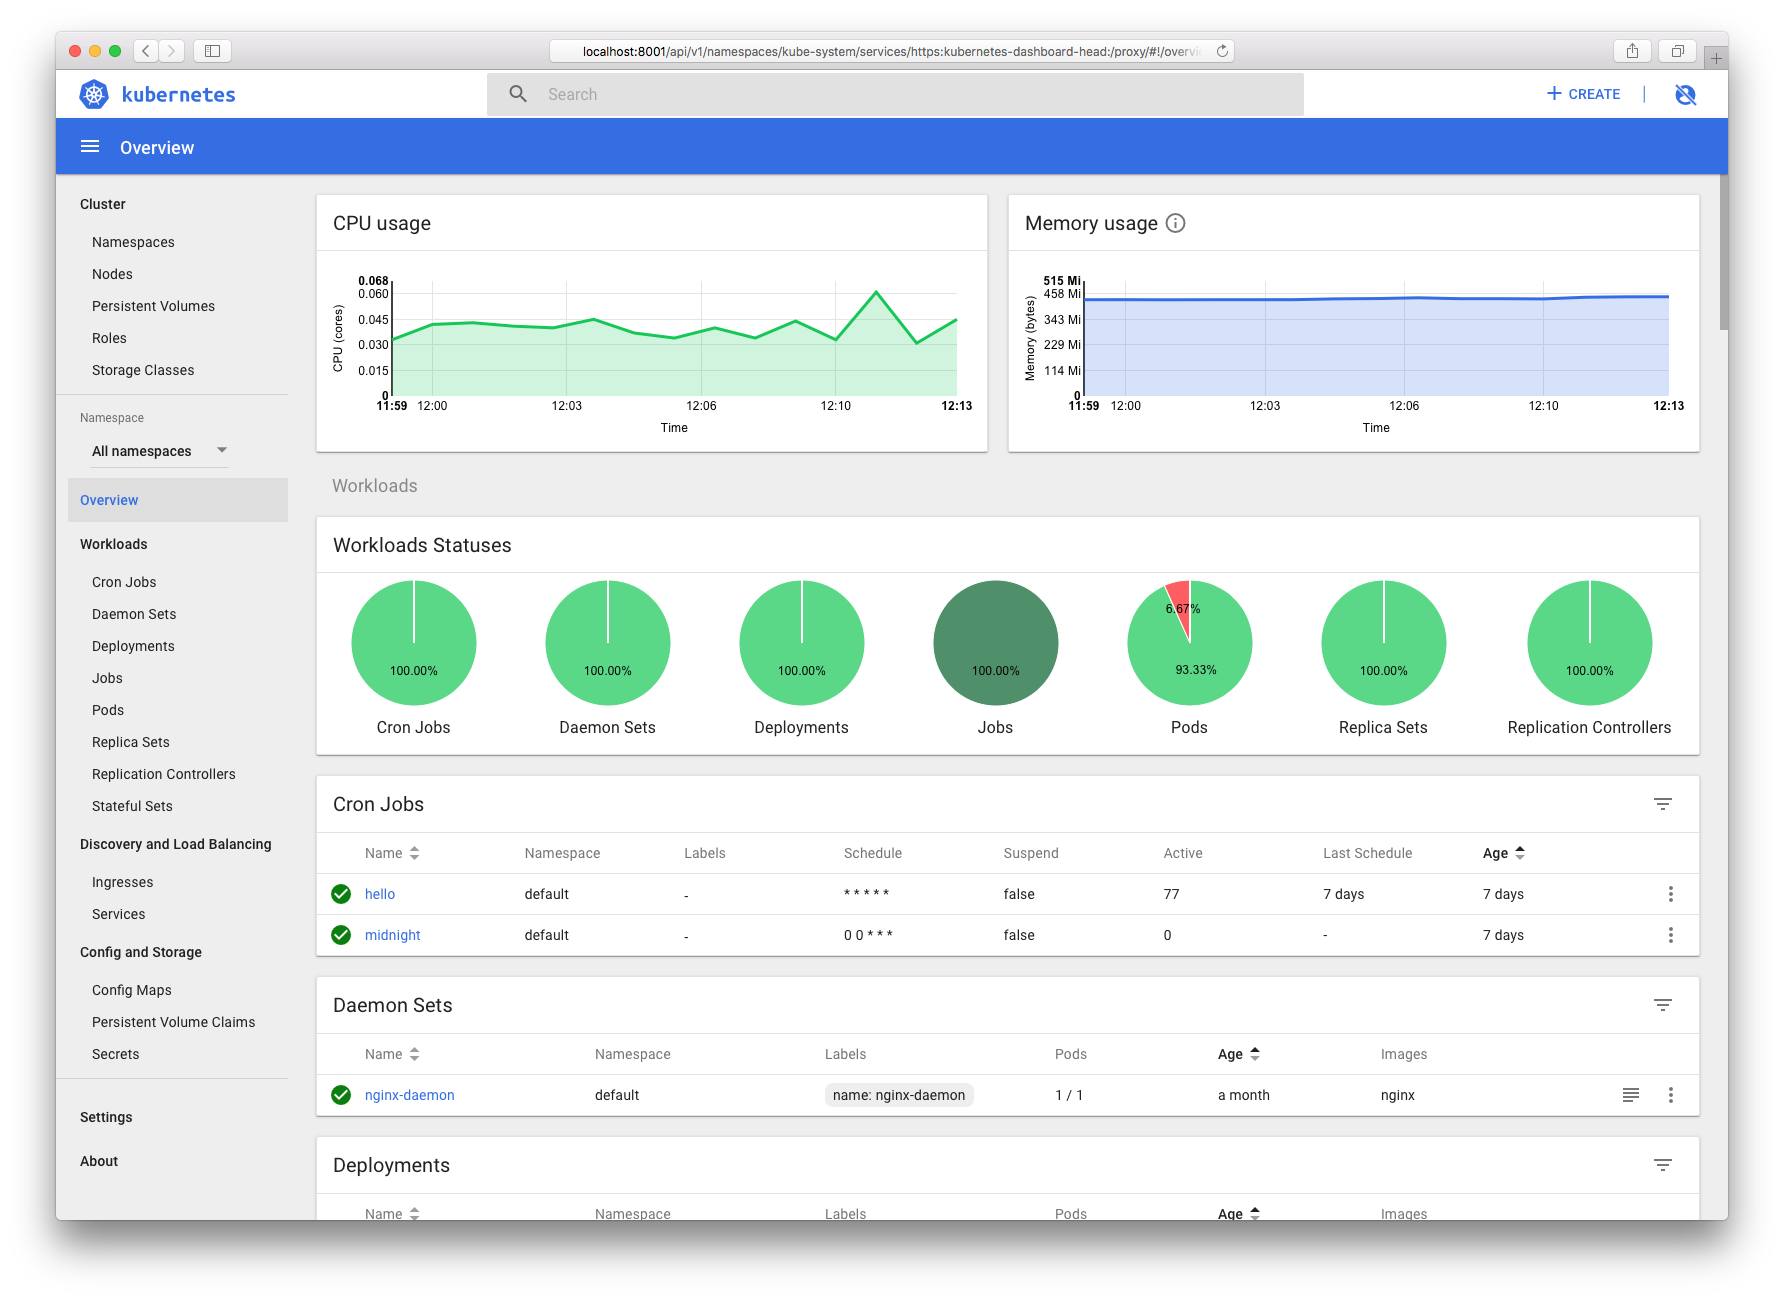
Kubernetes Dashboard is a general purpose, web-based UI for Kubernetes clusters. It allows users to manage applications running in the cluster and troubleshoot them, as well as manage the cluster itself.
IMPORTANT: Frontend side of the project is currently undergoing migration from AngularJS to the current version of Angular. If you are willing to contribute or you would like to check out early version of the application check this pull request.
Getting Started
IMPORTANT: Read the Access Control guide before performing any further steps. The default Dashboard deployment contains a minimal set of RBAC privileges needed to run.
To deploy Dashboard, execute following command:
$ kubectl apply -f https://raw.githubusercontent.com/kubernetes/dashboard/master/src/deploy/recommended/kubernetes-dashboard.yamlTo access Dashboard from your local workstation you must create a secure channel to your Kubernetes cluster. Run the following command:
$ kubectl proxyNow access Dashboard at:
http://localhost:8001/api/v1/namespaces/kube-system/services/https:kubernetes-dashboard:/proxy/.
Create An Authentication Token (RBAC)
To find out how to create sample user and log in follow Creating sample user guide.
NOTE:
- Kubeconfig Authentication method does not support external identity providers or certificate-based authentication.
- Dashboard can only be accessed over HTTPS
- Heapster has to be running in the cluster for the metrics and graphs to be available. Read more about it in Integrations guide.
Documentation
Dashboard documentation can be found on Wiki pages, it includes:
- Common: Entry-level overview
- User Guide: Installation, Accessing Dashboard and more for users
- Developer Guide: Getting Started, Dependency Management and more for anyone interested in contributing


