 |
 |
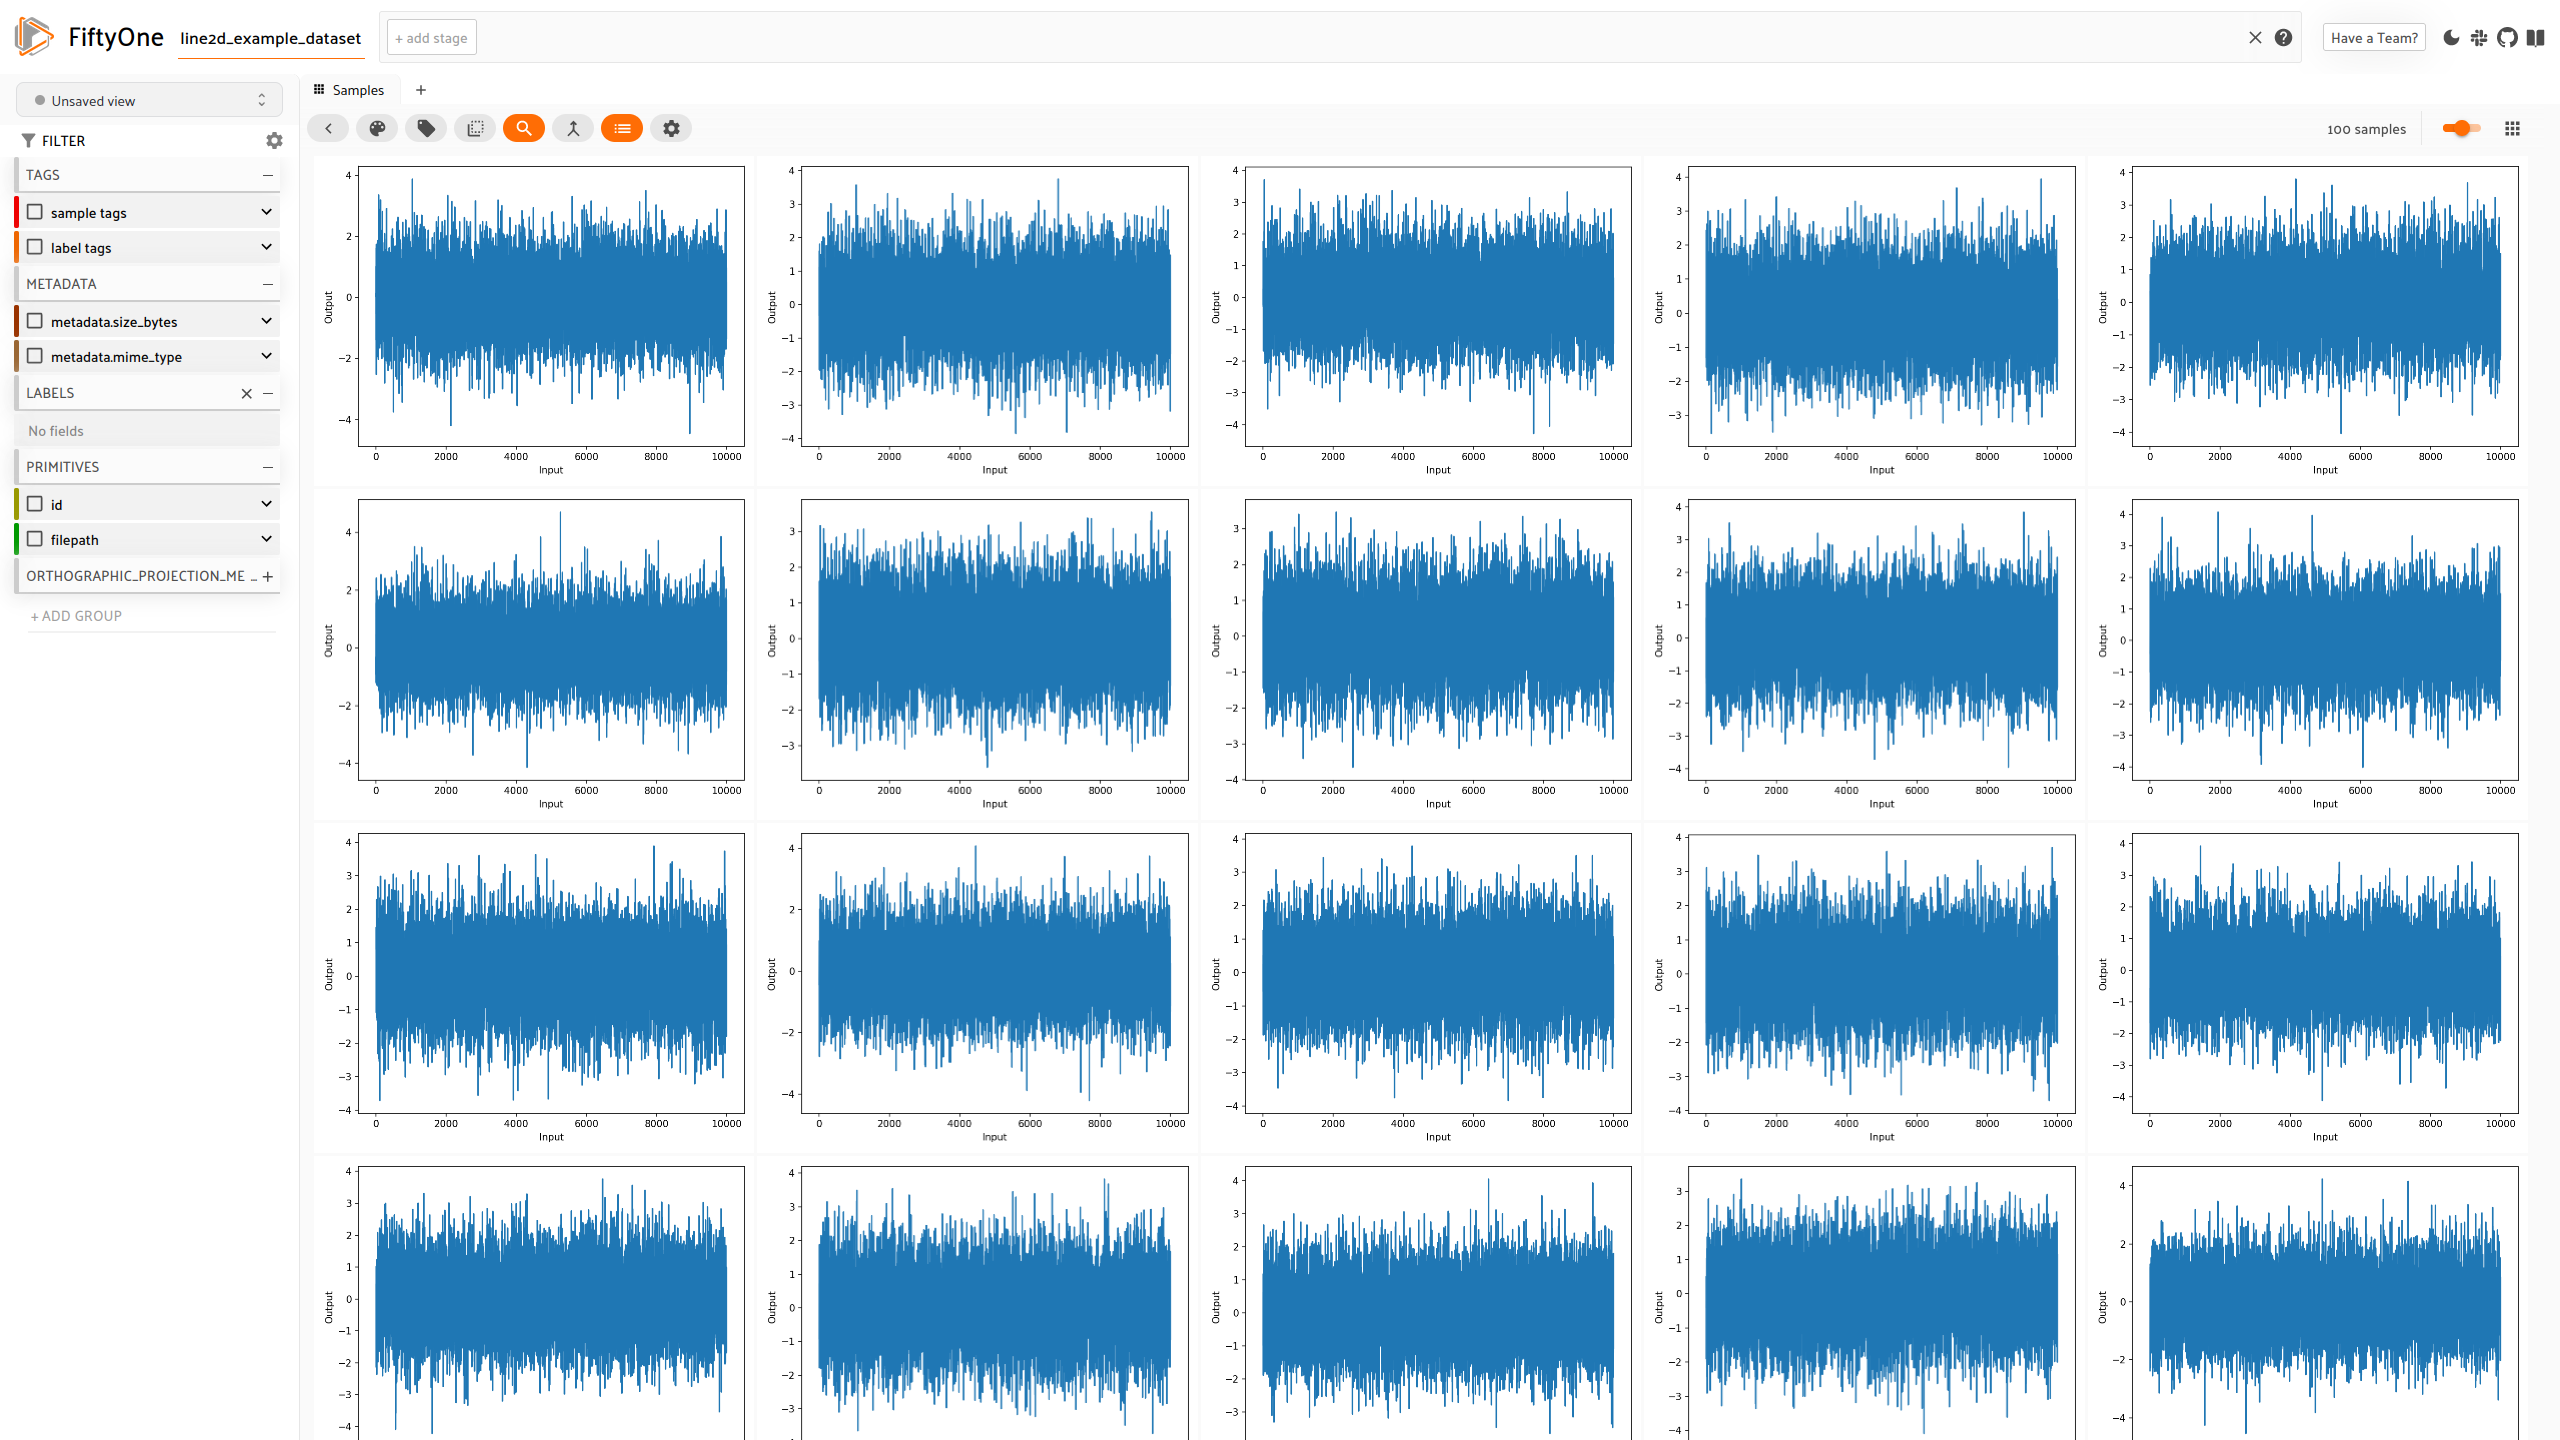
This plugin uses eCharts to visualize x,y-Points as a line chart. For now the visualizer component can only be overwritte by a plugin if its filepath has an ".pcd"-extension.
So files has to be converted to be usable with this plugin. It expects json files with an ".pcd"-extension with json["x"] representing the x-coordinates and json["y"] the y-coordinates.
{"x": [0, 1, 2, 3], "y": [0.46, -0.20, 1.21, 0.69]}In LoadExampleData in __init__.py you can see how data can be gernerated.
The plugin also adds two buttons "Genrate Thumbnails" and "Generate Example Dataset".
To install the plugin, run the following command:
fiftyone plugins download https://github.com/wayofsamu/line2d- Generate an example dataset at given path
- Generate thumbnails into the same directory as the dataset files are