Ruuvi graph is an application for plotting temperature, humidity and air pressure based on Ruuvi tags measurements. There are several similar apps but all seem to be doing too much. Hence, this project was born. I'm not completely happy about the implementation details and a few aspects but better release it than hold it. Pull requests are warmly welcomed.
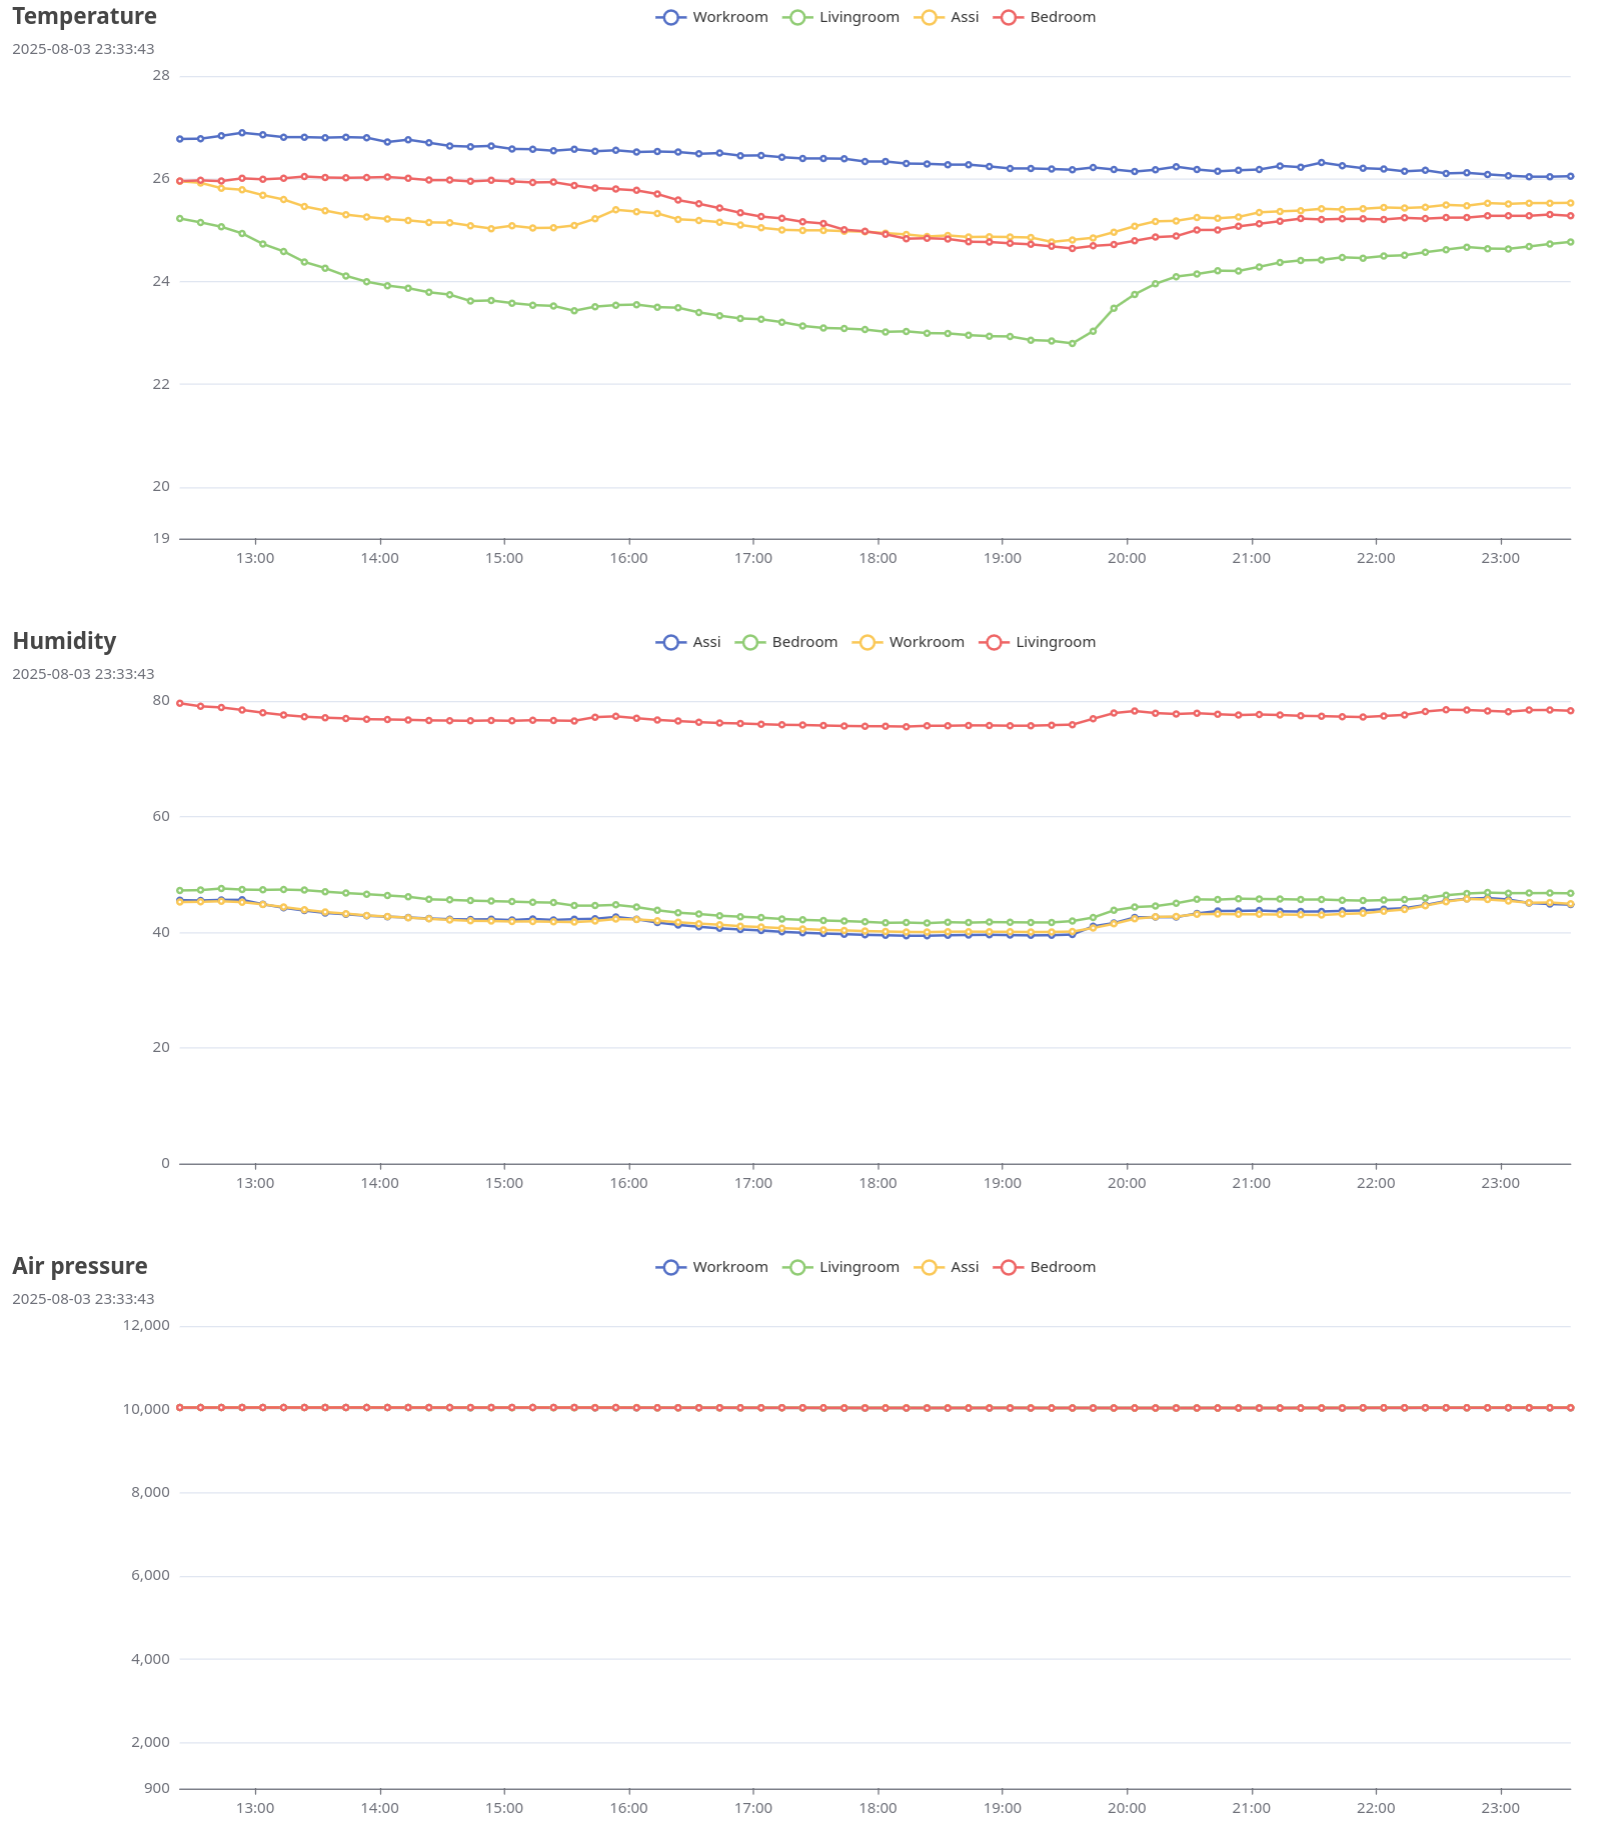
An example graph which consists four sensors:

Charasteristics this application has:
- Single binary deployment
- Cross-compilation possible, hence compile on a different machine where it's being run
- No external service dependencies
- No need to run time series database or MQTT etc.
- Avoids extensive writes to disk
- Extremely important on Raspberry Pi and other machines which use micro SD cards
- When a scan is performed, it's possible the certain Ruuvis will have time to report their values more than once. One those occasions graph looks a bit dirty. The proper solution should be to only take the latest value.
- Go > 1.19 (maybe older are okay too)
Build a single executable binary for the given machine:
make buildSee the list of supported operating systems and archs:
go tool dist listCross compile binary to some other architecture:
make GOARCH=arm buildDefaults should be sufficient for most usage cases and no further adjustments is needed.
Defaults can be examined with ./ruuvigraph -h command.
Pay attention to filenames when examining the output.
Aliases file can be configured to map MAC addresses to user friendly names.
E.g. Ruuvitag with aa:bb:cc:dd:ee:ff MAC address is converted to Kitchen.
Copy an example aliases file from pkg/ruuvi/example_devices.conf to cmd/aliases.conf and
edit it to match your needs.
Simplest case it's:
sudo ./dist/ruuvigraphSudo is needed to interact with a bluetooth device.
Better option would be to grant access to certain dedicated user only with e.g. bluetooth group access.
Or use doas or such with minimal access rights.
Lessons learned while doing this Sunday hack up and will be implemented for the version 2.0:
- Separate service for graph plotting and data collection
- Possible to host and store data on a different host
- Keep data events on memory and
- write to disk
- or send to an another host
- Configurable data retention period