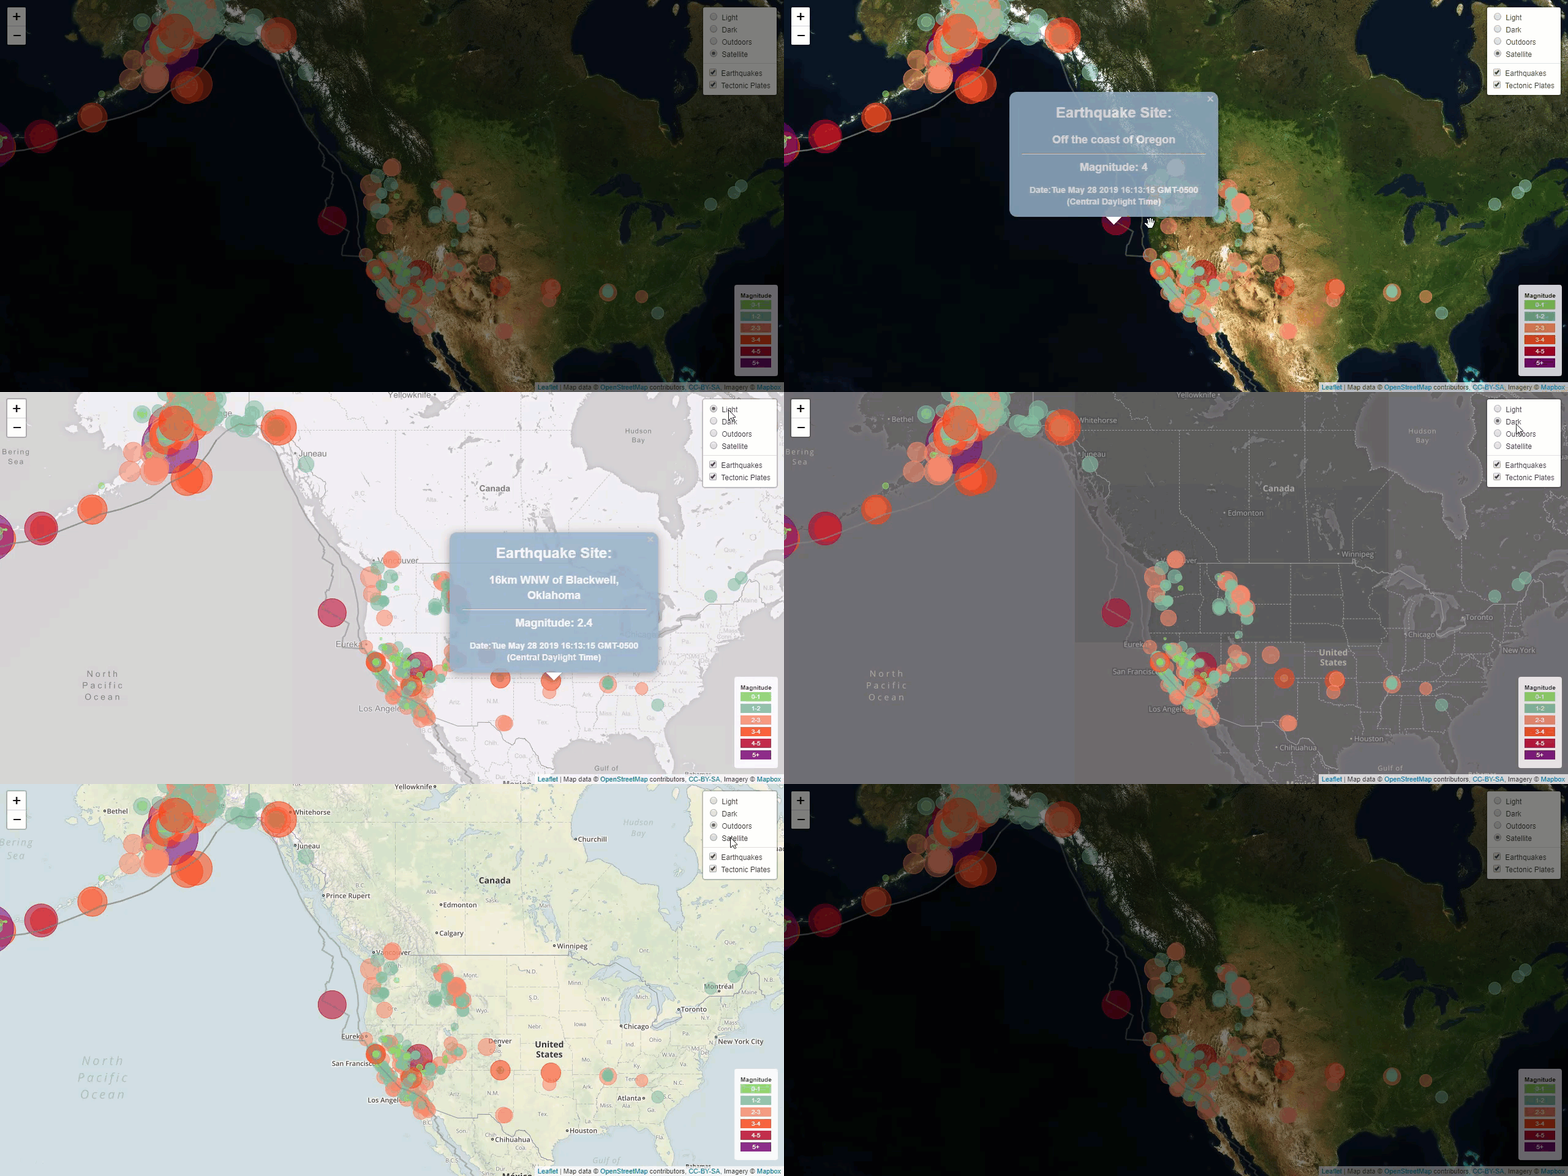
Web App URL: Web App URL : https://wenbin-billy-zhao.github.io/Map_Visualization_with_Leaflet_GeoJson/
Create a map using Leaflet that plots all of the earthquakes from your data set based on their longitude and latitude.
The USGS provides earthquake data in a number of different formats, updated every 5 minutes. Visit the USGS GeoJSON Feed page and pick a data set to visualize. When you click on a data set, for example 'All Earthquakes from the Past 7 Days', you will be given a JSON representation of that data. You will be using the URL of this JSON to pull in the data for our visualization.
The USGS wants you to plot a second data set on your map to illustrate the relationship between tectonic plates and seismic activity. You will need to pull in a second data set and visualize it along side your original set of data. Data on tectonic plates can be found at https://github.com/fraxen/tectonicplates.
-
Plot a second data set on our map.
-
Add a number of base maps to choose from as well as separate out our two different data sets into overlays that can be turned on and off independently.
-
Add layer controls to our map.
