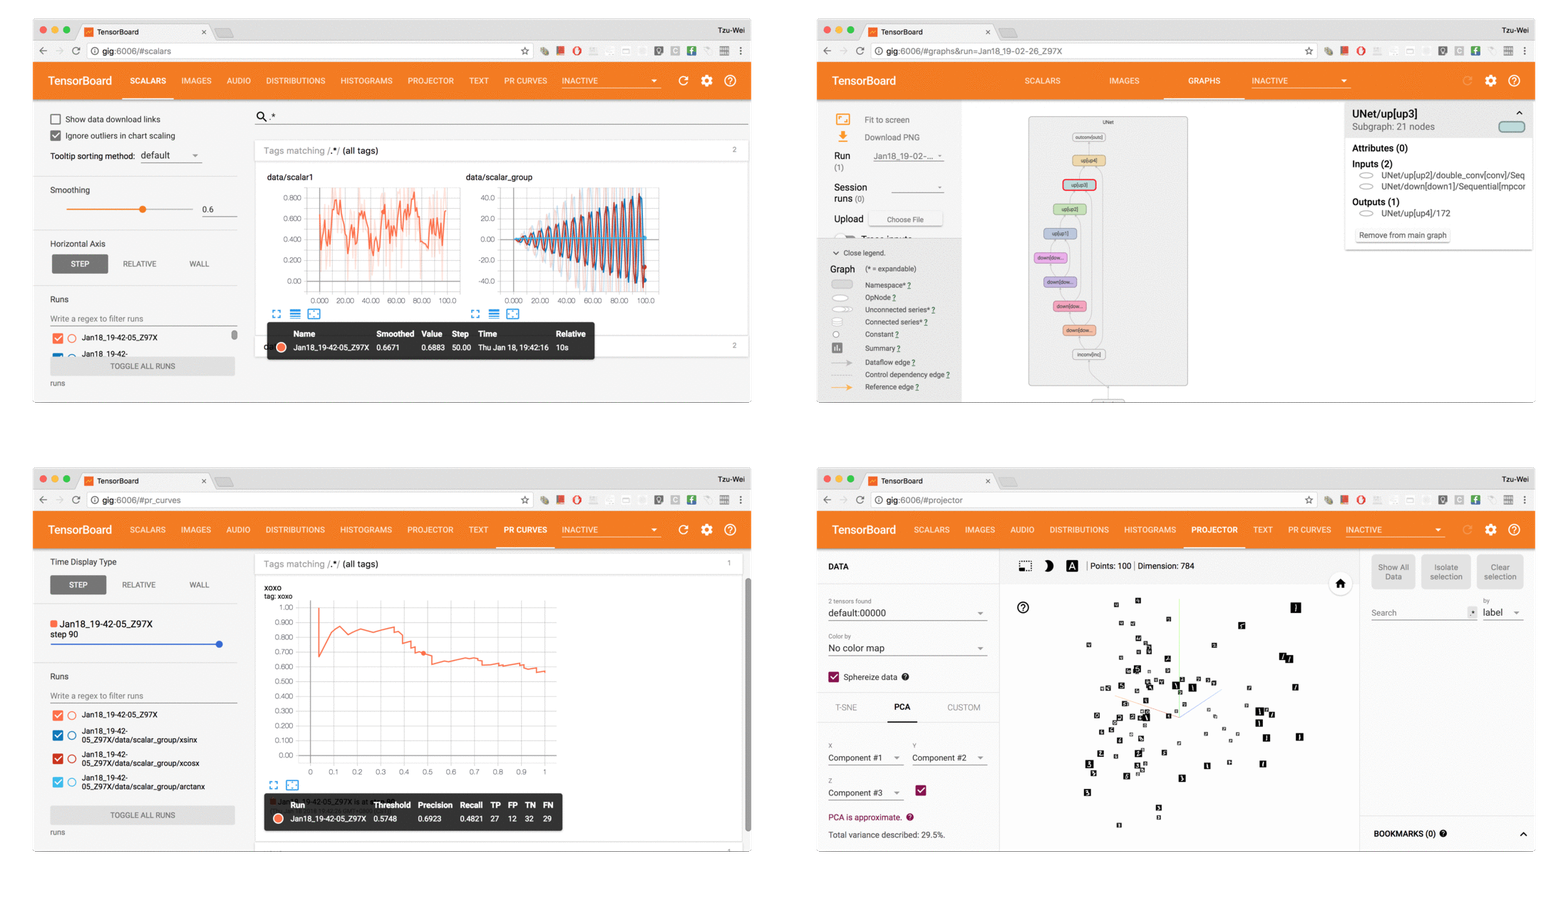
Write TensorBoard events with simple function call.
The current release (v2.1) is tested on anaconda3, with PyTorch 1.5.1 / torchvision 0.6.1 / tensorboard 2.2.2.
-
Support
scalar,image,figure,histogram,audio,text,graph,onnx_graph,embedding,pr_curve,mesh,hyper-parametersandvideosummaries.
pip install tensorboardX
or build from source:
pip install 'git+https://github.com/lanpa/tensorboardX'
You can optionally install crc32c to speed up.
pip install crc32c
Starting from tensorboardX 2.1, You need to install soundfile for the add_audio() function (200x speedup).
pip install soundfile
- Clone the files in https://github.com/lanpa/tensorboardX/tree/master/examples
- Run the demo script: e.g.
python examples/demo.py - Start TensorBoard with
tensorboard --logdir runs
# demo.py

import torch
import torchvision.utils as vutils
import numpy as np
import torchvision.models as models
from torchvision import datasets
from tensorboardX import SummaryWriter

resnet18 = models.resnet18(False)
writer = SummaryWriter()
sample_rate = 44100
freqs = [262, 294, 330, 349, 392, 440, 440, 440, 440, 440, 440]

for n_iter in range(100):

    dummy_s1 = torch.rand(1)
    dummy_s2 = torch.rand(1)
    # data grouping by `slash`
    writer.add_scalar('data/scalar1', dummy_s1[0], n_iter)
    writer.add_scalar('data/scalar2', dummy_s2[0], n_iter)

    writer.add_scalars('data/scalar_group', {'xsinx': n_iter * np.sin(n_iter),
                                             'xcosx': n_iter * np.cos(n_iter),
                                             'arctanx': np.arctan(n_iter)}, n_iter)

    dummy_img = torch.rand(32, 3, 64, 64)  # output from network
    if n_iter % 10 == 0:
        x = vutils.make_grid(dummy_img, normalize=True, scale_each=True)
        writer.add_image('Image', x, n_iter)

        dummy_audio = torch.zeros(sample_rate * 2)
        for i in range(x.size(0)):
            # amplitude of sound should in [-1, 1]
            dummy_audio[i] = np.cos(freqs[n_iter // 10] * np.pi * float(i) / float(sample_rate))
        writer.add_audio('myAudio', dummy_audio, n_iter, sample_rate=sample_rate)

        writer.add_text('Text', 'text logged at step:' + str(n_iter), n_iter)

        for name, param in resnet18.named_parameters():
            writer.add_histogram(name, param.clone().cpu().data.numpy(), n_iter)

        # needs tensorboard 0.4RC or later
        writer.add_pr_curve('xoxo', np.random.randint(2, size=100), np.random.rand(100), n_iter)

dataset = datasets.MNIST('mnist', train=False, download=True)
images = dataset.test_data[:100].float()
label = dataset.test_labels[:100]

features = images.view(100, 784)
writer.add_embedding(features, metadata=label, label_img=images.unsqueeze(1))

# export scalar data to JSON for external processing
writer.export_scalars_to_json("./all_scalars.json")
writer.close()To add more ticks for the slider (show more image history), check lanpa#44 or tensorflow/tensorboard#1138

