#Power BI Visuals Documentation
Learn how to build Power BI visuals. We're still working on these docs, but they should be ready by 8/2/2016.
##Developing Your First PowerBI Visual
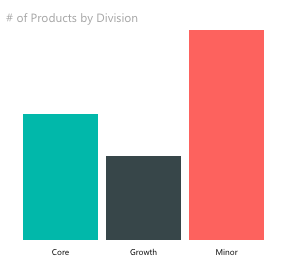
This section is to provide you with a step by step tutorial of developing your first PowerBI visual. In this tutorial, you will be building a simple bar chart. The source code is located here in the Sample Bar Chart Repo.
- Install PowerBI visuals CLI tool
- Install SSL certifications to enable live preview of visuals
- Enable Developer Tools in PowerBI
- Create New PowerBI Visual Project
- Start Development Server for Live Update and Incremental Development
- Adding the Debug Visual from the Visual Well into your Favorite Report
- Adding External Libraries
- Installing Typings for Libraries
- Building a Visual with Static Data
- Adding Databinding to the Bar Chart
- Adding Color to the Bar Chart
- Adding Selection and Interaction with Other Visuals
- Adding Static Objects to Property Pane
- Adding Databound Objects to Property Pane
- Finally Package for Distribution ... Done!
##Table of Contents
