** /!\ Work in progress, this README needs to be completed. **
To demonstrate a Smart Meter Big Data Application.
- First, create your
docker-compose-merge.ymlfile thanks to combine_services.sh, which makes use of yamlreader:- When Docker Secrets are provided:
./compose/combine_services.sh "_secrets" root_metrics inject_metrics streaming_metrics prediction_metrics > docker-compose-merge.ymlordocker run logimethods/smart-meter:compose "_secrets" root_metrics inject_metrics streaming_metrics prediction_metrics > docker-compose-merge.yml - When Docker Secrets are NOT provided:
./compose/combine_services.sh "_no-secrets" root_metrics inject_metrics streaming_metrics prediction_metrics > docker-compose-merge.ymlordocker run logimethods/smart-meter:compose "_no-secrets" root_metrics inject_metrics streaming_metrics prediction_metrics > docker-compose-merge.yml
- When Docker Secrets are provided:
- Last, but not least, start the services based on the previously generated
docker-compose-merge.ymlfile:
./docker-[local | remote]-[single | cluster]-up.sh
.../...
./docker-[local | remote]-down.sh
> python3 -i ./start-services.py
>>> run_inject()
>>> run_app_batch()
...
>>> stop_all()
...
>>> exit()
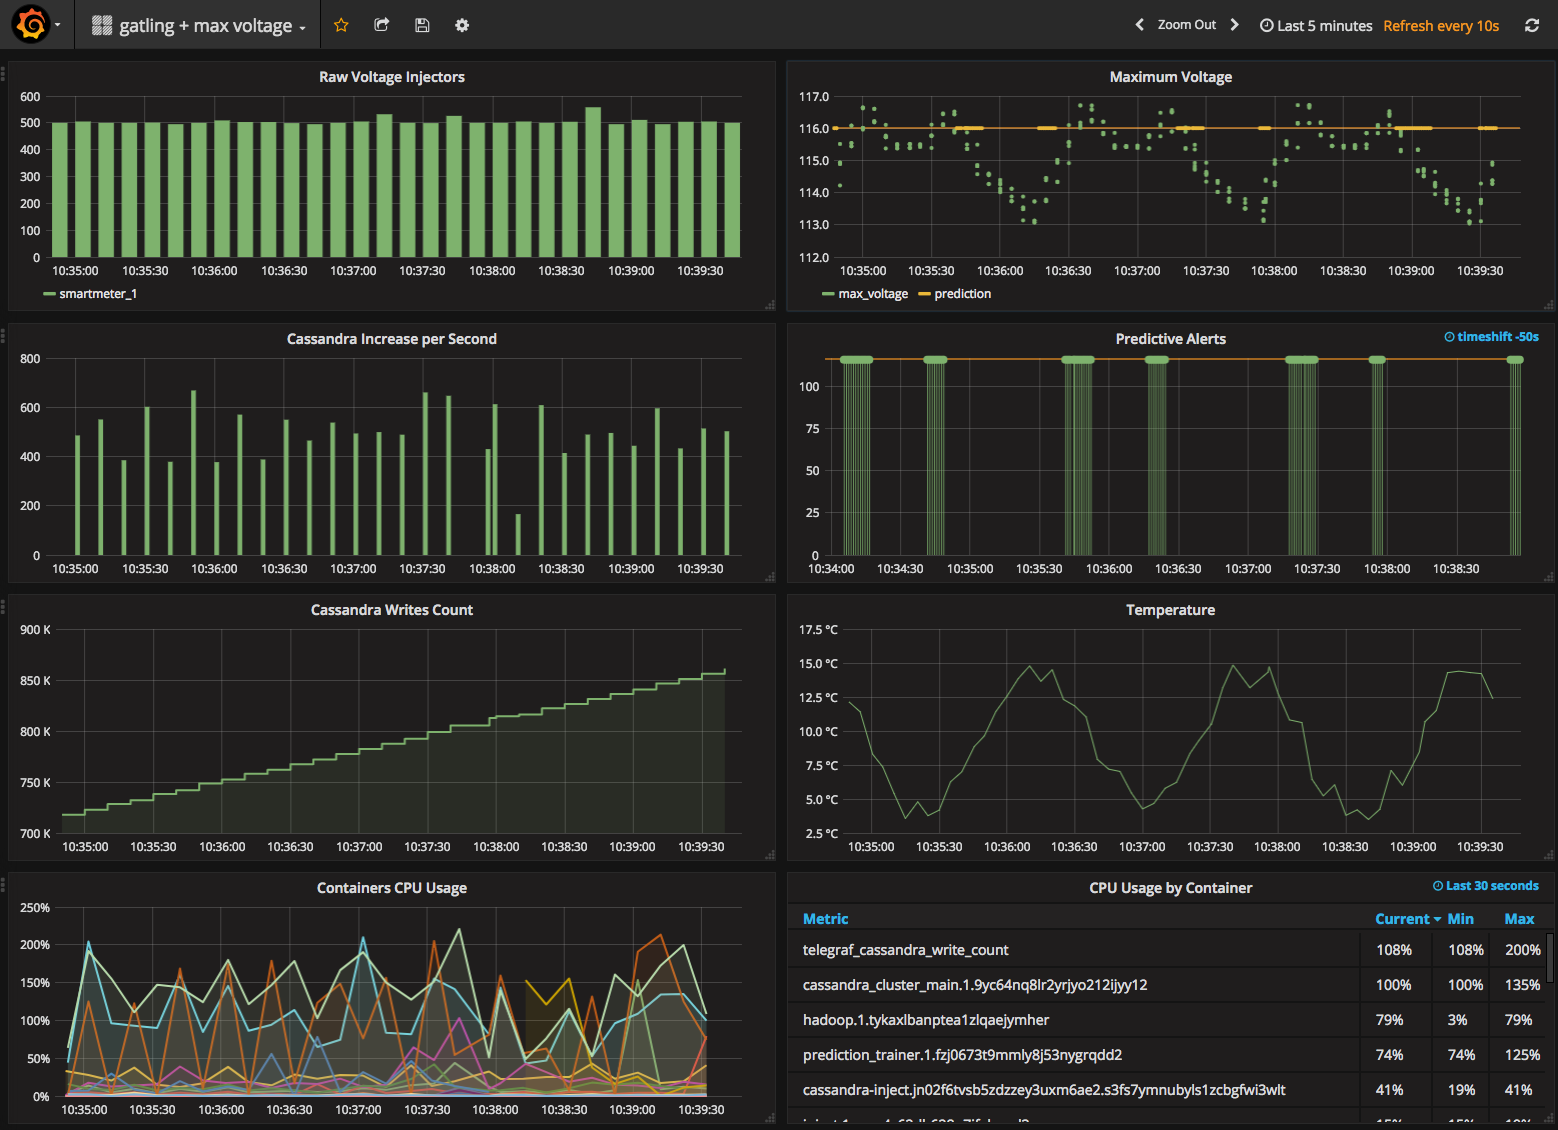
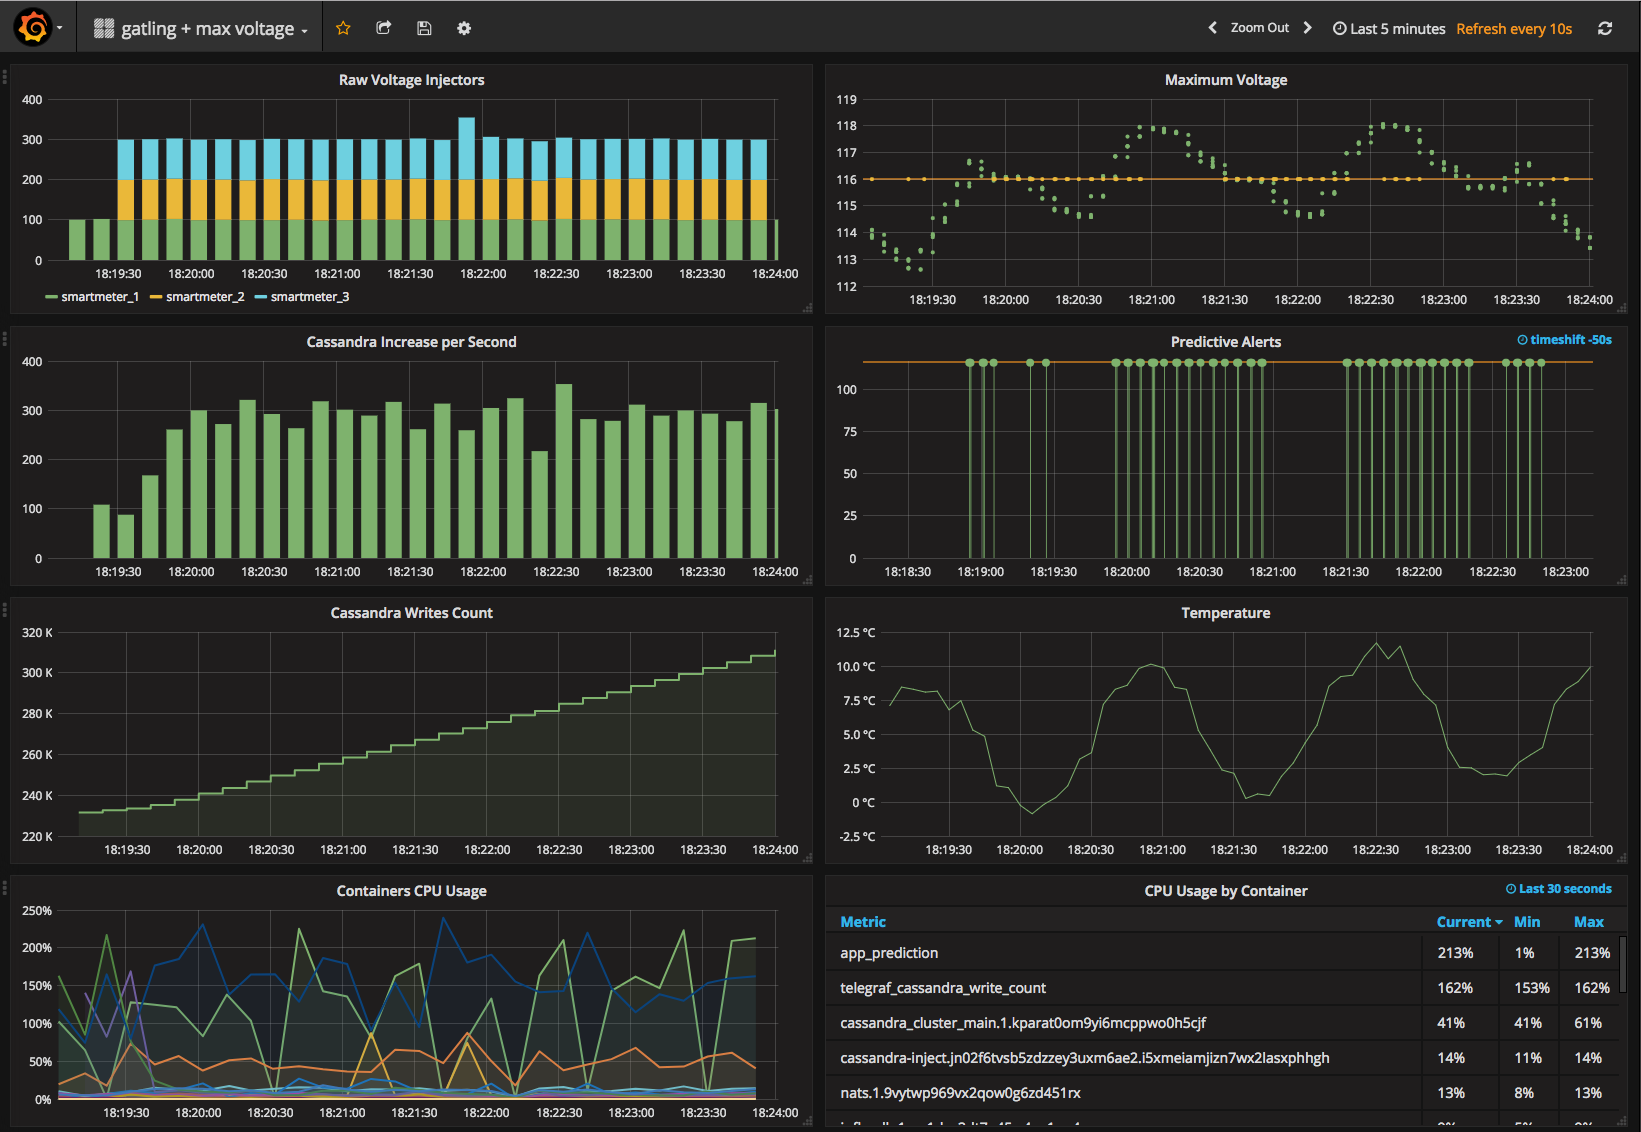
Setup the Grafana Data Sources (see bellow) + Import gatling + max voltage.json
http://localhost/dashboard/db/gatling-max-voltage
In parallel, you can play with the number of injectors:
> docker service scale inject=2
> docker service scale inject=1
> ./build_DEV.sh
> ./stop.sh
> python3 -i start-services.py "local" "single" "-DEV"
Images will be postfixed by -DEV
>>> run_inject()
> ssh -NL localhost:2374:/var/run/docker.sock docker@xxxxx.amazonaws.com &
> python3 -i ./start-services.py "remote" "cluster"
> Remote Docker Client
>>> run_inject_cluster()
...
>>> stop_all()
...
>>> exit()
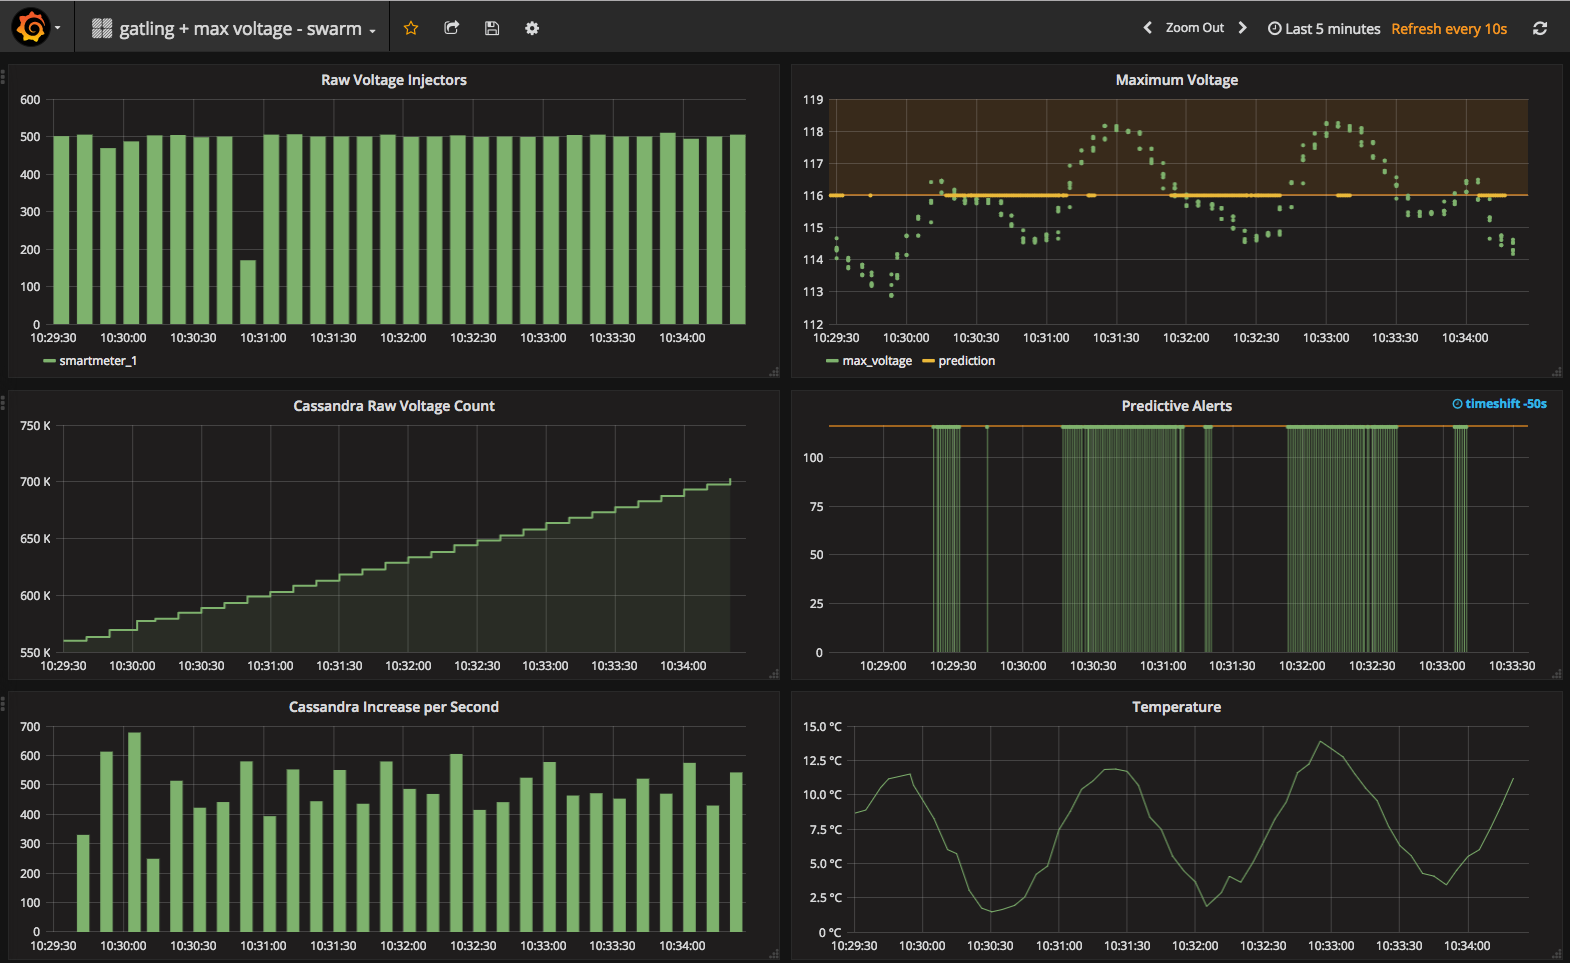
Setup the Grafana Data Sources (see bellow) + Import gatling + max voltage - swarm.json.
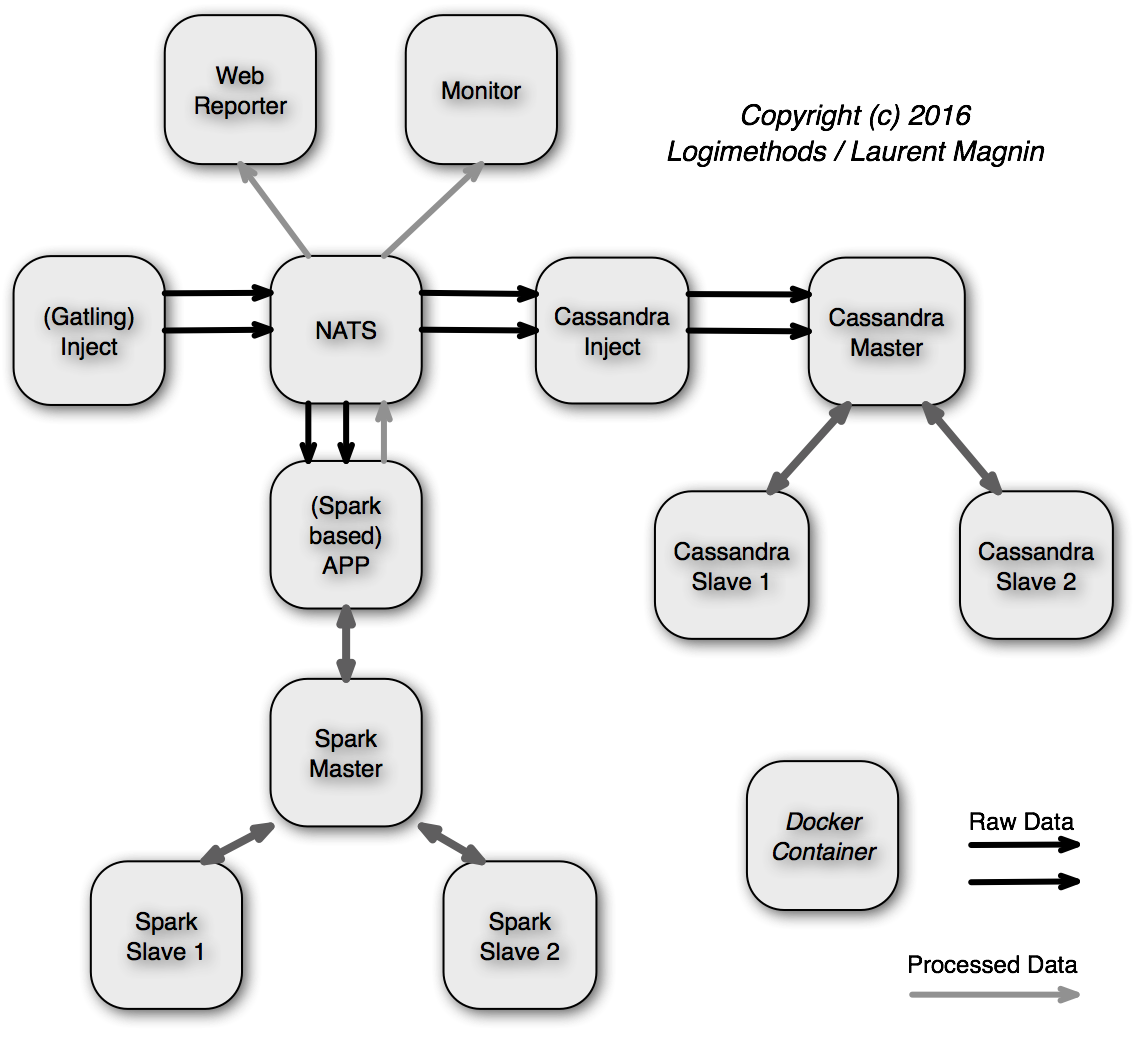
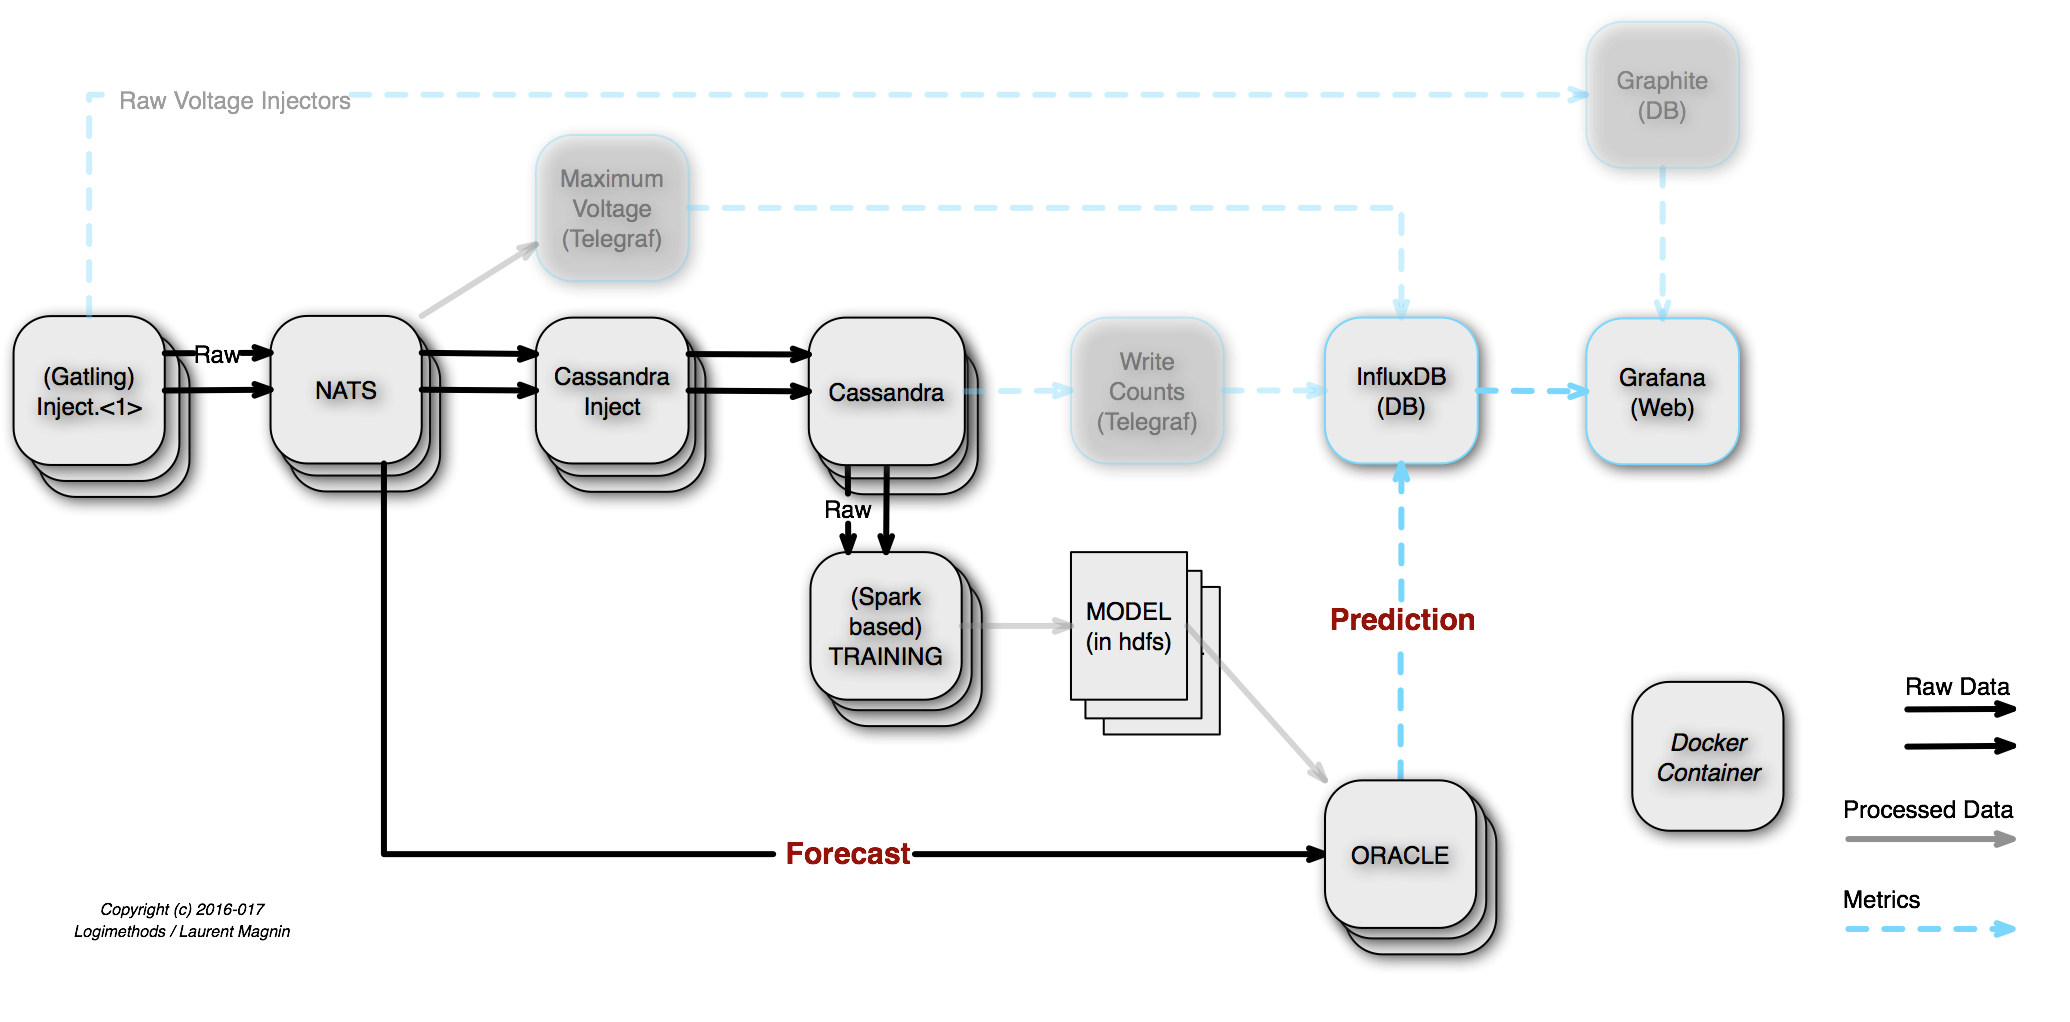
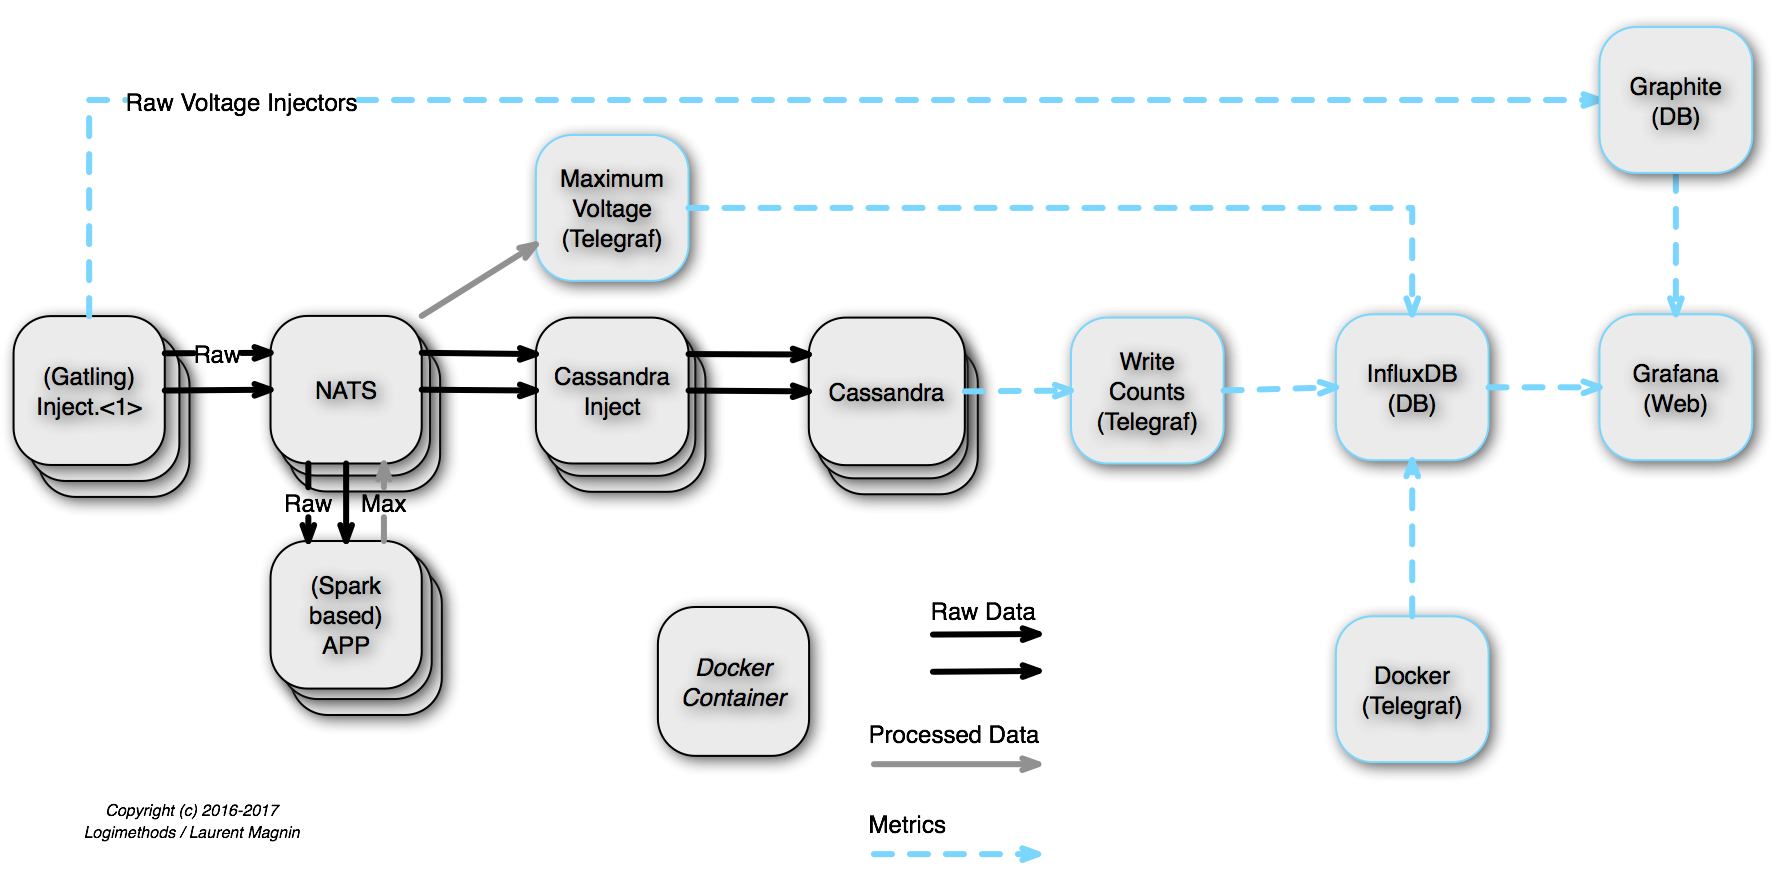
The Injection demo architecture:
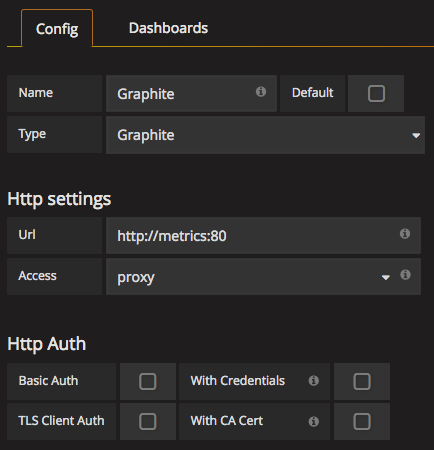
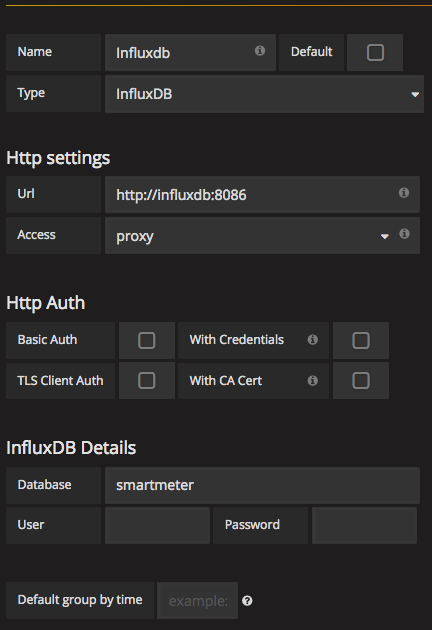
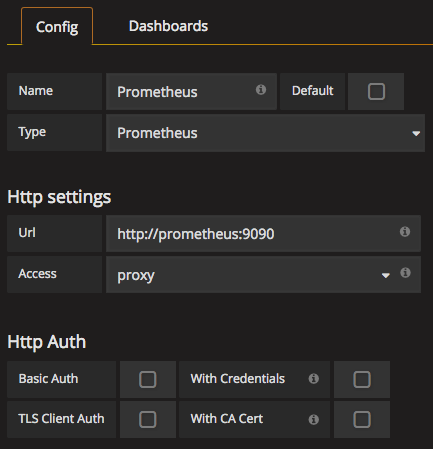
From Grafana, setup the Graphite, InfluxDB & Prometheus Data Sources (see bellow).
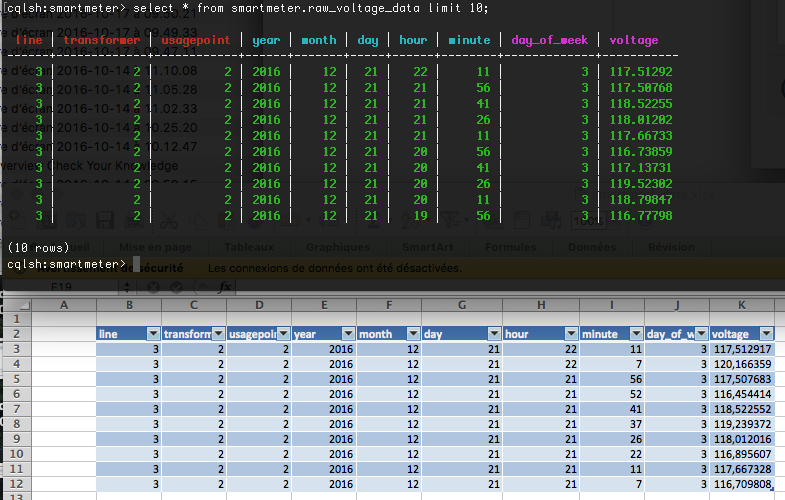
To access to the RAW Voltage Data:
> ./cqlsh.sh
Connected to Smartmeter Cluster at 127.0.0.1:9042.
[cqlsh 5.0.1 | Cassandra 3.5 | CQL spec 3.4.0 | Native protocol v4]
Use HELP for help.
cqlsh> select * from smartmeter.raw_data limit 2;

line | transformer | usagepoint | year | month | day | hour | minute | day_of_week | demand | val10 | val11 | val12 | val3 | val4 | val5 | val6 | val7 | val8 | val9 | voltage
------+-------------+------------+------+-------+-----+------+--------+-------------+--------+-------+-------+-------+------+------+------+------+------+------+------+-----------
  11 |           2 |          5 | 2019 |     3 |  17 |   12 |     13 |           0 |    100 |    10 |    11 |    12 |    3 |    4 |    5 |    6 |    7 |    8 |    9 | 114.76842
  11 |           2 |          5 | 2019 |     3 |  17 |   11 |     58 |           0 |    100 |    10 |    11 |    12 |    3 |    4 |    5 |    6 |    7 |    8 |    9 | 114.10834
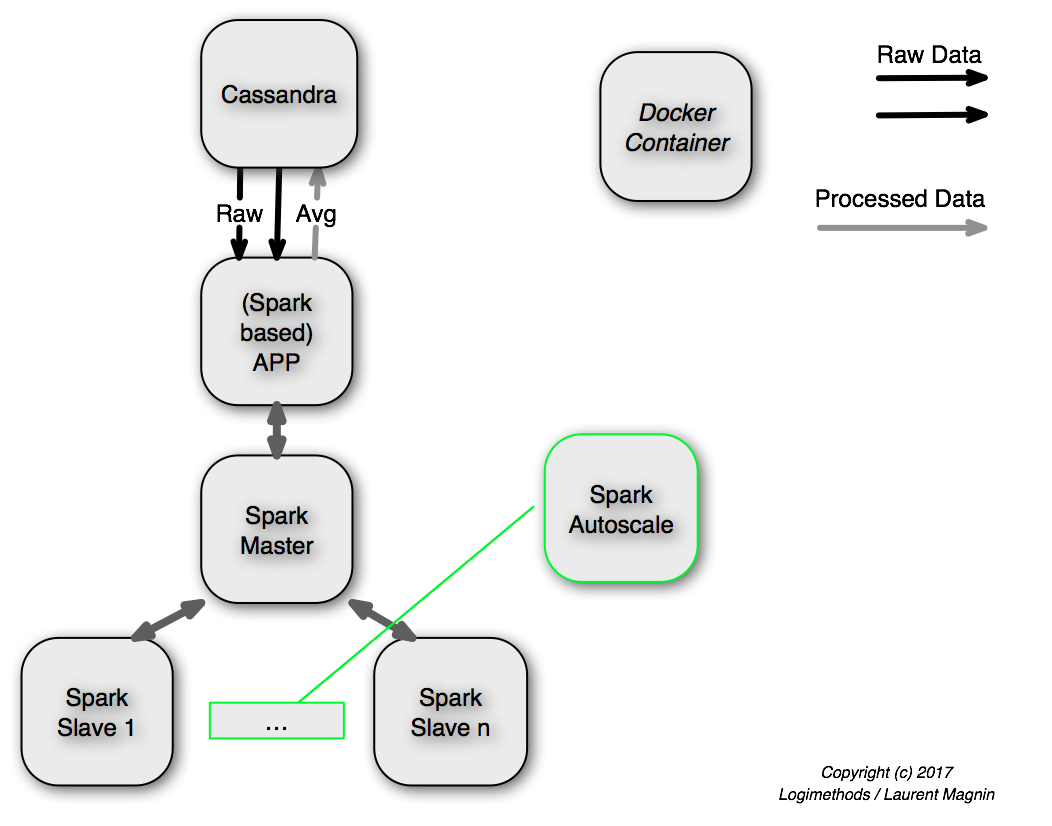
See Multilayer perceptron classifier and SparkPredictionProcessor.scala
+-----+----------+----+--------------------+--------------------+---------+-----------+--------------------+----------+
|label|   voltage|hour|             hourSin|             hourCos|dayOfWeek|temperature|            features|prediction|
+-----+----------+----+--------------------+--------------------+---------+-----------+--------------------+----------+
|    0| 115.36195|  13| -12.940958284226115| -48.296289698960514|        0| -1.1098776|[-12.940958284226...|       0.0|
|    0|115.378006|  14| -24.999994594456457|   -43.3012733101135|        0|  16.545746|[-24.999994594456...|       0.0|
|    0|  116.9641|   3|   35.35533905932737|   35.35533905932738|        0|   4.004334|[35.3553390593273...|       0.0|
|    1| 118.92017|  23|  -12.94095828422611|  48.296289698960514|       50|  21.167358|[-12.940958284226...|       0.0|
|    1| 119.15324|  12|6.123233995736766...|               -50.0|       50| -12.110409|[6.12323399573676...|       1.0|
|    0|  115.1506|  14| -24.999994594456457|   -43.3012733101135|        0|  10.854811|[-24.999994594456...|       0.0|
|    0|115.264404|  14| -24.999994594456457|   -43.3012733101135|        0|  17.071587|[-24.999994594456...|       0.0|
.../...
|    1| 117.36004|   9|   35.35533905932738|  -35.35533905932737|       50|  -12.67373|[35.3553390593273...|       1.0|
|    1| 117.69681|  19|  -48.29628969896052|   12.94095828422609|       50|  17.909231|[-48.296289698960...|       0.0|
|    1|117.809166|  21| -35.355339059327385|   35.35533905932737|        0|   7.070238|[-35.355339059327...|       1.0|
|    0| 115.50017|  16|  -43.30127331011349|  -24.99999459445649|        0|  18.125008|[-43.301273310113...|       0.0|
+-----+----------+----+--------------------+--------------------+---------+-----------+--------------------+----------+
only showing top 20 rows

Test set accuracy = 0.9642857142857143
The generated ML Models are stored in HDFS (on port 50070): Browsing HDFS
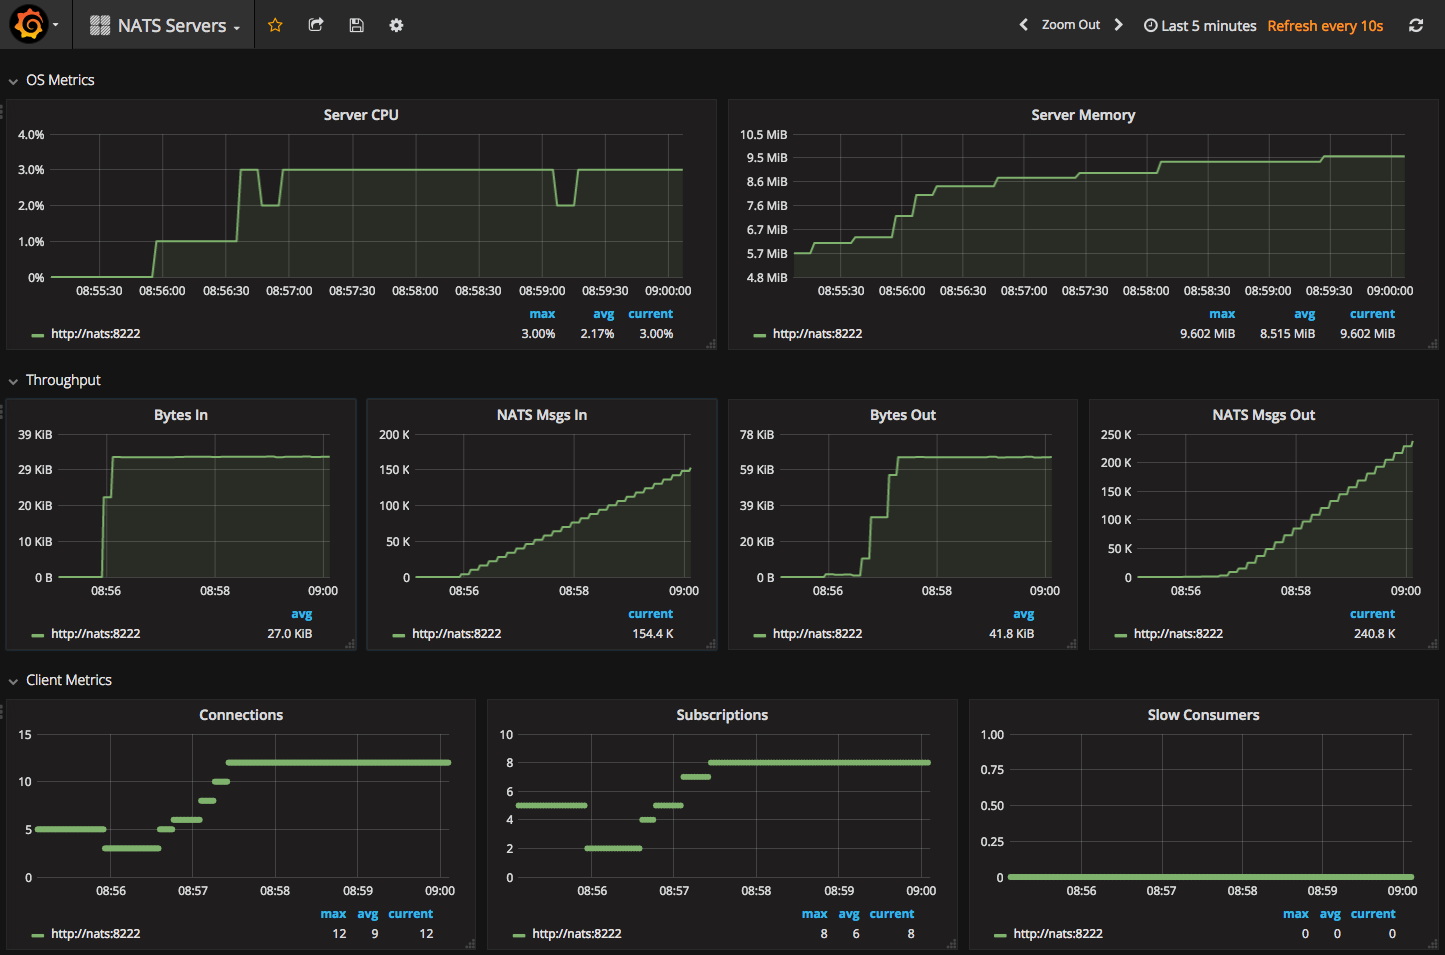
Setup the Grafana Data Sources + Import NATS Servers.json.
- Get the Driver from http://www.simba.com/drivers/cassandra-odbc-jdbc/
- Follow the Installation Instructions (on MacOS, don't forget first to install iODBC)
- Save the Licence file you received by Mail (
SimbaApacheCassandraODBCDriver.lic) into the right location
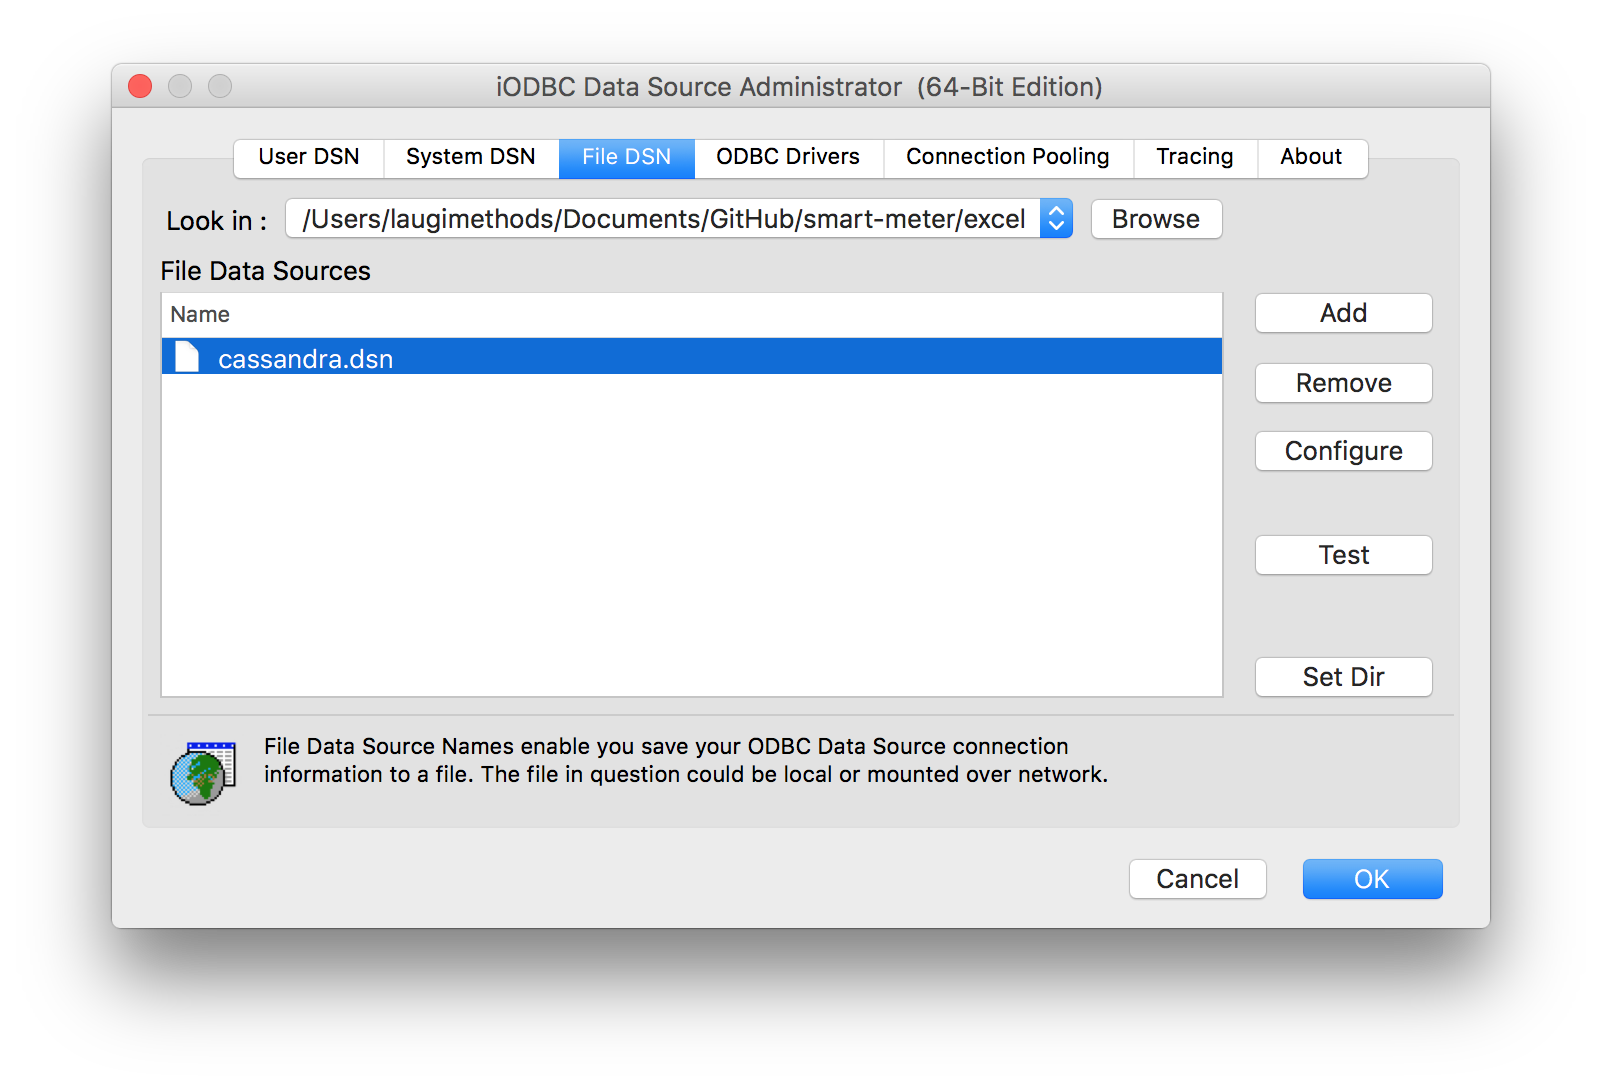
- Define a SDN file, such as excel/cassandra.dsn
- You could load & test it directly through the iODBC Administrator App:
- You might use the SQL syntax, such as
select * from smartmeter.raw_data limit 10; - Et Voilà!
