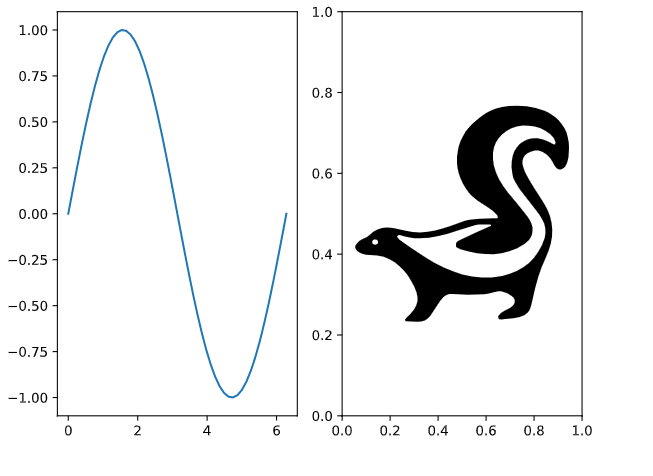
Insert SVG images into matplotlib elements. Can be used to also compose matplotlib plots by nesting them.
pip install skunkTo show generated SVGs in Jupyter Notebooks:
skunk.display(svg)import skunk
import numpy as np
import os
import matplotlib.pyplot as plt
fig, axs = plt.subplots(ncols=2)
x = np.linspace(0, 2 * np.pi)
axs[0].plot(x, np.sin(x))
# important line where we set ID
skunk.connect(axs[1], 'sk')
plt.tight_layout()
# Overwrite using file path to my svg
# Can also use a string that contains the SVG
svg = skunk.insert(
{
'sk': 'skunk.svg'
})
# write to file
with open('replaced.svg', 'w') as f:
f.write(svg)
# or in jupyter notebook
skunk.display(svg)Read about annotation boxes first
import skunk
from matplotlib.offsetbox import AnnotationBbox
import numpy as np
import matplotlib.pyplot as plt

fig, ax = plt.subplots()

x = np.linspace(0, 2 * np.pi)
ax.plot(x, np.sin(x))

# new code: using skunk box with id sk1
box = skunk.Box(50, 50, 'sk1')
ab = AnnotationBbox(box, (np.pi / 2, 1),
                    xybox=(-5, -100),
                    xycoords='data',
                    boxcoords='offset points',
                    arrowprops=dict(arrowstyle="->"))
ax.add_artist(ab)

# sknunk box with id sk2
box = skunk.Box(50, 50, 'sk2')
ab = AnnotationBbox(box, (3 * np.pi / 2, -1),
                    xybox=(-5, 100),
                    xycoords='data',
                    boxcoords='offset points',
                    arrowprops=dict(arrowstyle="->"))

ax.add_artist(ab)

# insert current figure into itself at sk1
# insert svg file in sk2
svg = skunk.insert(
    {
        'sk1': skunk.pltsvg(),
        'sk2': 'skunk.svg'
    })

# write to file
with open('replaced2.svg', 'w') as f:
    f.write(svg)
# or in jupyter notebook
skunk.display(svg)Sometimes you may want a raster image to appear if not using an SVG. This can be done with an ImageBox.
The example above is identical, except we replace the skunk.Box with a skunk.ImageBox that has the same
arguments (after first) as OffsetImage
# use image box, so can have PNG when not in SVG
with open('skunk.png', 'rb') as file:
    skunk_img = plt.imread(file)
box = skunk.ImageBox('sk2', skunk_img, zoom=0.1)You can see that the inner image contains the raster now instead of the blue rectangle. This example is overly fancy, normally you won't be recursively nesting plots so the raster image will only appear if you're not using SVG.
I prefer cairosvg:
import cairosvg
cairosvg.svg2pdf(bytestring=svg, write_to='image.pdf')Sometimes you just want to slap a bunch of SVGs together into a grid. You can do that with this method:
svg = skunk.layout_svgs(svgs)

