


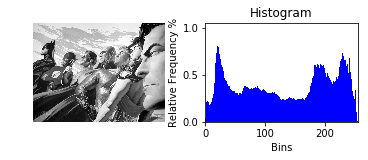
Converts all the images found in a directory to grayscale and plots the Relative Frequency Histogram for each image.
This Jupyter Notebook shows step by step, the process of visualizing the Histogram of the Relative Frequency of images using Python.
- PIL
- glob
- matplotlib
- numpy
- os
You can install missing dependencies with pip.
- Install the dependencies;
- Run Jupyter Notebook in terminal to see the code in your browser.
Code released under the MIT license.