import pandas as pd
import seaborn as sns
df = pd.read_csv('gpu-performance.csv')
|
GPU |
fit |
Tensor_Cores |
transistors_M |
CUDA_Cores |
TFLOPS_(FP16) |
gpu_mem |
CPUs |
MEM_(GB) |
| 0 |
A100 |
280 |
432 |
54,000 |
6912 |
78.0000 |
40.5 |
12 |
85 |
| 1 |
V100 |
529 |
640 |
21,100 |
5120 |
31.4000 |
16.0 |
8 |
30 |
| 2 |
P100 |
846 |
0 |
15,300 |
3840 |
19.0000 |
16.0 |
4 |
15 |
| 3 |
T4 |
1508 |
320 |
14 |
2560 |
65.0000 |
16.0 |
8 |
30 |
| 4 |
T4-Colab |
1608 |
320 |
14 |
2560 |
65.0000 |
16.0 |
2 |
12 |
| 5 |
K80 |
3184 |
0 |
7 |
4992 |
0.0000 |
12.0 |
4 |
15 |
| 6 |
Macbook-AMD-Metal |
3769 |
0 |
6 |
0 |
6.4000 |
4.0 |
6 |
16 |
| 7 |
Macbook-CPU |
57236 |
0 |
3,000 |
0 |
0.0025 |
0.0 |
6 |
16 |
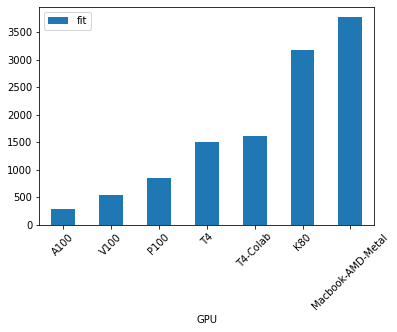
Peformance~GPU (less is faster)
p = df[['GPU','fit']].iloc[:-1].plot.bar(x='GPU', y='fit', rot=45)
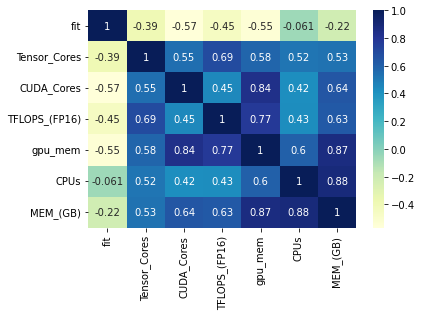
df.corr()[['fit']].sort_values('fit')
|
fit |
| CUDA_Cores |
-0.567090 |
| gpu_mem |
-0.545376 |
| TFLOPS_(FP16) |
-0.454271 |
| Tensor_Cores |
-0.387415 |
| MEM_(GB) |
-0.223066 |
| CPUs |
-0.060719 |
| fit |
1.000000 |
dataplot = sb.heatmap(df.corr(), cmap="YlGnBu", annot=True)