
Climate analysis on Honolulu, Hawaii.
Used Python and SQLAlchemy to do basic climate analysis and data exploration of the climate database using SQLAlchemy ORM queries, Pandas, and Matplotlib.
-
Used SQLAlchemy
create_engineto connect to the sqlite database. -
Used SQLAlchemy
automap_base()to reflect the tables into classes and save a reference to those classes calledStationandMeasurement.
-
Designed a query to retrieve the last 12 months of precipitation data.
-
Selected only the
dateandprcpvalues. -
Loaded the query results into a Pandas DataFrame and set the index to the date column.
-
Sorted the DataFrame values by
date. -
Plotted the results using the DataFrame
plotmethod.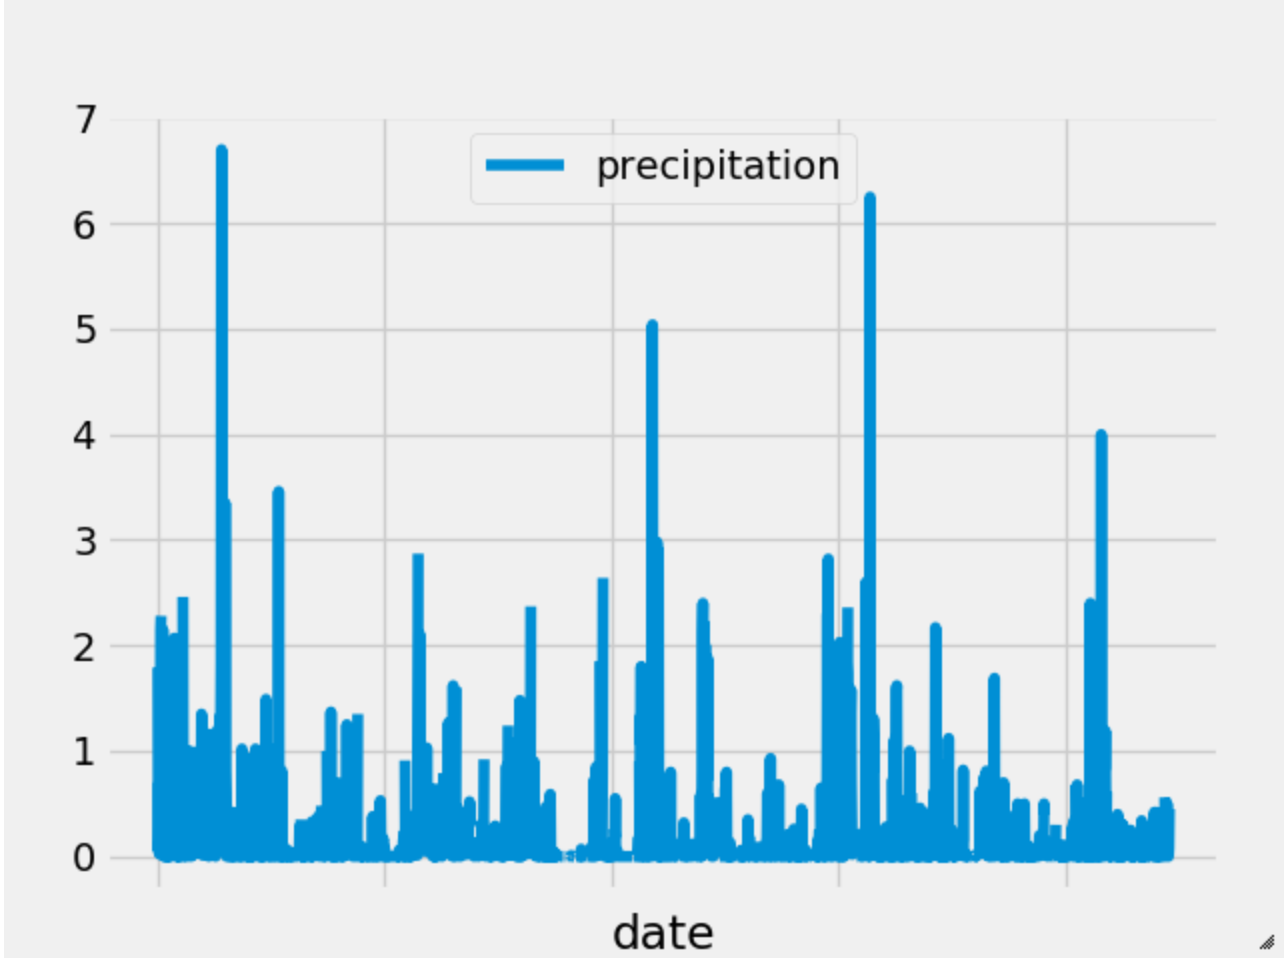
-
Used Pandas to print the summary statistics for the precipitation data.

-
Designed a query to calculate the total number of stations.
-
Designed a query to find the most active stations.
- Listed the stations and observation counts in descending order.
-
Designed a query to retrieve the last 12 months of temperature observation data (tobs).
-
Filtered by the station with the highest number of observations.
-
Plotted the results as a histogram with
bins=12.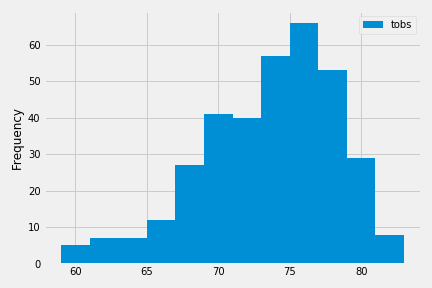
-

Designed a Flask API based on the queries.
- Used FLASK to create routes.
-
/-
Home page.
-
Listed all routes that are available.
-
-
/api/v1.0/precipitation-
Converted the query results to a Dictionary using
dateas the key andprcpas the value. -
Returned the JSON representation of the dictionary.
-
-
/api/v1.0/stations- Returned a JSON list of stations from the dataset.
-
/api/v1.0/tobs- queried for the dates and temperature observations from a year from the last data point.
- Returned a JSON list of Temperature Observations (tobs) for the previous year.
-
/api/v1.0/<start>and/api/v1.0/<start>/<end>-
Returned a JSON list of the minimum temperature, the average temperature, and the max temperature for a given start or start-end range.
-
When given the start only, calculated
TMIN,TAVG, andTMAXfor all dates greater than and equal to the start date. -
When given the start and the end date, calculated the
TMIN,TAVG, andTMAXfor dates between the start and end date inclusive.
-