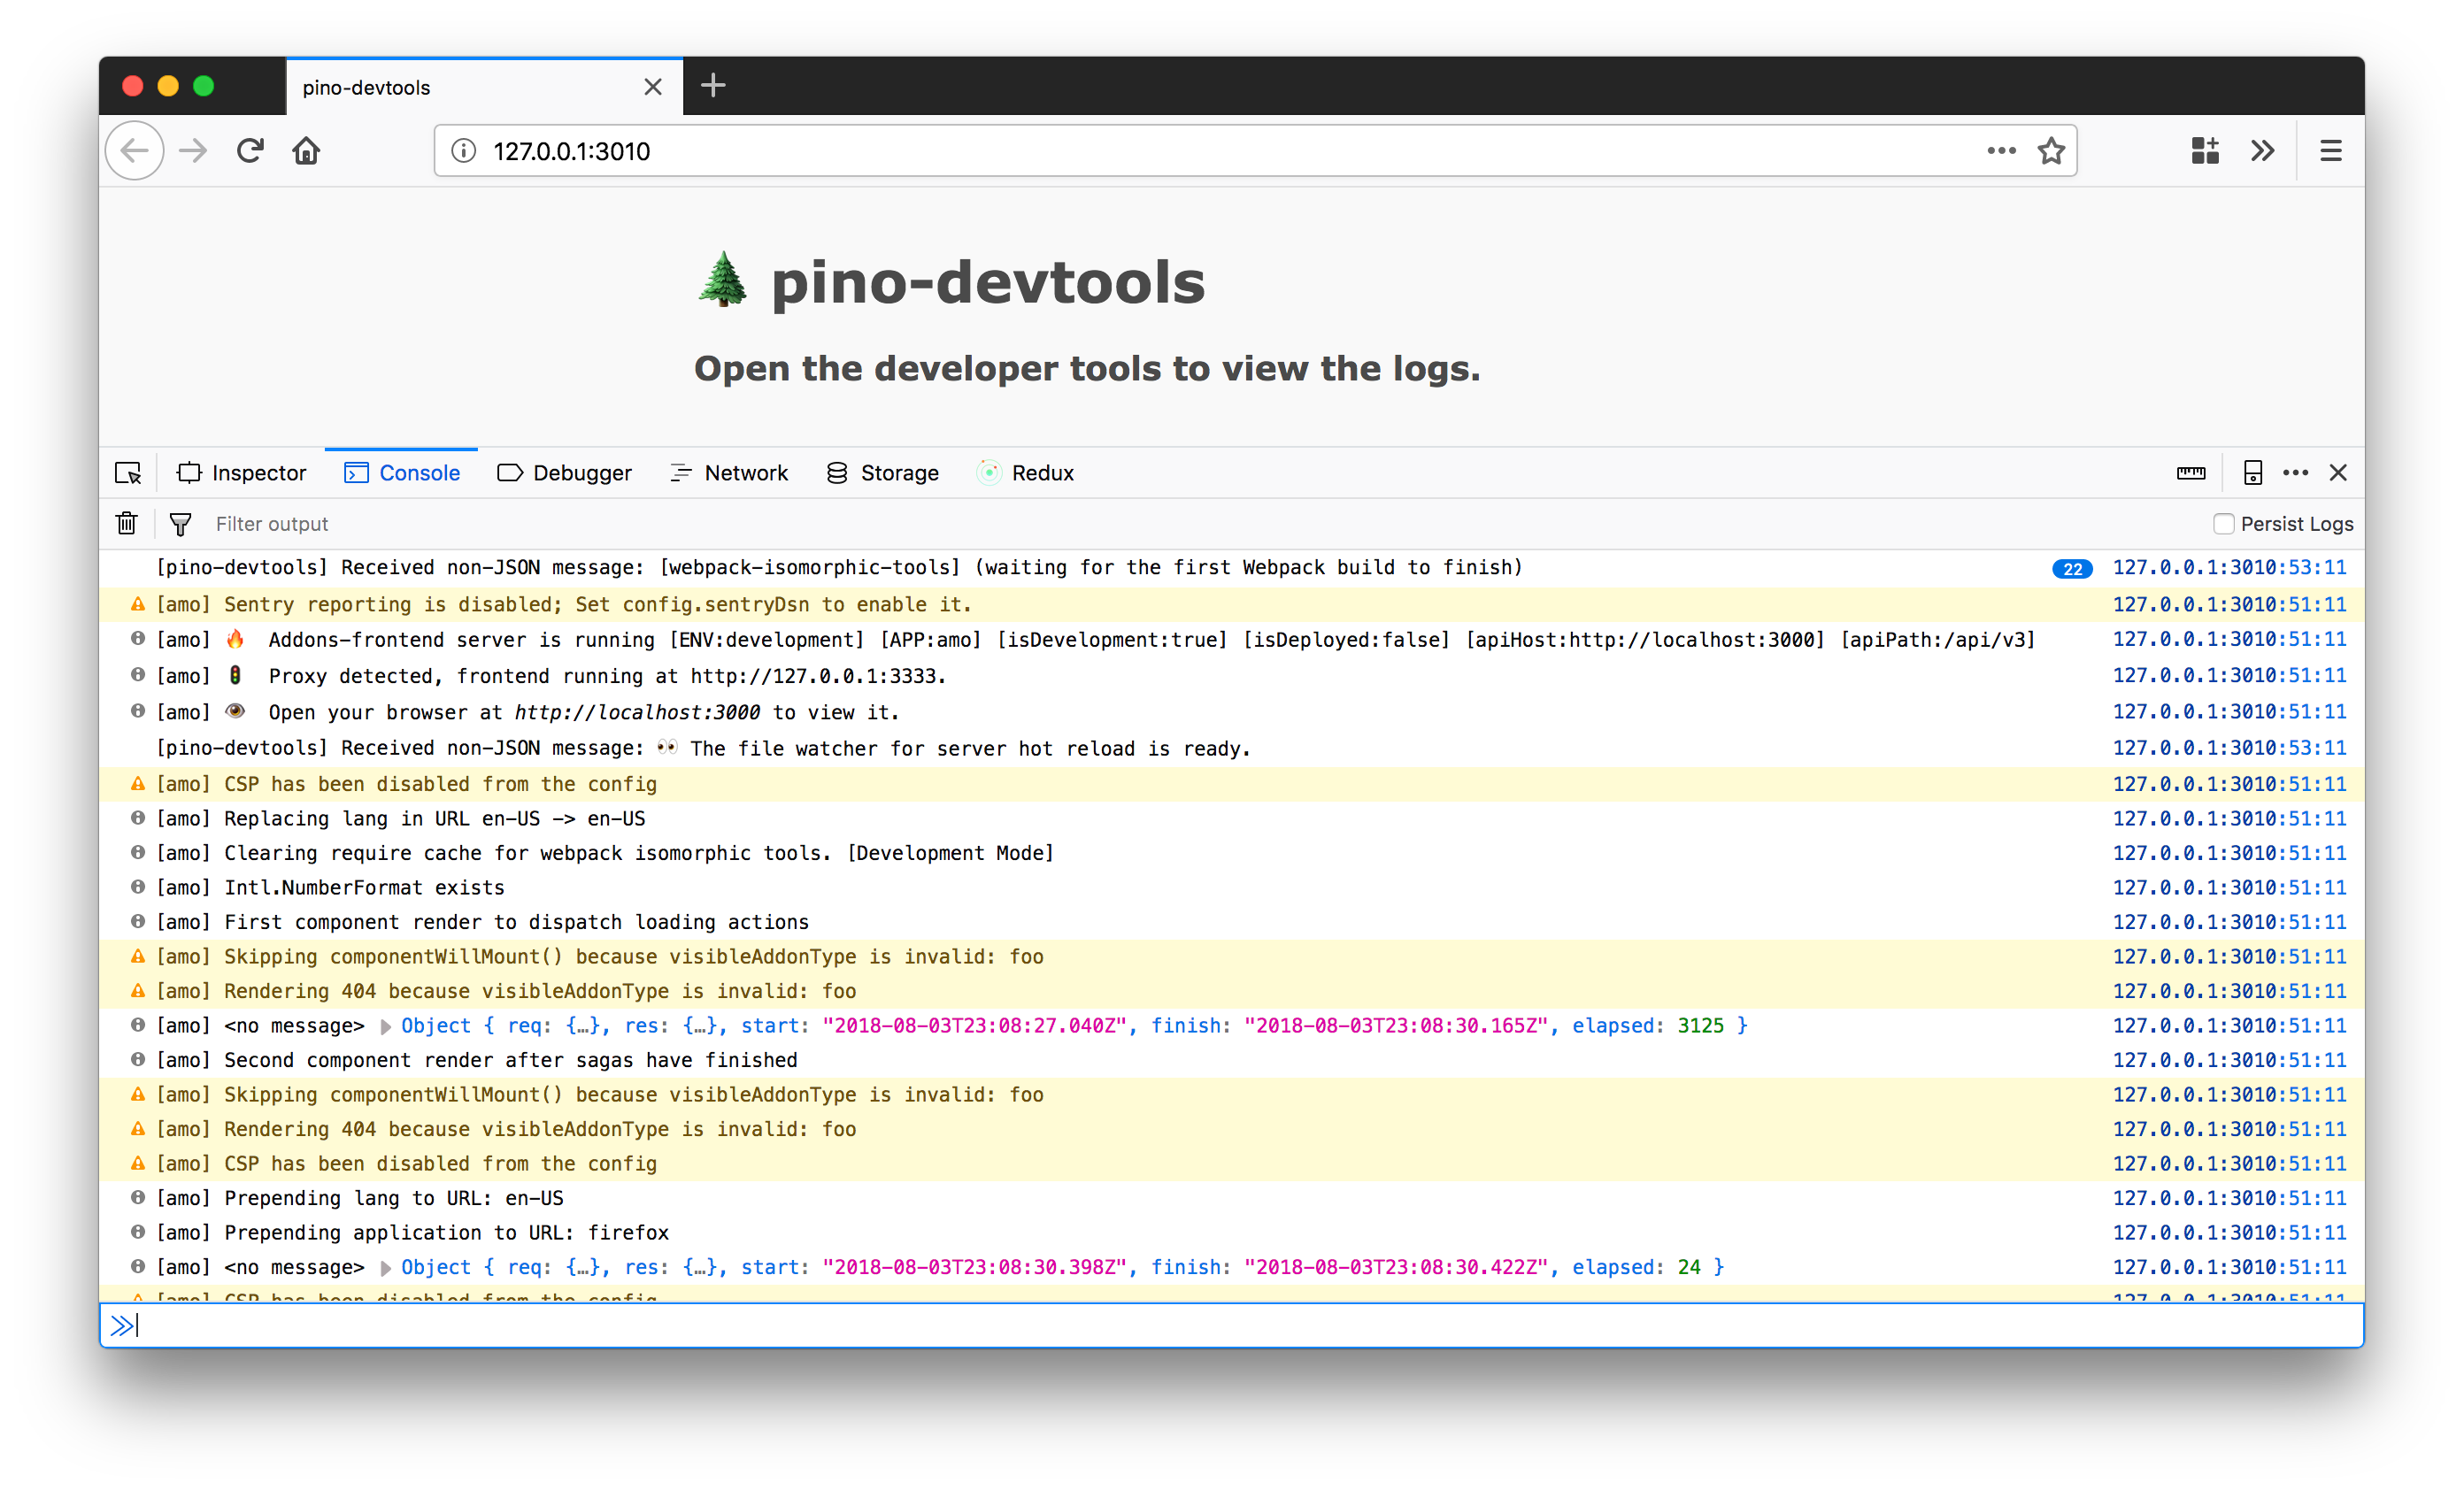
A transport for viewing logs in your favorite browser devtools!
$ npm i pino-devtools
Given an application your-app.js that logs via pino, you would use pino-devtools like so:
$ node your-app.js | pino-devtools
pino-devtools automatically opens a page in your default browser (unless --no-open is supplied). Open the devtools and you will see the logs coming from your application into the console tab.
--host 127.0.0.1: the host for the HTTP and web socket servers--port 3010: the HTTP server port--no-open: do not automatically open the page in the browser--mode websocket: the server mode, more information in the next section--tee: also send the logs tostdout
Note: the web socket port is port + 1.
The server can be started in one of these two modes:
websocket: the default mode, which opens a new tab in your browser and forwards the logs via a websocket. There is nothing to configure in your applicationbuffer: a mode that does not open a new tab or use a websocket but uses a buffer to store all the logs and a client in your application to output those logs in the same console as your application
Use pino-devtools like so:
$ node your-app.js | pino-devtools --mode buffer
Update your application code to require the pino-devtools client and calls the fetchBufferedLogs() async function as early as possible:
// index.js
const { fetchBufferedLogs } = require('pino-devtools/src/client');

await fetchBufferedLogs();pino-devtools is released under the Mozilla Public License Version 2.0. See the bundled LICENSE file for details.
