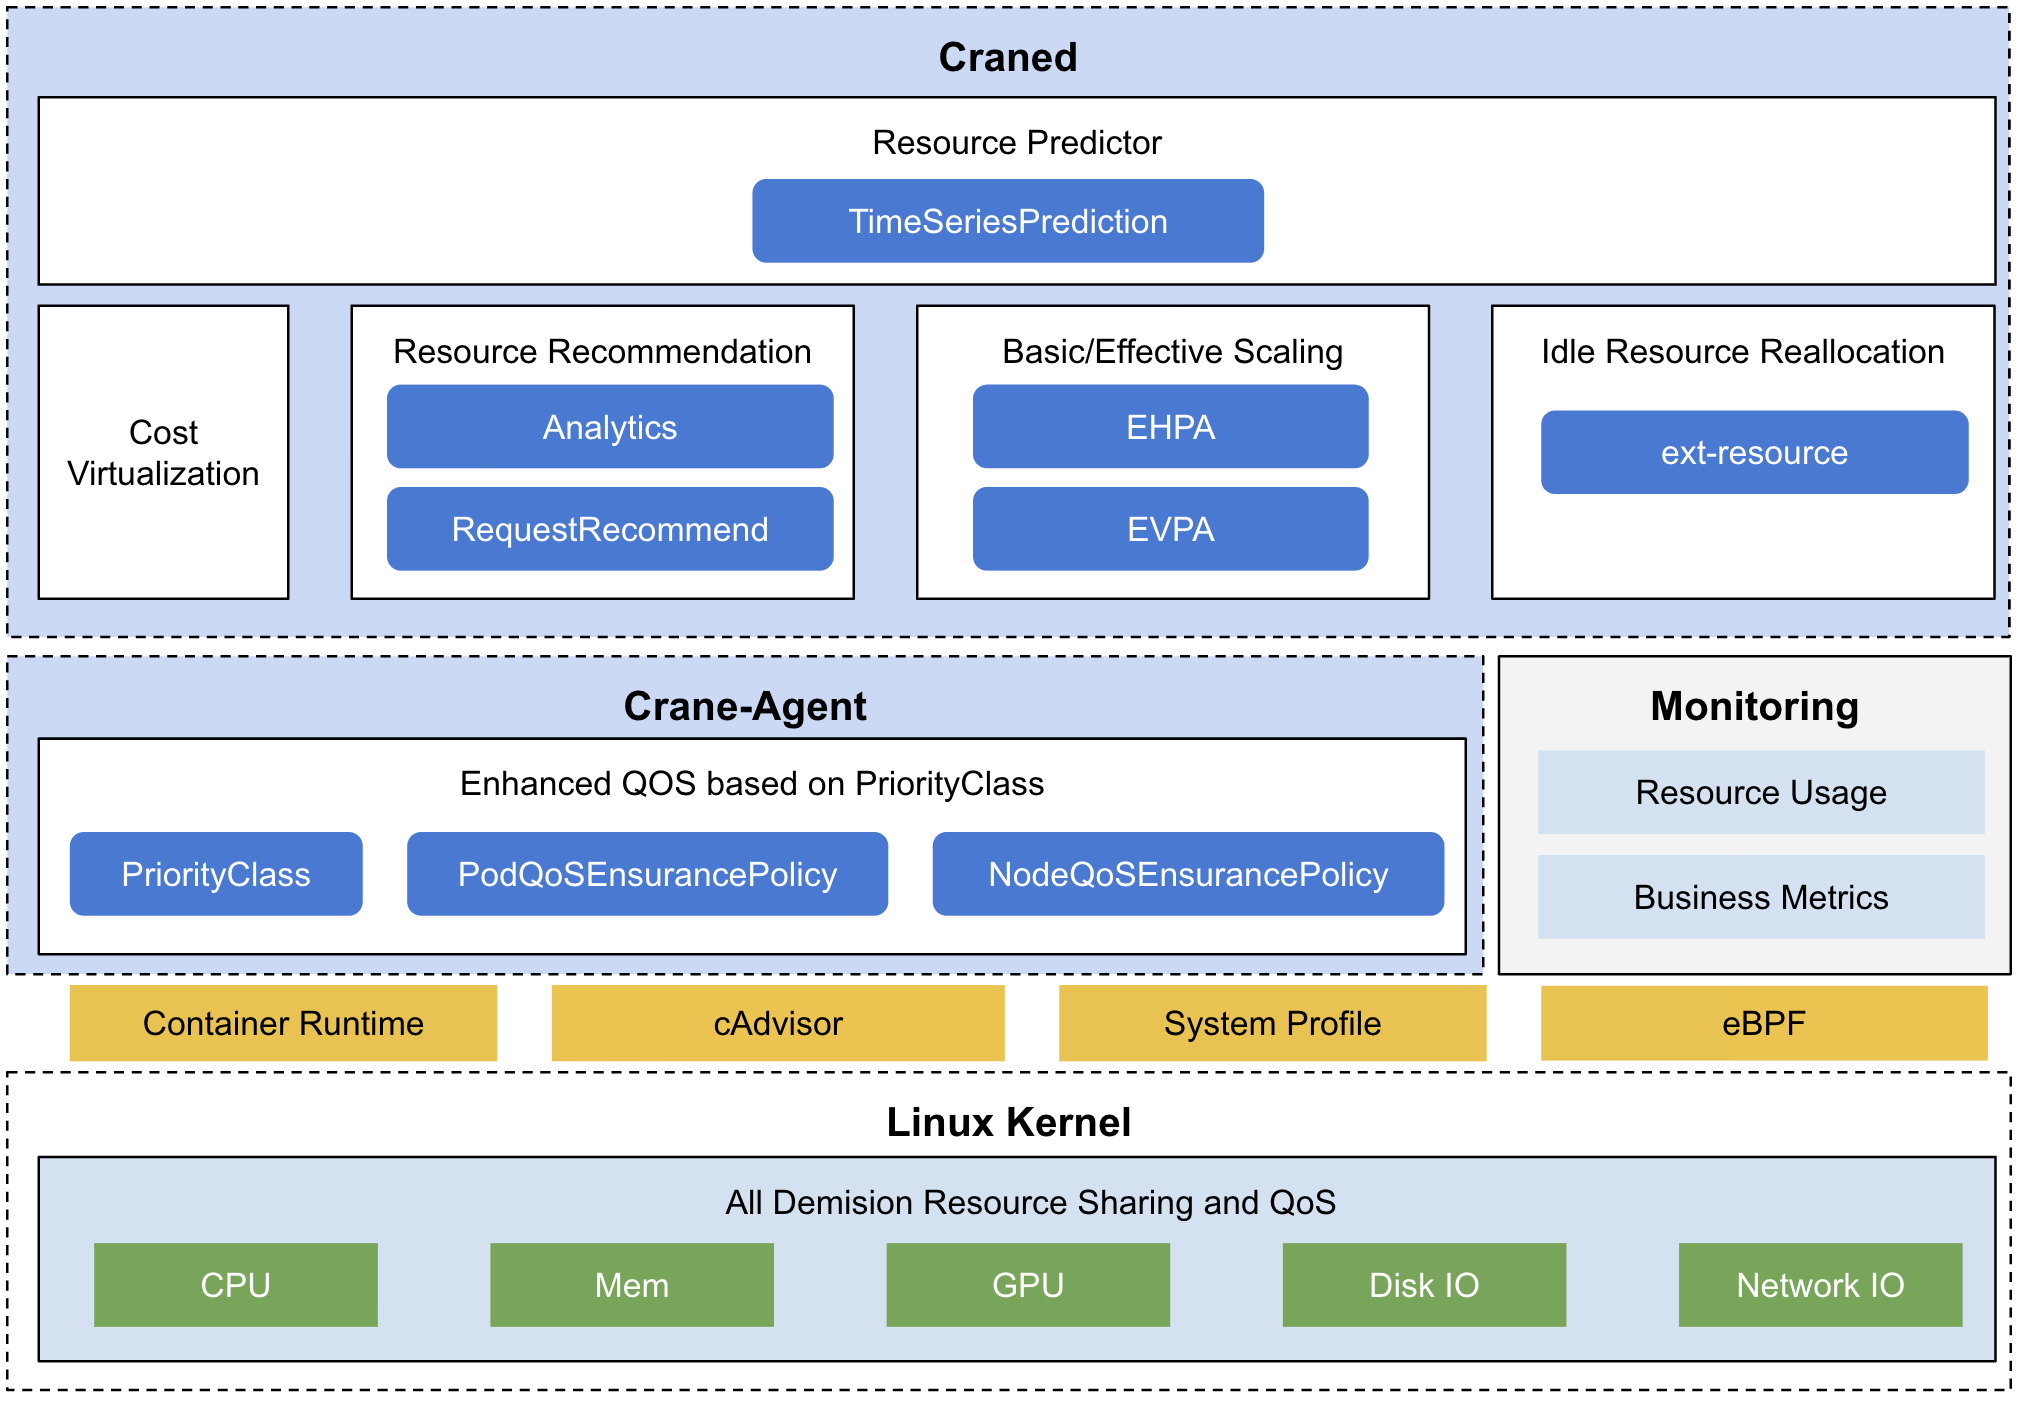
Crane (FinOps Crane) is a cloud native open source project which manages cloud resources on Kubernetes stack, it is inspired by FinOps concepts.
The goal of Crane is to provide a one-stop-shop project to help Kubernetes users to save cloud resource usage with a rich set of functionalities:
- Time Series Prediction based on monitoring data
- Usage and Cost visibility
- Usage & Cost Optimization including:
- R2 (Resource Re-allocation)
- R3 (Request & Replicas Recommendation)
- Effective Pod Autoscaling (Effective Horizontal & Vertical Pod Autoscaling)
- Cost Optimization
- Enhanced QoS based on Pod PriorityClass
TimeSeriesPrediction defines metric spec to predict kubernetes resources like Pod or Node. The prediction module is the core component that other crane components relied on, like EHPA and Analytics.
Please see this document to learn more.
EffectiveHorizontalPodAutoscaler helps you manage application scaling in an easy way. It is compatible with native HorizontalPodAutoscaler but extends more features like prediction-driven autoscaling.
Please see this document to learn more.
Analytics model analyzes the workload and provide recommendations about resource optimize.
Two Recommendations are currently supported:
- ResourceRecommend: Recommend container requests & limit resources based on historic metrics.
- Effective HPARecommend: Recommend which workloads are suitable for autoscaling and provide optimized configurations such as minReplicas, maxReplicas.
Kubernetes is capable of starting multiple pods on same node, and as a result, some of the user applications may be impacted when there are resources(e.g. cpu) consumption competition. To mitigate this, Crane allows users defining PrioirtyClass for the pods and QoSEnsurancePolicy, and then detects disruption and ensure the high priority pods not being impacted by resource competition.
Avoidance Actions:
- Disable Schedule: disable scheduling by setting node taint and condition
- Throttle: throttle the low priority pods by squeezing cgroup settings
- Evict: evict low priority pods
Please see this document to learn more.
Crane is composed of the following components:
- craned. - main crane control plane.
- Predictor - Predicts resources metrics trends based on historical data.
- AnalyticsController - Analyzes resources and generate related recommendations.
- RecommendationController - Recommend Pod resource requests and autoscaler.
- ClusterNodePredictionController - Create Predictor for nodes.
- EffectiveHPAController - Effective HPA for horizontal scaling.
- EffectiveHPAController - Effective VPA for vertical scaling.
- metric-adaptor. - Metric server for driving the scaling.
- crane-agent. - Ensure critical workloads SLO based on abnormally detection.
- gocrane/api. This repository defines component-level APIs for the Crane platform.
- gocrane/fadvisor Financial advisor which collect resource prices from cloud API.
Prerequisites
- Kubernetes 1.18+
- Helm 3.1.0
Helm Installation
Please refer to Helm's documentation for installation.
Installing prometheus and grafana with helm chart
Note: If you already deployed prometheus, grafana in your environment, then skip this step.
Crane use prometheus to be the default metric provider. Using following command to install prometheus components: prometheus-server, node-exporter, kube-state-metrics.
helm repo add prometheus-community https://prometheus-community.github.io/helm-charts
helm install prometheus -n crane-system --set pushgateway.enabled=false --set alertmanager.enabled=false --set server.persistentVolume.enabled=false -f https://raw.githubusercontent.com/gocrane/helm-charts/main/integration/prometheus/override_values.yaml --create-namespace  prometheus-community/prometheus
Fadvisor use grafana to present cost estimates. Using following command to install a grafana.
helm repo add grafana https://grafana.github.io/helm-charts
helm install grafana -f https://raw.githubusercontent.com/gocrane/helm-charts/main/integration/grafana/override_values.yaml -n crane-system --create-namespace grafana/grafana
Deploying Crane and Fadvisor
helm repo add crane https://gocrane.github.io/helm-charts
helm install crane -n crane-system --create-namespace crane/crane
helm install fadvisor -n crane-system --create-namespace crane/fadvisor
Verify Installation
Check deployments are all available by running:
kubectl get deploy -n crane-systemThe output is similar to:
NAME                                             READY   STATUS    RESTARTS   AGE
crane-agent-8h7df                                1/1     Running   0          119m
crane-agent-8qf5n                                1/1     Running   0          119m
crane-agent-h9h5d                                1/1     Running   0          119m
craned-5c69c684d8-dxmhw                          2/2     Running   0          20m
grafana-7fddd867b4-kdxv2                         1/1     Running   0          41m
metric-adapter-94b6f75b-k8h7z                    1/1     Running   0          119m
prometheus-kube-state-metrics-6dbc9cd6c9-dfmkw   1/1     Running   0          45m
prometheus-node-exporter-bfv74                   1/1     Running   0          45m
prometheus-node-exporter-s6zps                   1/1     Running   0          45m
prometheus-node-exporter-x5rnm                   1/1     Running   0          45m
prometheus-server-5966b646fd-g9vxl               2/2     Running   0          45m
you can see this to learn more.
Customize Installation
Deploy Crane by apply YAML declaration.
git checkout v0.2.0
kubectl apply -f deploy/manifests
kubectl apply -f deploy/craned
kubectl apply -f deploy/metric-adapter
The following command will configure prometheus http address for crane if you want to customize it. Specify CUSTOMIZE_PROMETHEUS if you have existing prometheus server.
export CUSTOMIZE_PROMETHEUS=
if [ $CUSTOMIZE_PROMETHEUS ]; then sed -i '' "s/http:\/\/prometheus-server.crane-system.svc.cluster.local:8080/${CUSTOMIZE_PROMETHEUS}/" deploy/craned/deployment.yaml ; fi
Get the Grafana URL to visit by running these commands in the same shell:
export POD_NAME=$(kubectl get pods --namespace crane-system -l "app.kubernetes.io/name=grafana,app.kubernetes.io/instance=grafana" -o jsonpath="{.items[0].metadata.name}")
kubectl --namespace crane-system port-forward $POD_NAME 3000
visit Cost Report here with account(admin:admin).
Crane supports analytics and give recommend advise for your k8s cluster.
Please follow this guide to learn more.
Please see this document to learn more.
Contributors are welcomed to join Crane project. Please check CONTRIBUTING about how to contribute to this project.
Crane adopts CNCF Code of Conduct.


