- window 10 版本19041
- Microsoft Visual Studio Community 2019 版本 16.6.4
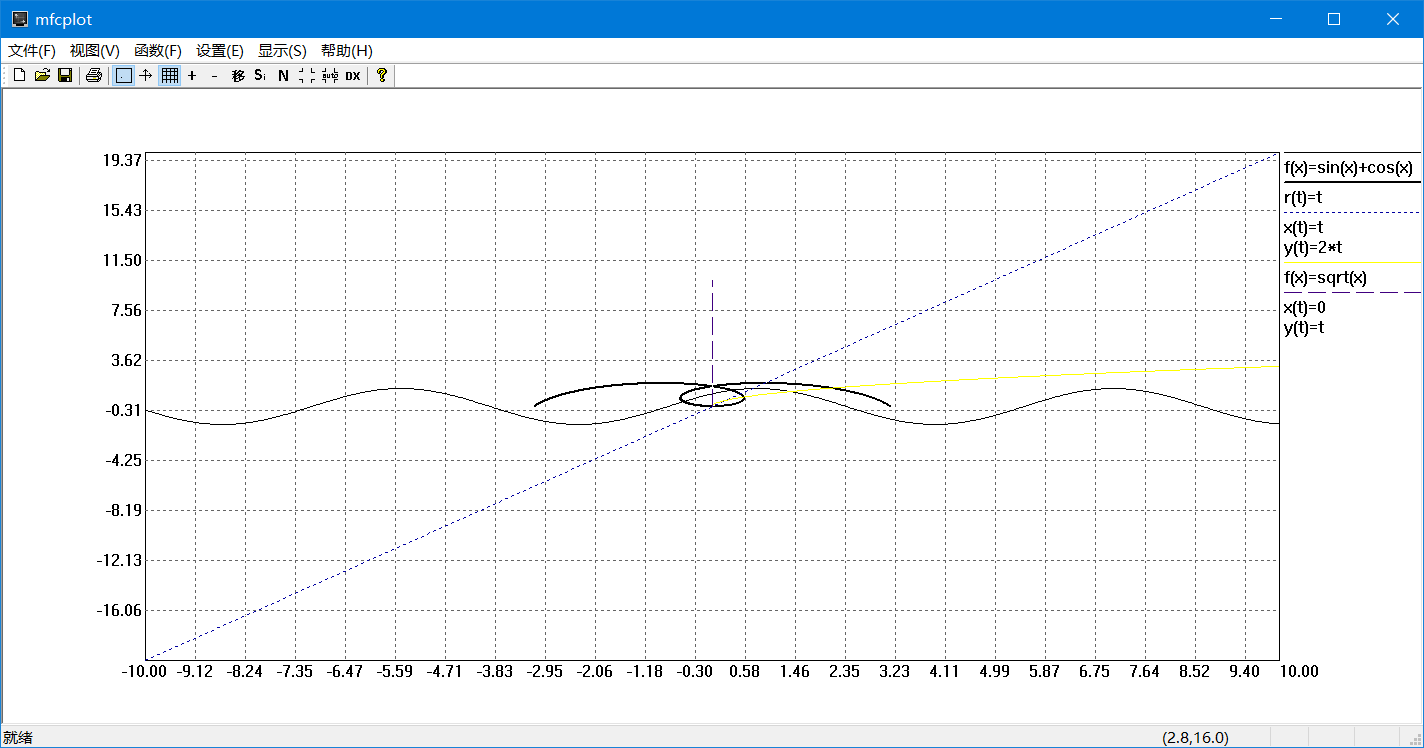
- 绘制常见一元函数的图像
- 支持普通函数,极坐标函数,参数方程,直接输入数据点
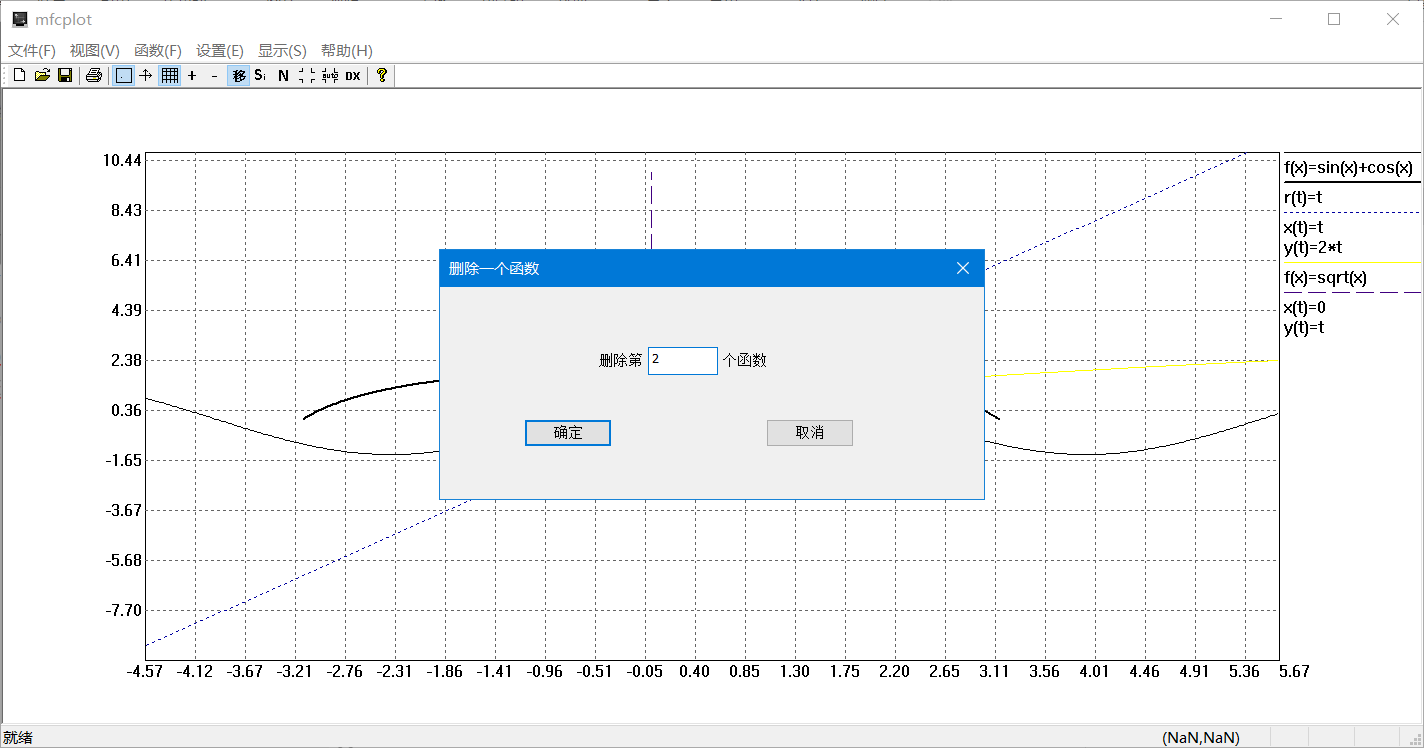
- 可以删除指定函数图像
- 可以在一个坐标系中绘制多条数学曲线
- 显示坐标轴,网格,刻度值,图例
- 可以选择不同颜色线型来绘制不同的曲线
- 当鼠标移动到曲线上某点时,可以显示该点的坐标
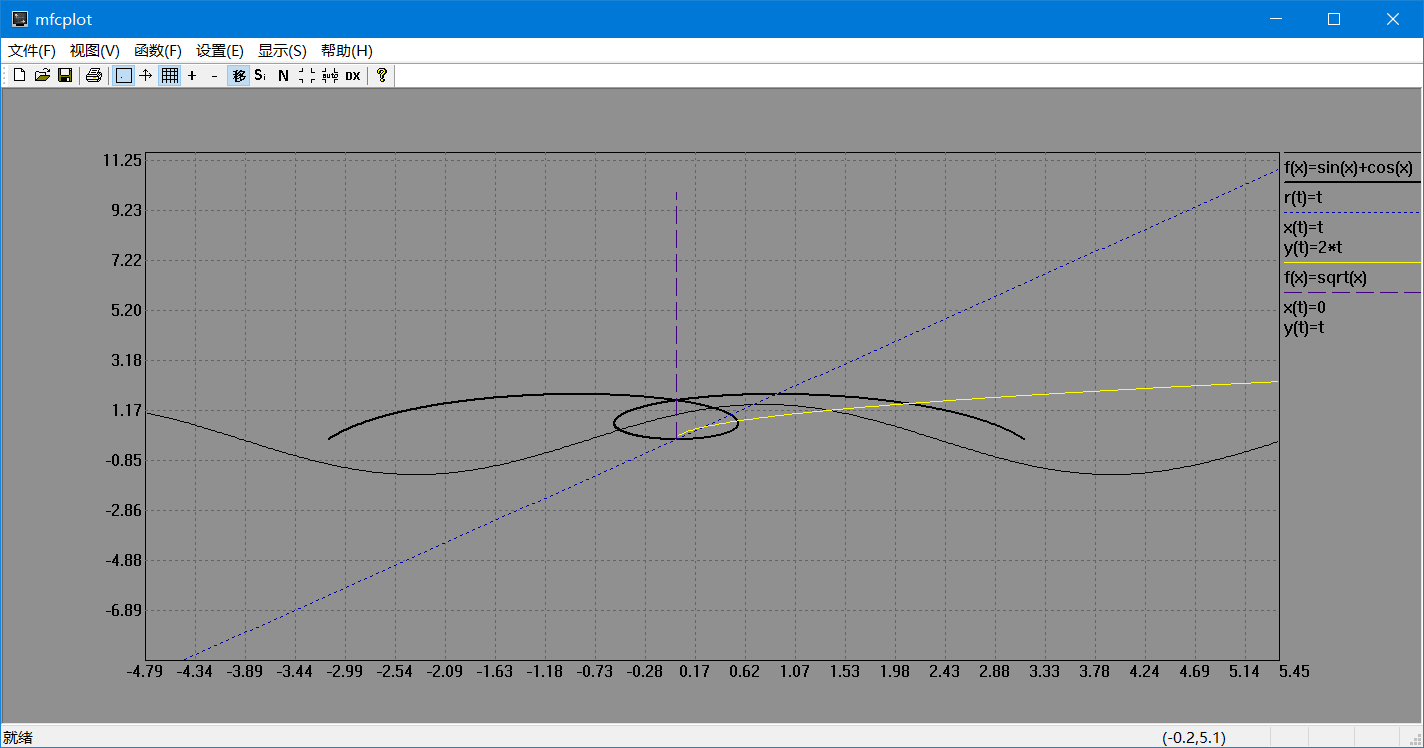
- 可以用鼠标拖动图像
- 可以进行图形的放大,缩小,定量设置显示范围,自动缩放
- 普通函数x取值范围可设置为跟随显示范围变化
- 状态栏实时显示鼠标位置,双击显示鼠标精确位置
- 重要数据的序列化和反序列化
- 突变函数(如floor(x))和部分y值接近无穷的函数(如tan(x))无法完美显示
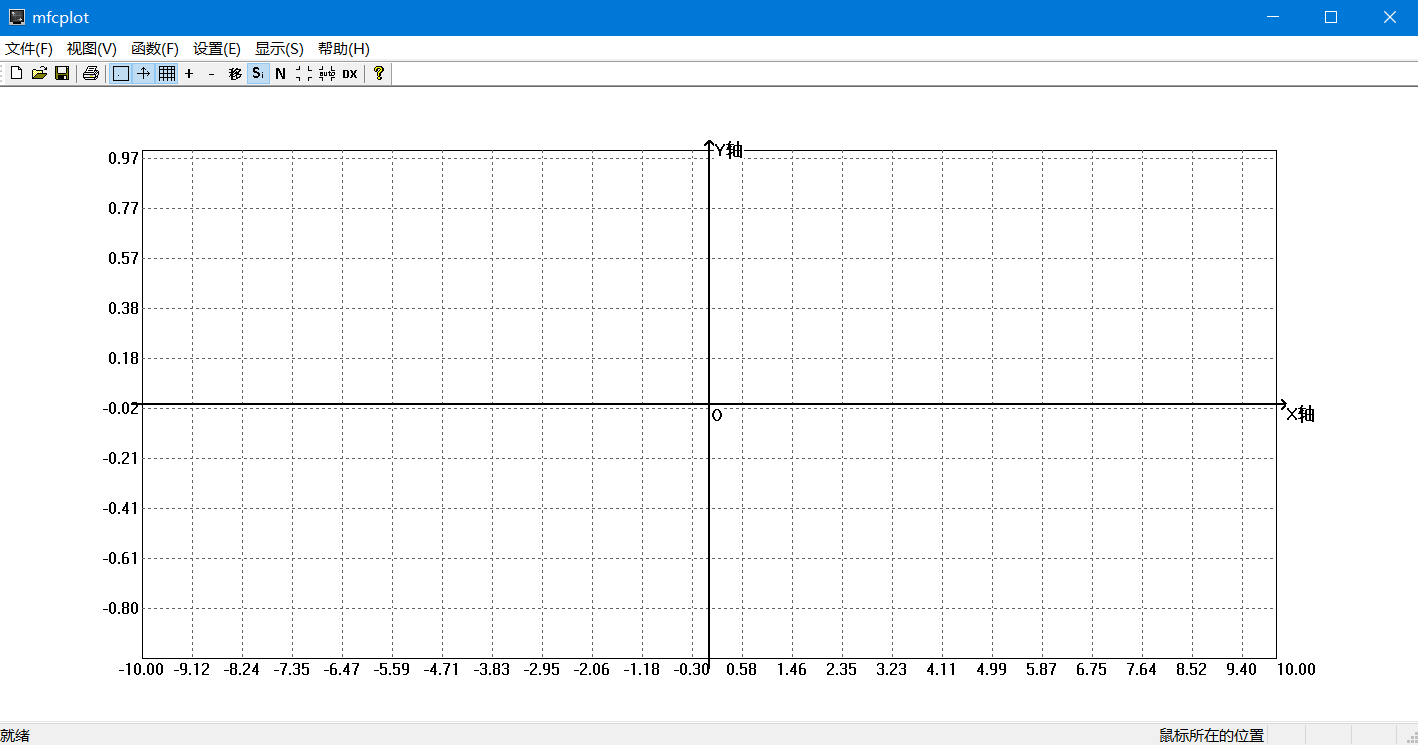
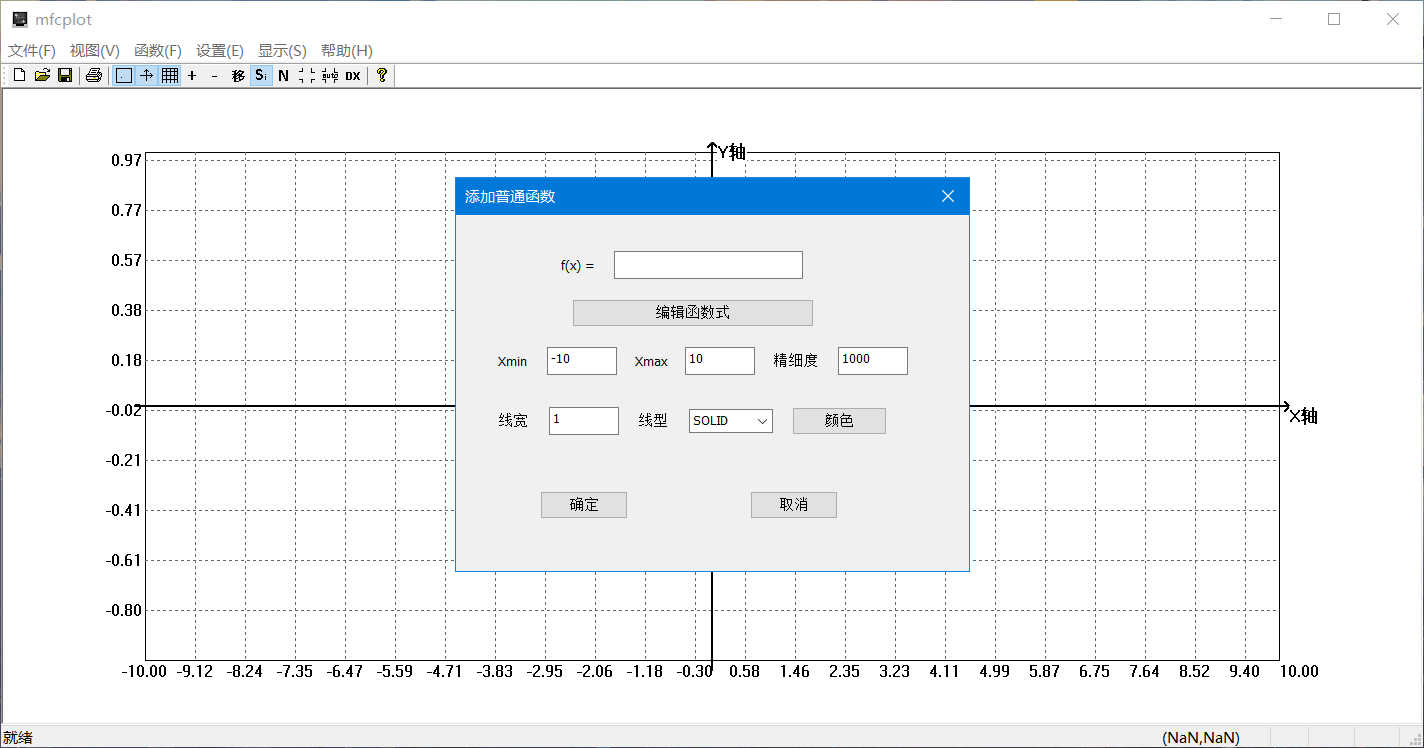
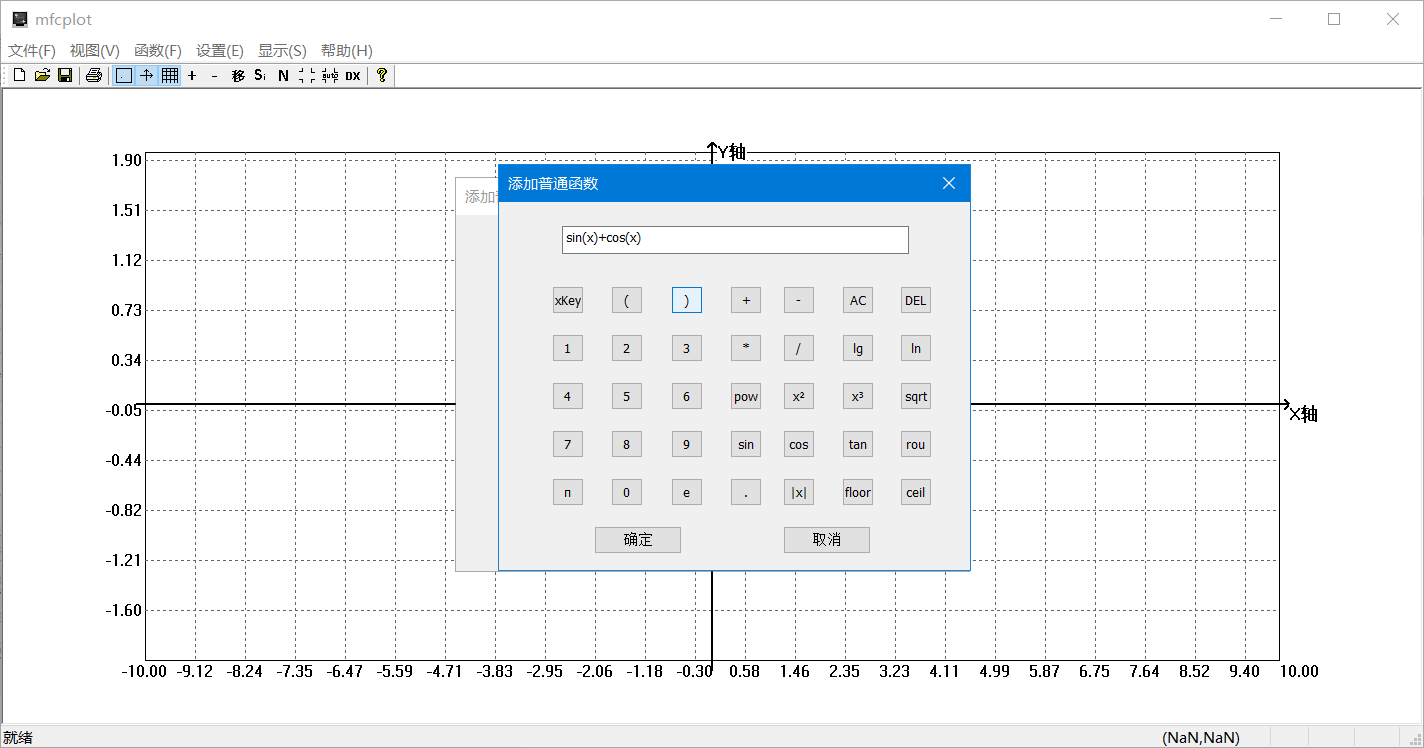
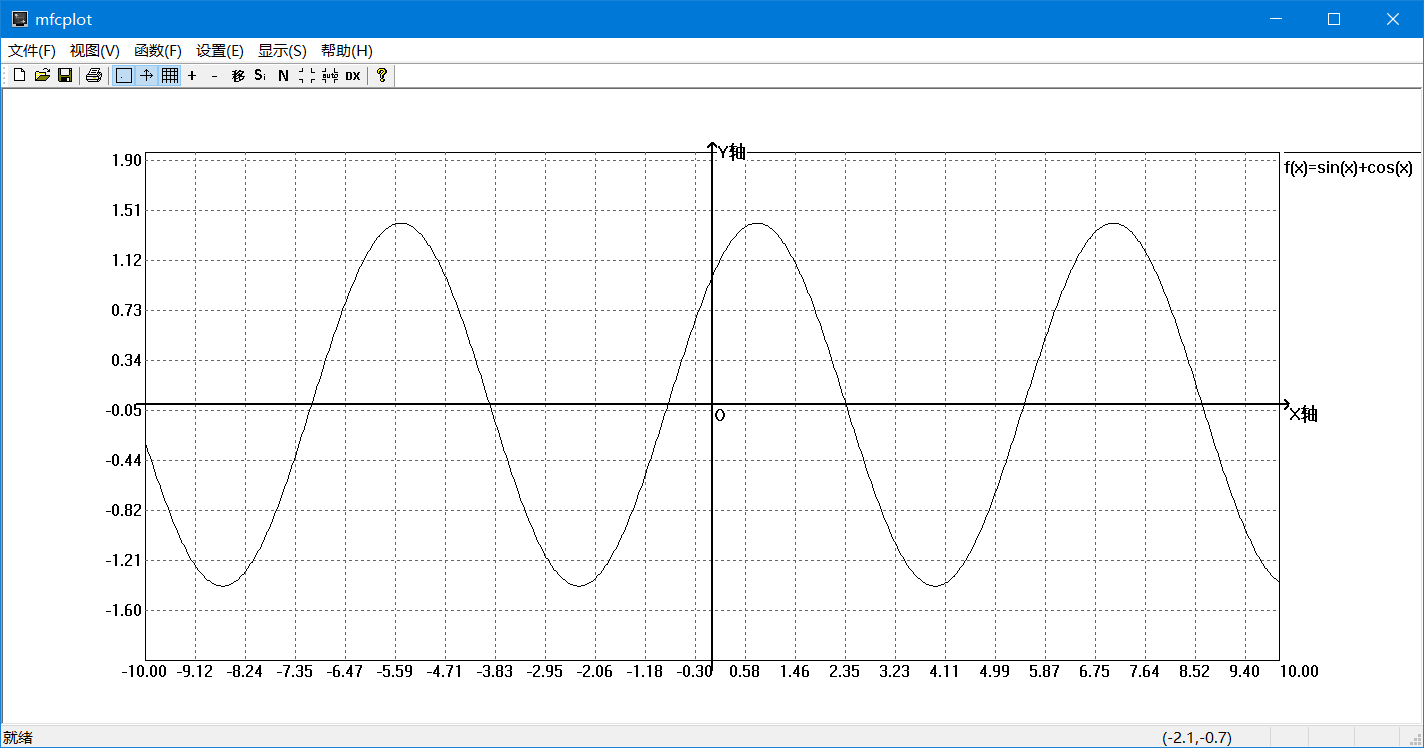
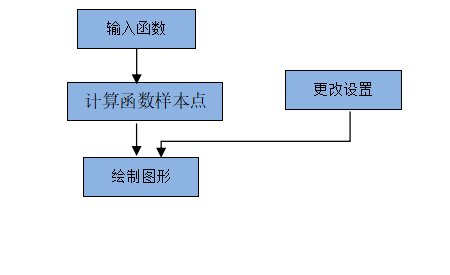
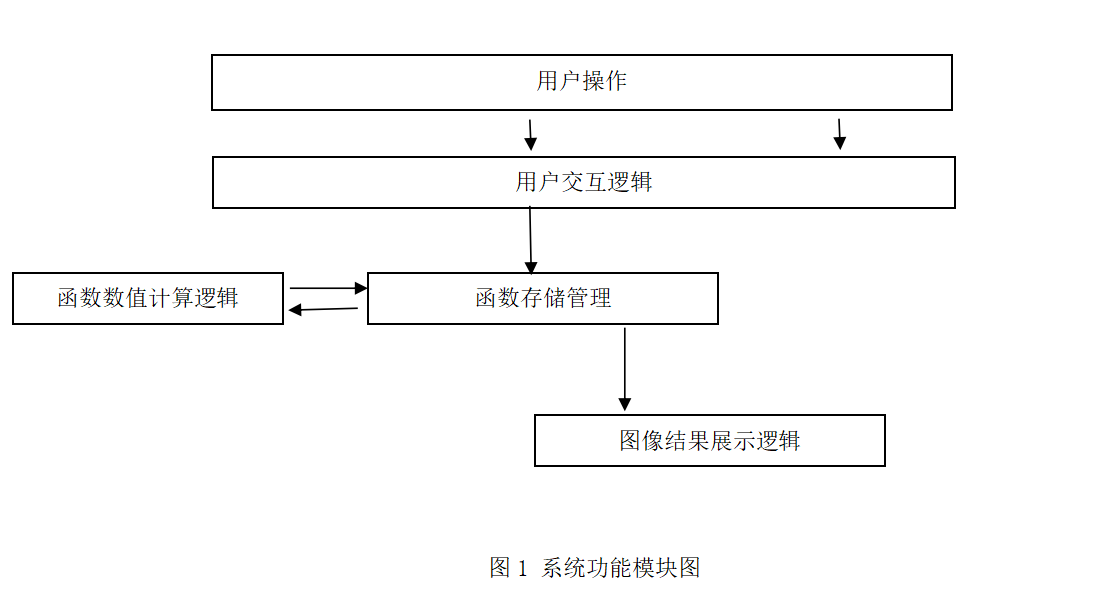
用户输入函数信息,显示函数图像。还可以通过菜单和工具栏更改设置。
通过计算样本点,相邻样本点用直线连接,当样本点数量足够大时,可近似看成曲线。
double CalcEquation(CString m_sEquation, bool& succ, char xKey, double xVal) m_sEquation:表达式 succ:计算是否成功 xKey:未知数是"x"还是"t" xVal:未知数的值
此文件可以单独拿出来(把CString换成string就行)使用 bool succ = true; double ans = CalcEquation("sin(x)+e^x",succ,'x',1.1);
对方程,分为数(常数,未知数x),双目运算符(+ , - ,* , / , ^ ) ,单目运算符(sin,cos等等),单目运算符后面是一个完整的子式,如2+cos(x+1)中,x+1就是一个完整的式子,通过递归调用可以求子式的值,如果已知子式值,这个[单目运算符+子式]就是一个已知数了,那剩下的就等效于只有+ , - , * , / , ^ 的公式,用表达式栈法就可以解决。
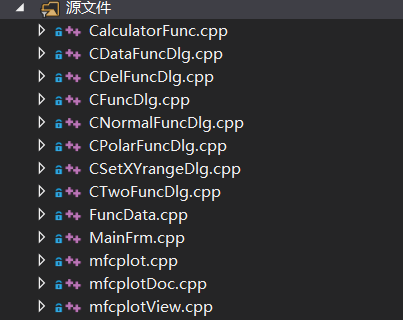
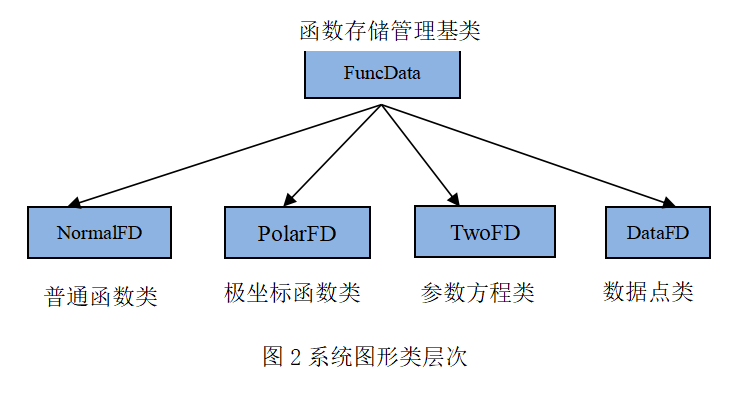
FuncData类
成员变量:
	int FuncCas;            //函数类型
	CString m_Equation;		//函数表达式
	double minX, maxX;		//x极值
	double maxY, minY;		//y极值
	int stepX;				//可以理解为样本点的数量
	int m_penWidth;			//画笔宽度
	int m_penType;			//画笔类型
	COLORREF m_color;		//画笔颜色
	vector<pair<double, double> > vetPoint;			 //储存所有样本点
成员函数:
	virtual double GetY(double xVal, bool& succ) = 0;//得到未知数为xVal时函数值,succ表示计算是否成功
	virtual bool CalcList() = 0;					 //计算vetPoint
	virtual bool GetNearest(pair<double,double> NowPoint, pair<double, double> &CmpPoint);//获取本函数与NowPoint最近的点
	virtual CString GetEquation2();					 //为了得到参数方程第二个函数式
	FuncData();
	FuncData(CString Equation,double minX,double maxX,int stepX,COLORREF color, int penWidth,int penType);//构造函数

注意:此处派生类只记录特有的成员
NormalFD类
无

PolarFD 类
成员变量
double maxth, minth;   //自变量θ取值范围

TwoFD类
成员变量
CString m_EquationY;
double maxT, minT;
成员函数
double GetX(double tVal, bool& succ);//参数方程X也需要求值
	virtual double GetY(double tVal, bool& succ);

DataFD类
成员函数
static int DataFD_Cnt; //记录数据点类型函数数量mfcplotDoc中记录着设置信息和函数数据,主要内容如下
public:
	bool m_WillShowGrid; //是否显示网格
	bool m_WillShowAxis; //是否显示坐标轴
	bool m_WillShowEdge; //是否显示边框
	bool m_SingelMode;   //单函数模式添加函数自动删除上一个函数
	bool m_ForceXrange;	 //普通函数x范围是否固定,不固定的话随显示范围变化
	bool m_ShowNearPoint;//鼠标接近函数线时是否显示其坐标
	double m_Xmin, m_Xmax, m_Ymin, m_Ymax;//显示范围
	FuncData *m_FD;//临时变量
	CObList m_List;//记录所有函数信息
public:
	afx_msg void OnAxisMenu();//坐标轴
	afx_msg void OnGridMenu();//网格
	afx_msg void OnEdgeMenu();//边框
	afx_msg void OnSmallerMenu();//显示范围缩小 0.8
	afx_msg void OnBiggerMenu();//显示范围放大 1.25
	afx_msg void OnNormalFuncMenu();//增加普通函数
	afx_msg void OnMenuSetXyrange();//设置显示范围
	afx_msg void OnFuncMode();//单/多函数模式
	afx_msg void OnPolarFuncMenu();//增加极坐标函数
	afx_msg void OnTwoFuncMenu();//增加参数方程函数
	afx_msg void OnDataFuncMenu();//增加数据点型函数
	afx_msg void OnFroceXrang();//普通函数x范围是否固定
	afx_msg void OnNearpointMenu();//是否显示最近点
	afx_msg void OnAutorangeMenu();//自动调整显示范围,正好显示完整函数图像
	afx_msg void OnDelfunconeMenu();//删除一个函数
afx_msg void OnDelallMenu();//删除所有函数绘图逻辑是在这里实现的,主要内容如下
public:
	double m_Xmin, m_Xmax, m_Ymin, m_Ymax;//函数显示范围
	int nTop, nButton, nLeft, nRight;//对应的逻辑坐标范围
	int isMoving;//拖动状态 0不拖动 1拖动模式 2正在拖动
	double tmp_Xmin, tmp_Xmax, tmp_Ymin, tmp_Ymax;
	//拖动模式下,单击鼠标左键,记录起点的显示范围
	CPoint m_posStart;
	//拖动模式下,单击鼠标左键,记录起点的鼠标坐标
	//根据鼠标坐标偏移量可以计算显示范围变化量
函数中LPxtoFPx表示把函数坐标x变成pDC可以用的逻辑坐标_x,原理函数坐标范围m_Xmin,m_Xmax到逻辑坐标范围nLeft,nRight(下面函数会给出)等比例的映射。
double CmfcplotView::LPxtoFPx(int x) {
	return m_Xmin + (1.0 * x - nLeft) * (m_Xmax - m_Xmin) / (1.0 * nRight - nLeft);
}
实现坐标转换后就可以进行绘图工作了。
void CmfcplotView::OnDraw(CDC* pDC)
{
	CmfcplotDoc* pDoc = GetDocument();
	ASSERT_VALID(pDoc);
	if (!pDoc)
		return;
	m_Xmin = pDoc->m_Xmin;//极值保存在Doc中
	m_Xmax = pDoc->m_Xmax;
	m_Ymin = pDoc->m_Ymin;
	m_Ymax = pDoc->m_Ymax;

	CRect rect;
	GetClientRect(&rect);//获得视图区

	nTop = (int)round(rect.bottom * 0.1);  //函数图像不会占据整个视图区
	nButton = (int)round(rect.bottom * 0.9);
	nLeft = (int)round(rect.right * 0.1);
	nRight = (int)round(rect.right * 0.9);

	if (pDoc->m_WillShowEdge) {//画边框
		pDC->MoveTo(nLeft, nTop);
		pDC->LineTo(nLeft, nButton);
		pDC->LineTo(nRight, nButton);
		pDC->LineTo(nRight, nTop);
		pDC->LineTo(nLeft, nTop);
	}

	//画x坐标信息
	int nX,nY;
	bool BIGX = abs(m_Xmin) > 100 || abs(m_Xmax) > 100;//x坐标值比较大时,标注更稀
	for (nX = nLeft; nX < nRight; nX += (BIGX ? 100 : 50)) { //每隔100/50像素一个标注
		CRect textRect(nX - (BIGX ? 50 : 25), nButton + 1, nX + (BIGX ? 50 : 25), nButton + 20);//显示区域
		CString xInfo;
		xInfo.Format(_T("%.2f"),LPxtoFPx(nX));
		pDC->DrawText(xInfo, &textRect, DT_SINGLELINE | DT_CENTER);
		                                    //单行,上下左右居中显示
	}
	if (nX - nRight <= (BIGX ? 50 : 25)) {//最后一个x坐标,与前一个标注距离太近则不显示
		CRect textRect(nRight, nButton + 1, nRight + 50, nButton + 20);
		CString xInfo;
		xInfo.Format(_T("%.2f"),m_Xmax);
		pDC->DrawText(xInfo, &textRect, DT_SINGLELINE | DT_LEFT | DT_TOP);
	}

	//y坐标
	for (nY = nButton - 50; nY > nTop; nY -= 50) {
		CRect textRect(nLeft - 200, nY-10, nLeft - 3, nY + 10);
		CString yInfo;
		yInfo.Format(_T("%.2f"), LPytoFPy(nY));
		pDC->DrawText(yInfo, &textRect, DT_SINGLELINE | DT_RIGHT);
	}
	if (nTop - nY <= 25) {
		CRect textRect(nLeft - 200, nTop - 10, nLeft - 3, nTop + 10);
		CString yInfo;
		yInfo.Format(_T("%.2f"),m_Ymax);
		pDC->DrawText(yInfo, &textRect, DT_SINGLELINE | DT_BOTTOM | DT_RIGHT);
	}


	//  显示网格
	if (pDoc->m_WillShowGrid) {
		CPen pen(PS_DOT, 1, RGB(100, 100, 100));           //创建笔,虚线,并调整坐标颜色灰色
		CPen *pOldPen = (CPen *)pDC->SelectObject(&pen);
		for (nX = nLeft+50; nX < nRight; nX += 50) {
			pDC->MoveTo(nX, nTop);
			pDC->LineTo(nX, nButton);
		}
		for (nY = nButton - 50; nY > nTop; nY -= 50) {
			pDC->MoveTo(nLeft, nY);
			pDC->LineTo(nRight, nY);
		}
		pDC->SelectObject(pOldPen);
	}

	// 显示坐标轴
	if (pDoc->m_WillShowAxis) {
		CPen pen(PS_SOLID, 2, RGB(0, 0, 0));
		CPen* pOldPen = (CPen*)pDC->SelectObject(&pen);
		int oX = FPxtoLPx(0);
		int oY = FPytoLPy(0);
		bool showY = oX >= nLeft && oX <= nRight;
		bool showX = oY >= nTop && oY <= nButton;//判断x,y轴是否在范围内
		if (showX) {
			pDC->MoveTo(nLeft - 10, oY);
			pDC->LineTo(nRight + 10, oY);
		}
		if (showY) {
			pDC->MoveTo(oX, nButton + 10);
			pDC->LineTo(oX, nTop - 10);
		}
		if (showX && showY) {
			pDC->TextOutW(oX + 1, oY + 1, _T("O"));
		}
		if (showX) {
			pDC->MoveTo(nRight + 10, oY);
			pDC->LineTo(nRight + 5, oY + 5);
			pDC->MoveTo(nRight + 10, oY);
			pDC->LineTo(nRight + 5, oY - 5);
			pDC->TextOutW(nRight + 10, oY, _T("X轴"));
		}
		if (showY) {
			pDC->MoveTo(oX, nTop - 10);
			pDC->LineTo(oX - 5, nTop - 5);
			pDC->MoveTo(oX, nTop - 10);
			pDC->LineTo(oX + 5, nTop - 5);
			pDC->TextOutW(oX + 5, nTop - 10, _T("Y轴"));
		}
		pDC->SelectObject(pOldPen);
	}


	POSITION p = pDoc->m_List.GetHeadPosition();

	int showTop = nTop;
	while (p != nullptr) {
		bool shouldMov = true;//一段曲线第一个点MoveTo,其他都是LineTo
		FuncData* tmpFD = (FuncData*)pDoc->m_List.GetNext(p);
		CPen pen(tmpFD->m_penType, tmpFD->m_penWidth, tmpFD->m_color);
		CPen* pOldPen = (CPen*)pDC->SelectObject(&pen);

		if (tmpFD->FuncCas == CAS_NORMAL) {//动态X坐标模式下,普通函数x范围与视图不同时自动同步
			if (pDoc->m_ForceXrange && isMoving!=2)
				if (tmpFD->minX != m_Xmin || tmpFD->maxX != m_Xmax) {
					tmpFD->minX = m_Xmin;
					tmpFD->maxX = m_Xmax;
					tmpFD->CalcList();
				}
		}

		for (auto dot : tmpFD->vetPoint) {
			if (dot.first < m_Xmin || dot.first > m_Xmax || dot.second < m_Ymin || dot.second > m_Ymax || dot.second != dot.second) {
				shouldMov = true;
				continue;
			}
			if (shouldMov) {
				pDC->MoveTo(FPxtoLPx(dot.first), FPytoLPy(dot.second));
				shouldMov = false;
			}
			else
				pDC->LineTo(FPxtoLPx(dot.first), FPytoLPy(dot.second));
		}

		pDC->MoveTo(nRight+5, showTop);//显示图例
		pDC->LineTo(rect.right, showTop);
		showTop += 5;
		if (tmpFD->FuncCas == CAS_NORMAL)
		    pDC->TextOutW(nRight + 5, showTop, _T("f(x)=")+tmpFD->m_Equation);
		else if (tmpFD->FuncCas == CAS_POLAR)
			pDC->TextOutW(nRight + 5, showTop, _T("r(t)=") + tmpFD->m_Equation);
		else if (tmpFD->FuncCas == CAS_TWO) {
			pDC->TextOutW(nRight + 5, showTop, _T("x(t)=") + tmpFD->m_Equation);
			showTop += 20;
			pDC->TextOutW(nRight + 5, showTop, _T("y(t)=") + tmpFD->GetEquation2());
		} else if (tmpFD->FuncCas == CAS_DATA)
			pDC->TextOutW(nRight + 5, showTop, _T("y(t)=") + tmpFD->m_Equation);
		showTop += 25;
		pDC->SelectObject(pOldPen);
	}
}
值得一提的是OnMouseMove的代码,拖动模式下,起点信息已经在OnLButtonDown更新,拖动过程使用了双缓冲绘图防止闪烁。具体原理可参看文末参考资料。
void CmfcplotView::OnMouseMove(UINT nFlags, CPoint point)
{
	// TODO: 在此添加消息处理程序代码和/或调用默认值
	更新状态栏,此处省略
	if (isMoving==2) {
		::SetCursor(LoadCursor(NULL, IDC_SIZEALL));
		CmfcplotDoc* pDoc = GetDocument();
		double detx = LPxtoFPx(point.x) - LPxtoFPx(m_posStart.x);
		pDoc->m_Xmin = tmp_Xmin - detx;
		pDoc->m_Xmax = tmp_Xmax - detx;
		double dety = LPytoFPy(point.y) - LPytoFPy(m_posStart.y);
		pDoc->m_Ymin = tmp_Ymin - dety;
		pDoc->m_Ymax = tmp_Ymax - dety;
		CDC* pDC = GetDC();
		//创建一个内存中的显示设备
		CDC MemDC;
		MemDC.CreateCompatibleDC(NULL);
		//创建一个内存中的图像
		CBitmap MemBitmap;
		CRect rect;
		GetClientRect(&rect);
		MemBitmap.CreateCompatibleBitmap(pDC, rect.right, rect.bottom);
		//指定内存显示设备在内存中的图像上画图
		MemDC.SelectObject(&MemBitmap);
		//先用一种颜色作为内存显示设备的背景色
		MemDC.FillSolidRect(rect.left, rect.top, rect.right, rect.bottom, RGB(144, 144, 144));
		this->OnDraw(&MemDC);
		//将内存中画好的图像直接拷贝到屏幕指定区域上
		pDC->BitBlt(rect.left, rect.top, rect.right, rect.bottom, &MemDC, 0, 0, SRCCOPY);
		//释放相关资源
		ReleaseDC(pDC);
	}
	else if (isMoving == 1) {
		::SetCursor(LoadCursor(NULL, IDC_HAND));
	}
	显示函数最近点部分,此处省略
	CView::OnMouseMove(nFlags, point);
}
- DrawText函数的讲解
- VC双缓冲绘图技术介绍
- 阎光伟,彭文,徐琳茜. 基于案例的Visual C++程序设计教程[M].北京:清华大学出版社,2012
- 张晓民. VC++2010应用开发技术[M].北京:机械工业出版社,2013
