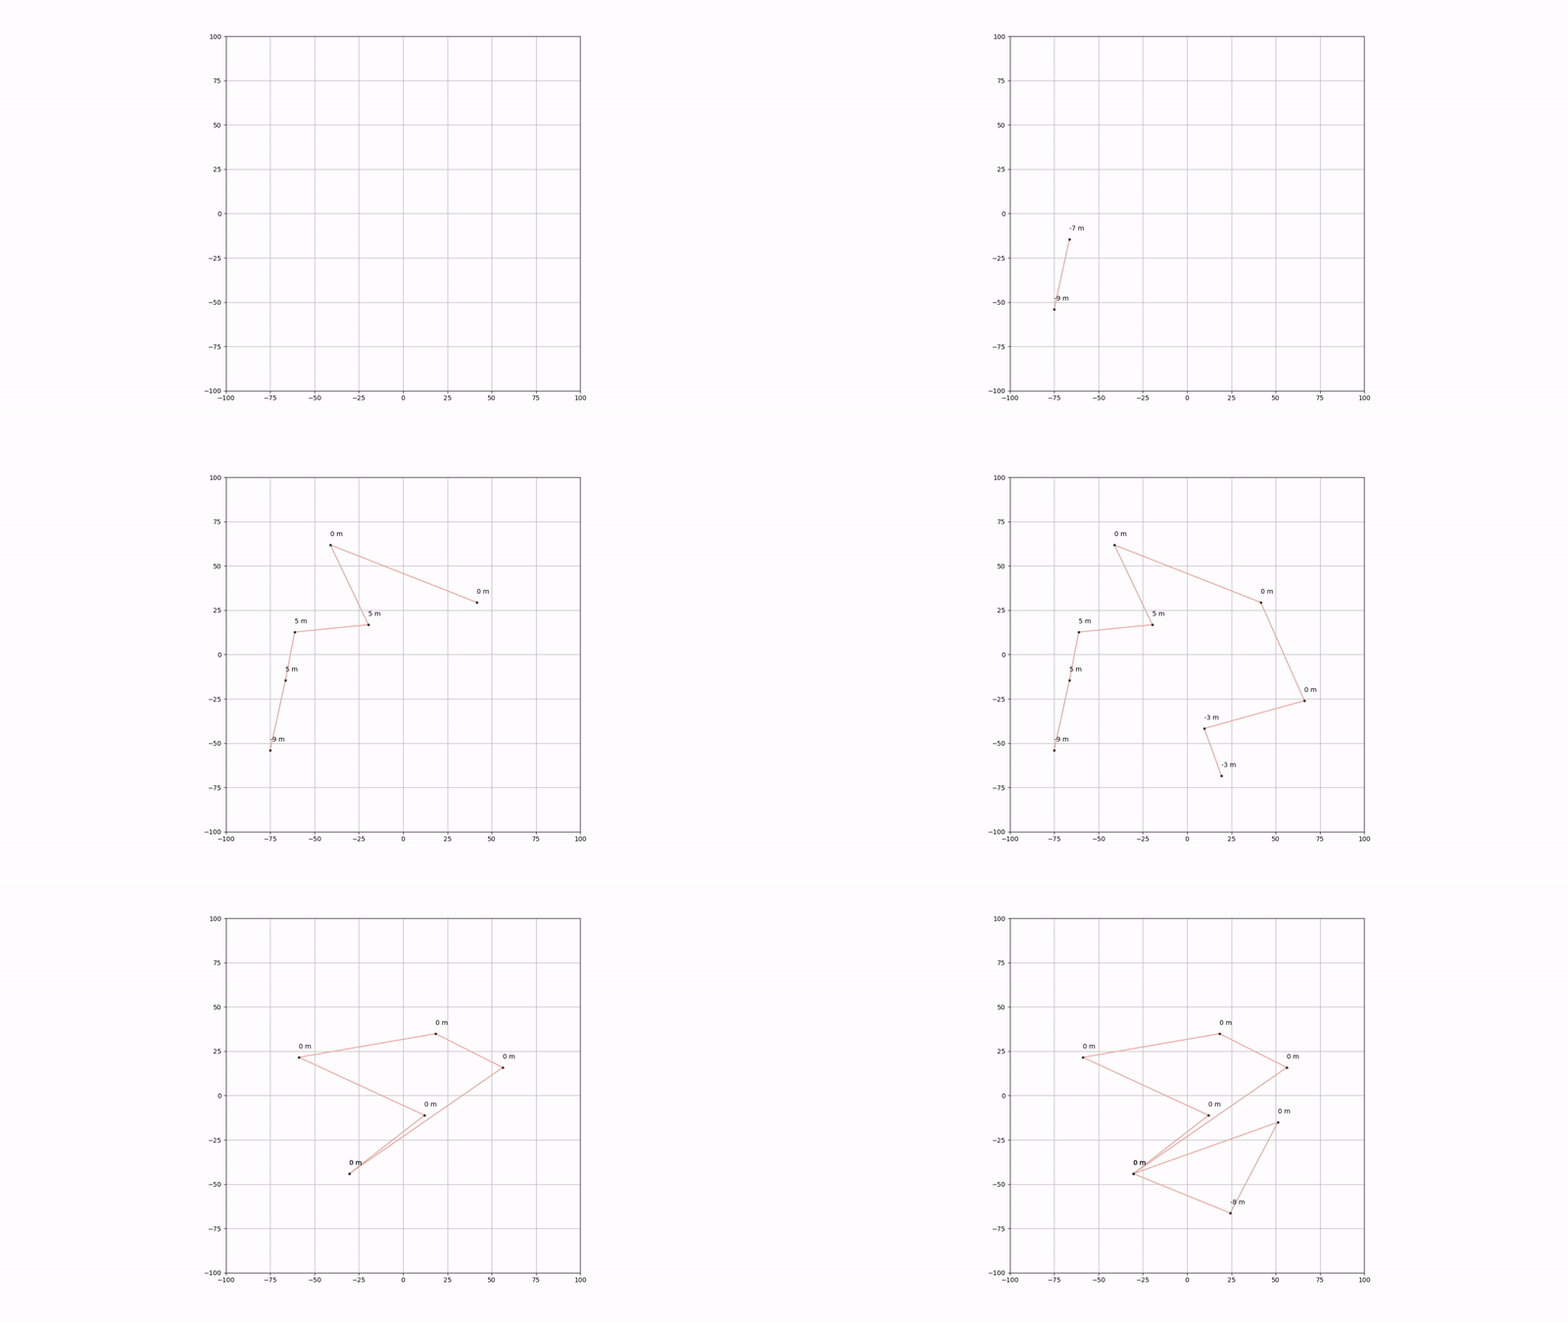
A simple python script to export generated waypoints into a CSV file. Waypoints can either be user-selected or randomly selected.
- Installation
- Usage
- User Selected Waypoints
- Randomly Generated Waypoints
- Circular Generated Waypoints
- Additional Information
Install dependencies
pip install matplotlibOptional install for circular waypoint generation
pip install numpy# Run the script
$ python main.py <flag> <value>Optional arguments:
-h, --help show this help message and exit
-r, --random generates a user-selected amount of random waypoints
-c, --click generates user-selected waypoint positions
-z, --three-dimensional allows user to change the z-axis of a created waypoint
-s, --scroll-sensitivity sets the scroll sensitivity of the mouse when setting the z-axisPress
Zto undo a selected waypoint or revert to a previously generated set of waypoints.Press
Xto clear selected waypoints or to generate a new set of randomly generated waypoints.Press
Cto connect the last and first waypoints.Scroll
⇧to increase the z-axis of the waypoint if the--three-dimensionalflag is used.Scroll
⇩to decrease the z-axis of the waypoint if the--three-dimensionalflag is used.Generated waypoints are only exported at exit.
$ python main.py -c$ python main.py -c -z --scroll-sensitivity 1The generated waypoints are passed piecewise through an algorithm that ensures that each line segment never intersects with each other.
$ python main.py -r <number-of-waypoints>circle_wp_gen.py is a CLI script for generating waypoints of a certain radius and smoothness. The user can choose to define smoothness with point density or the angle between every point.
$ cd circle
$ python circle_wp_gen.py -a <x-radius> -b <y-radius>
Optional arguments:
-h, --help show this help message and exit
-a, --xradius radius of an ellipse on the x-axis
-b, --yradius radius of an ellipse on the y-axis The
numpylibrary is required to run this script.
Exported waypoints can be imported using the pandas or csv module.
pandas module example
from pandas import read_csv

df = read_csv('waypoints.csv')
x = df['X-axis'].values
y = df['Y-axis'].values
csv module example
import csv

with open('waypoints.csv', newline='') as f:
    rows = list(csv.reader(f, delimiter=','))
    x, y = [[float(i) for i in row] for row in zip(*rows[1:])]


