A SQL Portfolio challenge, set up a database, upload and optimise a dataset, analyse and create a visualisation.
- Part 1: Setup a mySQL database 📥
- Part 2: Upload a dataset 🔮
- Part 3: Optimise the data 📈
- Part 4: Analysis and visualisation 📈
- Part 5: Record the project on GitHub ✅
Before we write any SQL we're going to need a database. For this challenge, we'll be using mySQL.
-
Install mySQL locally: https://dev.mysql.com/doc/mysql-getting-started/en/#mysql-getting-started-installing
-
In the installer select the "Full" version, you will need the SQL Server and mySQL Workbench
-
Set yourself up as a database admin and enter a password - you will need this when you log in
-
Open mySQL Workbench, login, familiarise yourself with the mySQL interface and find the databases on the server
-
If you have any issues there's a quick walkthrough here: https://www.youtube.com/watch?v=YSOY_NyOg40
In this challenge we'll be working with data from the Summer Olympic Games, you can find the data here.
Originally sourced from Kaggle
In mySQL there is no visual difference between a schema and a database.
For the full path of a table, you should be used to the convention of:
- database.schema.table
but here you can use either:
- database.table
- schema.table
Hint: Use the CREATE SCHEMA command to create a schema, or CREATE DATABASE for a database.
CREATE DATABASE olympics;
-- Or use CREATE SCHEMA olympics;
USE olympics;
Note the USE will set our path to be a given database or schema.
At this point, we just want the data on our SQL Server, and we'll improve it later.
Using details of our data create a table for this data to fit into.
Hint: In your created database/schema use the CREATE TABLE command to build a table, e.g.
CREATE TABLE mytable (
  col1 INT,
  col2 INT,
  col3 VARCHAR(10),
  col4 VARCHAR(200)
);
Note here the datatypes are important to label correctly and identify numerical data vs. text data, however, the specific accuracy of the datatypes is less important, e.g. VARCHAR(255) vs. VARCHAR(50) - we will fix this later.
Tools like konbert.com/convert/csv/to/sql can help you structure this create table statement.
To put our data on mySQL we will be uploading the raw values via an INSERT VALUES statement. i.e.
INSERT INTO mytable VALUES
(1,2,'a','b'),
(....)
To get the data into this type of format, you can use a tool that converts CSV to SQL, I recommend konbert.com/convert/csv/to/sql due to the file size of this challenge.
- A database or schema containing a table with the data found here
Looking at our data, it can be stored more efficiently. In this section, we'll look to take data from our staging table from part 2 and convert it to smaller tables on specific themes.
Doing this will reduce storage costs, increase query performance and reduce any bottleneck from querying a single table.
Looking at the data there are a few common themes we can see:
- Details about the athletes, their ages, height, weight
- Details about the teams, the NOC and the region
- Details about the games, when and where the games were held
- Details about the results, the event, the competitors and the medals
For this dataset, we'll look to implement a Star Schema design with:
- Our Fact Table: results
- Our Dimension Tables: athletes, teams, games
- More details on Star Schemas https://learn.microsoft.com/en-us/power-bi/guidance/star-schema
When restructuring your table the goal is to make every row unique for that ID.
For example for our athletes, we don't want the same athlete appearing multiple times as this will cause problems when we join tables together.
Start with SELECT DISTINCT and build in additional columns, e.g. Here I'm seeing if each athlete has a unique name
SELECT DISTINCT
id,
name
FROM staging;
And we can verify this with a COUNT and HAVING clause:
SELECT
id,
COUNT(DISTINCT name) as names
FROM staging
GROUP BY id
HAVING COUNT(DISTINCT name)>1;
Which returns zero results, meaning there are now IDs with different names.
However, if we carry on further to ages, we'll see we have multiple for athletes.
SELECT
id,
name,
sex,
COUNT(DISTINCT age) as ages
FROM staging
GROUP BY id, name,
sex
HAVING COUNT(DISTINCT age)>1;
Rather than store the athlete's age at the point of the competition which will change, we could instead store their year of birth and we can recalculate their age using the year of the games.
However, this still returns multiple values, as the date of the games happens at different times of the year, in this case, I will leave the age of the competitor in the fact table as it varies by competitor and year of the games.
Id columns are regularly used with each table in SQL as they are easy for SQL to join and take up less storage space than text objects.
In mySQL we can find the data required for the teams dimension table using
SELECT DISTINCT
team,
noc,
noc_region,
NOC_notes
FROM staging
However, there's no ID field, meaning we'd have to join on the team name.
That is unless we create a column to be our ID, for this we'll use the ROW_NUMBER() function.
However, if you add ROW_NUMBER() to this query you'll find we have the same data repeated multiple times with different IDs
SELECT DISTINCT
ROW_NUMBER() OVER(ORDER BY team) as team_id,
team,
noc,
noc_region,
NOC_notes
FROM staging
What we need to to run our SELECT DISTINCT to find the data we need, then give it an ID. Typically you could do this using a Common Table Expression (CTE) or a Subquery, in this case, I will use a Subquery as historically mySQL cannot run CTEs, however they now can as of version 8, you can check your version by running SELECT version();
Rewriting my query using a Subquery
SELECT
ROW_NUMBER() OVER(ORDER BY team) as team_id,
team,
noc,
noc_region,
NOC_notes
FROM (
	SELECT DISTINCT
	team,
	noc,
	noc_region,
	NOC_notes
	FROM staging
) as teams;
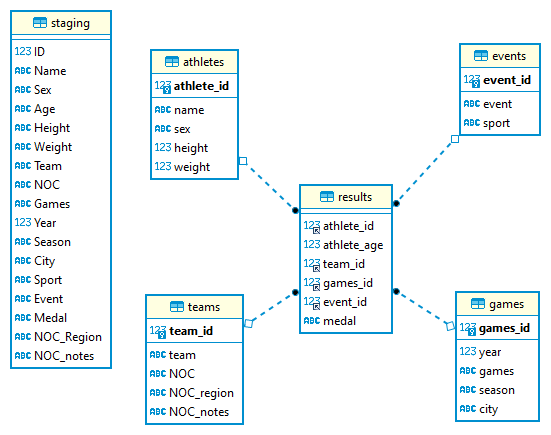
Based on the above we need to create the tables:
- results (Fact table)
- athletes (Dimension table)
- teams (Dimension table)
- games (Dimension table)
- events (Dimension table)
As before we can use the CREATE TABLE command to build a table, e.g.
CREATE TABLE mytable (
  col1 INT,
  col2 INT,
  col3 VARCHAR(10),
  col4 VARCHAR(200)
);
We can check column sizes using:
SELECT
MAX(LENGTH(name)),
MAX(LENGTH(sex)),
MAX(LENGTH(team)),
MAX(LENGTH(noc)),
MAX(LENGTH(noc_region)),
MAX(LENGTH(NOC_notes)),
MAX(LENGTH(event)),
MAX(LENGTH(city)),
MAX(LENGTH(season)),
MAX(LENGTH(sport)),
MAX(LENGTH(games)),
MAX(LENGTH(medal))
FROM olympics.staging;
All IDs should be stored as INT.
If you find you are having errors Incorrect integer value '', this is due to a empty string in your column, this can be resolved with NULLIF().
NULLIF(height,'') as height,
This function will convert an values match '', i.e. empty strings to NULL.
Each of your dimension tables should be set to have a Primary Key. The results table will contain Foreign Keys from your dimension tables.
For example,
-- Add primary key
ALTER TABLE athletes ADD PRIMARY KEY(athlete_id);

-- Add foreign key
ALTER TABLE results ADD FOREIGN KEY (athlete_id) REFERENCES athletes(athlete_id);
Once your tables are built, populated, and linked, download and use DBeaver to create an ER diagram to visualize the relationships between your tables.
Key Steps
- Download DBeaver
- Create connection > SQL > MySQL (Version 8+)
- Server Host: localhost
- Port: 3306
- Username: root
- Password: your database password
- Finish
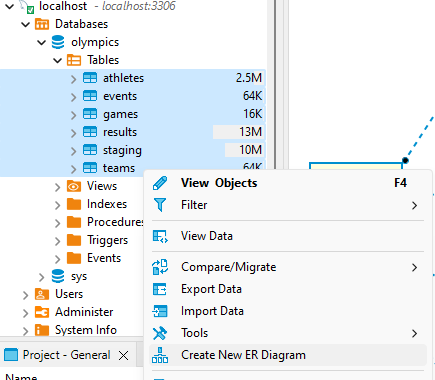
You should see your database and the tables within it.
Select each table > right click > Create New ER Diagram
At the end of this section, you should have:
- a collection of tables in a mySQL database/schema with tables populated with Olympics data.
- a SQL script creating your taking data from your staging table, creating tables, inserting data and creating primary and foreign keys
- a DBeaver ER diagram showing the relationships between your tables
Here is my solution if you get stuck
- SQL - Create Database and Staging Table
- SQL - Insert data into Staging Table
- SQL - Check Column Sizes
- SQL - Create New Tables and Keys
- ER Diagram
Of note, Database/Schema design does have a reasonable amount of subjectivity to it. The solution I have will improve upon having just one table but there may be a more optimised solution depending on how your data will be used.
Now we have our data prepared it's time to run some analysis. You could look at:
- The rise and fall of nations in the medal league tables
- Do physical attributes (height, weight) matter for medals? In weight sports does height/weight matter?
- Home advantage, if your city hosts the Olympic Games is your nation more likely to outperform in the medal tables?
If want to stick to a tutorial you can follow my project, recreating my Running for Olympic Gold viz.
For this output we'll need:
- all gold medalists
- columns for region, year, event, sport, gender
- one row for each medal result (note team sports have multiple medals, we'll count those as 1 medal)
For this viz I'd filtered to running events, but you could pick a sport you're interested in, or leave that up to the user via a filter.
As before we can use the create table command
CREATE TABLE my_viz AS
SELECT DISTINCT
...
FROM results as r
...
On Tableau Desktop you may need to download an additional driver but will be able to connect with the same details as used for DBeaver.
The csv file here Countries-Continents.csv will allow you to join country names to continents for the color scheme
For this viz I've built a rectangular view, however, you may want to try something more adventurous like Olympic feathers by Nadieh Bremer you can try the Radial Heatmap Generator I've built. Do give Nadieh Bremer reference as "recreated from Nadieh Bremer's Olympic feathers.
Save your viz to Tableau Public and share it with #SportsVizSunday
Here is my solution if you get stuck:
- SQL Script: Create Results Table
- Downloadable Tableau Dashboard: Olympic Gold viz
If you haven't already please sign up to GitHub first at https://github.com/join and watch this intro video Git, GitHub, & GitHub Desktop for beginners
Create a repository:
- Create a New repository for this analysis (something like "Olympic-SQL-Analysis")
- Select the visibility as 'Public'
- Initialize the repository with a README
Add files to your repository
Please ensure any files, notes, in fact, anything you put on GitHub does not have any passwords or login information. If you do this view the login as compromised, please delete the repo and create a new password/login.
On Github.com on your repository click on 'Add file' > 'Upload files' and upload your:
- SQL scripts,
- Schema Diagram,
- solution csv
Edit your README.md
GitHub provides a readme file which is rendered when a user views your repository, it's a great way to document your project and looks great for a portfolio project, like this one.
Please copy and paste the template_readme.md and update the links and details about your project.
Note the readme file must be called "README.md" to appear on rendered on the repository home page.


