Dana-cube is a tool to automate the design, execution and visualization of cross reference queries, aka pivot tables aka multidimensional aggregate queries.
*Go to the english version of the rationale
Dana-cube es una herramienta para automatizar el diseño, ejecución y visualización de consultas de referencias cruzadas aka tablas pivote aka consultas agregadas multidimensionales
*Ir a la descripción de objetivos en Español
- dana-cube
- Objetivos en Español
- Rationale in English
- Documentation
- Sample Data
- Dependencies
- License
- DANACUBE enters ALPHA
- Help Needed
- Out there ...
- Contact
Una herramienta que me permita resolver, quizas el más común de los problemas con bases de datos SQL: resolver una agregación (suma, promedio, ...) por dos o mas parámetros y presentarlos en formato matricial (hoja de calculo) Y de forma dinámica, es decir que no necesite estar programada previamente.
Un ejemplo canónico sería de consulta de este tipo sería dame la suma total de ventas de un periodo desglosada por linea de producto y ámbito territorial y lo de dinámica que ahora pueda cambiar el cruce a vendedor y rating financiero del cliente sin necesidad de que este cruce este previamente creado.
Primero querría explicar el por qué es útil una herramienta especifica para ello. Veamoslo con un ejemplo. Imaginen una base de datos de resultados electorales y lo que queremos es una consulta del tipo
Dame la suma de votos cruzados por partido y distrito electoral.
En teoría esto es una consulta muy sencilla en SQL
    select partido_id,provincia,sum(votes_presential)
    from votos_locales
    group by partido_id,provincia
Que devuelve los resultados de esta forma
"993"	"12"	"2134"
"993"	"46"	"7101"
"993"	"47"	"1570"
"1033"	"23"	"1188"
"1070"	"24"	"1027"
"1079"	"01"	"10468"
"1079"	"02"	"33676"
"1079"	"03"	"154037"
"1079"	"04"	"44320"
"1079"	"05"	"15892"
"1079"	"06"	"45252"
"1079"	"07"	"71446"
....
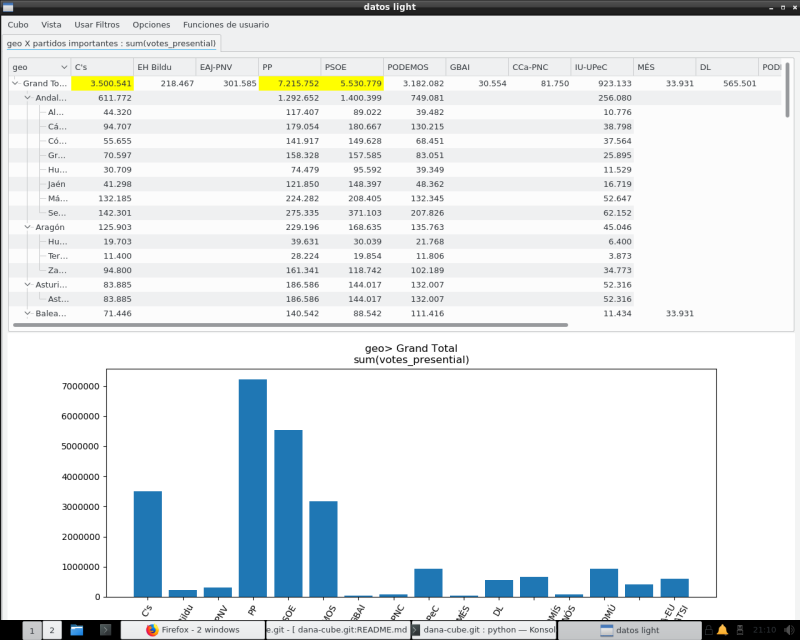
Toda la información está aquí, pero un analista resulta mejor servido si los datos pudieran ser presentados de format matricial (partidos como columnas, distritos como filas) y, si es posible, con información mas legible, por ejemplo como
                               C's       EH Bildu        EAJ-PNV             PP           PSOE        PODEMOS           GBAI        CCa-PNC        IU-UPeC   ...
Grand Total               3,500,541        218,467        301,585      7,215,752      5,530,779      3,182,082         30,554         81,750        923,133
Araba/Álava                  10,468         21,179         28,297         33,609         25,293         48,265                                        6,794
Albacete                     33,676                                       85,152         65,074         32,155                                        9,277
Alicante/Alacant            154,037                                      296,709        188,367                                                      33,293
Almería                      44,320                                      117,407         89,022         39,482                                       10,776
Ávila                        15,892                                       46,963         20,129         11,863                                        3,878
Badajoz                      45,252                                      137,501        148,347         47,203                                       12,281
Balears, Illes               71,446                                      140,542         88,542        111,416                                       11,434
Barcelona                   386,143                                      321,268        463,612
Burgos                       33,373                                       81,780         44,488         36,612                                       10,099
Cáceres                      28,293                                       87,729         84,532         34,552                                        7,216
Cádiz                        94,707                                      179,054        180,667        130,215                                       38,798
Castellón/Castelló           48,220                                       98,341         66,450                                                       9,565
...
Desgraciadamente este tipo de presentación NO esta disponible directamente en la mayoría de programas de consulta. Algunos productos (como Oracle y MSSQL) ofrecen soluciones privadas para generar este tipo de consultas, pero casi nunca están disponibles en las herramientas generales.
En la mayoría de las aplicaciones existen programas de informes que realizan algun tipo de operación de este tipo, pero carecen de flexibilidad lo que se puede consultar y cruzar esta predefindo por la aplicación original y no puede crearse un nuevo cruce sobre la marcha.
Existen una serie de productos en el mercado (conocidos como data warehouse, business inteligence, ...) que permiten estas consultas dinámicas, y muchas mas cosas sobre ello. Normalmente estan vinculados a una base de datos o un tipo de problema concreto, y tienden a ser muy complejas y costosas en recursos (técnicos y de personal, al menos). Lo que nosotros queremos es una herramienta simple, y limitada al problema de las referencias cruzadas
Las consultas de referencias cruzadas de MS Access y las tablas Pivot en muchas hojas de cálculo ofrecen la funcionalidad. Y he visto algunas soluciones extremadamente interesantes con ellas. Pero el mecanismo exige que el usuario trabaje sobre la estructura interna de la base de datos, que puede ser muy compleja.
Además, la estabilidad, mantenibilidad, seguridad y las posibilidades de distribuir estas soluciones sobre Access y/o Excel son muy problemáticas. Mi experiencia con el rendimiento de los enlaces via ODBC es menor que buena. Y como antiguo administrador, "enganchar" a una base de datos corporativa "real", una herramienta tan incontrolable como es la interfaz ODBC, es una pesadilla desde el punto de vista de la seguridad y, probablemente también, del rendimiento.
ofrecemos un programa danacube.py para que los usuarios puedan ejectuar y visualizar interactivamente las distintas consultas cruzadas sobre una base de datos.
Como se puede ver en el ejemplo, no referenciamos directamente a la base de datos subyacente, sino a una abstracción Cada instancia se ejecuta contra lo que denominamos un Cubo esto es la visión de una tabla de datos (o estructura equivalente), los campos (fields) sobre los que queremos hacer las agregaciones y los criterios de agrupación (que denominamos guias). Estos criterios pueden ser campos escalares o agrupaciones jerarquizadas. Si las guias son fechas, automaticamente ofrecemos la posibilidad de jeraquizarlos (por años, años-mes, ...). Cada consulta cruzada entre dos guias lo que denominamos Vista.
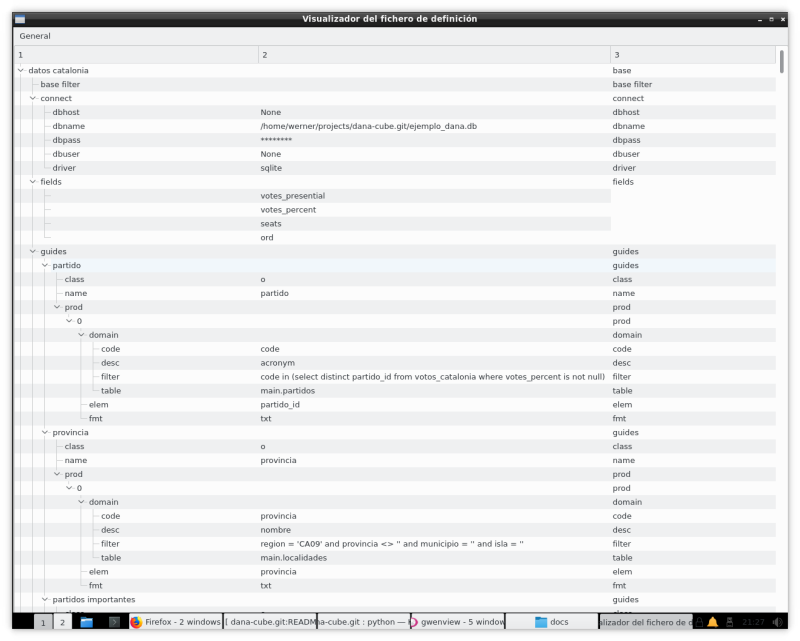
Las definiciones de estos Cubos se hacen a través de ficheros de texto (json_), con lo que los posibles accesos a la base de datos están controlados externamente.
Y el acceso se realiza internamente a través de una API con la intención de simplificar la generación de estas matrices / referencias cruzadas; permitiendo, además integrarlas en otras aplicaciones . A traves de esta interfaz, la generación del ejemplo anterior puede reducirse al siguiente código (sin formateo)
from dana-cube.support.util.jsonmgr import load_cubo
from dana-cube.core import *

mis_cubos = load_cubo()
cubo = Cubo(mis_cubos["datos light"])
vista = Vista(cubo,'provincia','partidos importantes','sum','votes_presential',totalizado=True)
resultado = vista.toList()
for linea in resultado:
    print(linea)
Un usuario final de la herramienta no puede definir (ni utilizar) nada que no se encuentre en el fichero de configuración. ¿Por qué? Una razón es permitir que el usuario trabaje con una visión de los datos que no tiene por que corresponder con la estructura interna de la base de datos, sino a un modelo conceptual mas cercano a su visión de los datos. Por otro lado, es un modo para los DBAs para limitar que esta disponible para consultas dentro de la base de datos, mas alla de la seguridad intrinseca de la base de datos
Danacube.py permite generar dinámicamente una serie de gráficos sobre los datos presentados y exportar los resultados a otras herramientas para un análisis posterior, mas detallado. O a traves de extensiones de código (vea como hacerlo ) crear sus propias herramientas de análisis
Además ofrecemos los programas siguientes
- cubebrowse.py Diseñado para manipular las definiciones de los cubos. Aunque al ser un fichero json pueden ser editados a mano en caso de necesidad
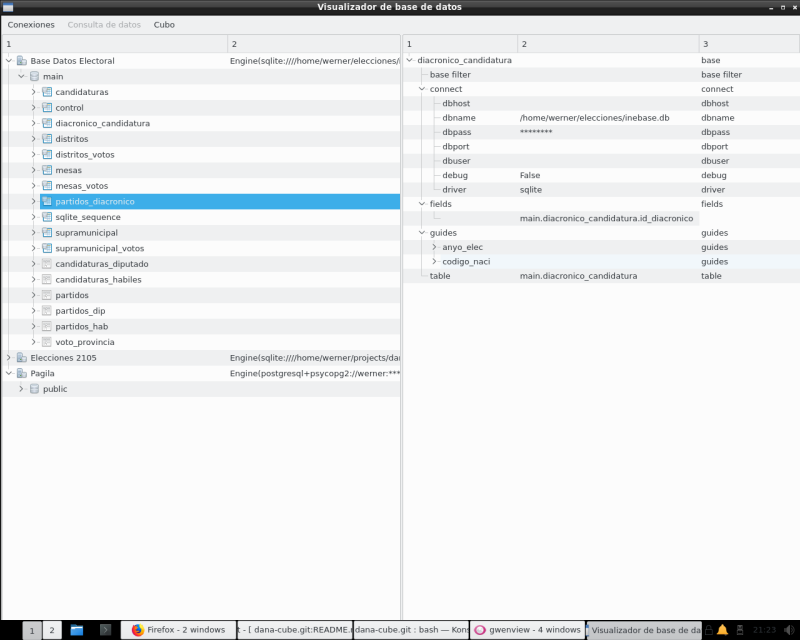
- danabrowse.py Para navegar por el contenido de los servidores de base de datos en nuestro entoro y, si se considera conveniente, generar directamente definiciones de cubos desde el catalogo de las bases de datos database
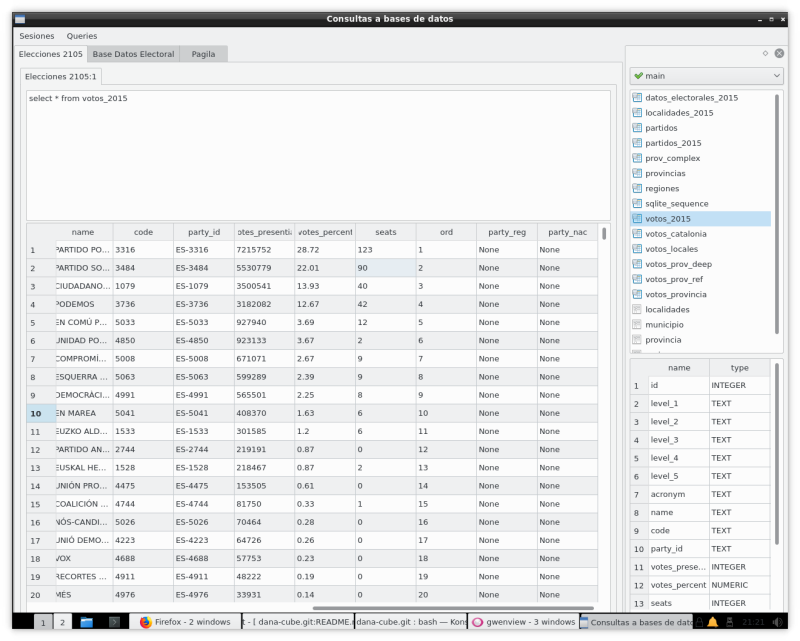
- danaquery.py Una herramienta muy simple para ejecutar consultas SQL en nuestro entorno
La herramienta está programada con python3 + PyQt5 La infraestructura es agnósstica respecto del gestor de base de datos. Para ello utilizamos SqlAlchemy como "data backend", de modo que, en teoría cualquier gestor accesible para ella puede ser utilizado con dana-cube; aunque no es descartable que requiera de pequeños ajustes
Table of Contents
Probably the most common problem an SQL database users is to solve the need to resolve an aggregate (sum, aver,...) by two or more parameters and show them in array (spreadsheet) form.
An example will explain it. Supose a database with electoral results, and what whe need is a query of the type Give me the sum of votes per party and and per electoral district .In SQL this is a very simple query, like
    select partido_id,provincia,sum(votes_presential)
    from votos_locales
    group by partido_id,provincia
and gives results in the form
"993"	"12"	"2134"
"993"	"46"	"7101"
"993"	"47"	"1570"
"1033"	"23"	"1188"
"1070"	"24"	"1027"
"1079"	"01"	"10468"
"1079"	"02"	"33676"
"1079"	"03"	"154037"
"1079"	"04"	"44320"
"1079"	"05"	"15892"
"1079"	"06"	"45252"
"1079"	"07"	"71446"
....
While all the info is there, it's clear that an analyst is better server if data could be shown in an array format (parties as rows, electoral districts as columns) and with some additional info, more or less like
                               C's       EH Bildu        EAJ-PNV             PP           PSOE        PODEMOS           GBAI        CCa-PNC        IU-UPeC   ...
Grand Total               3,500,541        218,467        301,585      7,215,752      5,530,779      3,182,082         30,554         81,750        923,133
Araba/Álava                  10,468         21,179         28,297         33,609         25,293         48,265                                        6,794
Albacete                     33,676                                       85,152         65,074         32,155                                        9,277
Alicante/Alacant            154,037                                      296,709        188,367                                                      33,293
Almería                      44,320                                      117,407         89,022         39,482                                       10,776
Ávila                        15,892                                       46,963         20,129         11,863                                        3,878
Badajoz                      45,252                                      137,501        148,347         47,203                                       12,281
Balears, Illes               71,446                                      140,542         88,542        111,416                                       11,434
Barcelona                   386,143                                      321,268        463,612
Burgos                       33,373                                       81,780         44,488         36,612                                       10,099
Cáceres                      28,293                                       87,729         84,532         34,552                                        7,216
Cádiz                        94,707                                      179,054        180,667        130,215                                       38,798
Castellón/Castelló           48,220                                       98,341         66,450                                                       9,565
...
Sadly, this is usually NOT available in most data query programs. Some DB products (fi. Oracle and MSSQL) offer their own private means of generate such queries, but they're not always available in general tools. MS Access cross reference queries or Pivot Tables available in several spreadsheet programs, DO offer this functionality,I've seen quite a few more than interesting.
But, stability, maintainability, and the chance of distributing it, is another story. My own experience with ODBC linking performance is less than good. And as a former DBA, piggybacking an uncontrollable tool (as the ODBC interface is) on a corporate database is a security and performance nightmare
We provide a module (and its API) which aims to simplify the generation of such arrays /cross references, allowing to integrate it in any Python module. Thru such an interface the generation of the above sample could be reduced to the following Python core (with formatting extracted):
from dana-cube.util.jsonmgr import load_cubo
from dana-cube.core import *

mis_cubos = load_cubo()
cubo = Cubo(mis_cubos["datos light"])
vista = Vista(cubo,'provincia','partidos importantes','sum','votes_presential',totalizado=True)
resultado = vista.toList()
for linea in resultado:
    print(linea)
As you can see from the sample, we do not refer directly to the underlying database, but to an abstraction. Each instance runs against what we call a Cube. This is the view of a data table (or table-like DB object -a view, a select statement, ...) and the definition of the potential fields (other tools call it measures ) to query and the criteria over which to search, which we call guides ( other tools call dimensions or hierarchies ). This criteria can be scalar fields or hierarchical structures. If the guide is a date field; we automatically provide (for SQLITE, MySQL, PostGreSQL and Oracle, atm) for several subindexes (years, years-month, ...). And every different cross aggregation is what we call a Vista. We provide this abstraction as an Json text file ( vide infra )
As you will notice, this is, in this way is not designed as an end user tool , rather it is designed to be used for knowledgable users (DBAs, developers, data owners) or as a ready made API cum sample tool to be integrated in other's people work (as it still is in heavy development, Caveat emptor ).
But we do provide and end user tool, which can be used standalone: It is called danacube.py Is our main tool where we execute our aggregate accesses to the database (to the cube), and provide means to show graphics or to export the results into several data formats
An end user can not define their own cubes, nor use guides outside what's defined in the configuration file. ¿Why? One reason is that it allows showing the end user an view to the data which doesn't need to ajust exactly to the internal database structure. On the other hadn, it's a way carefull DBAs can limit what is available for search in a production database, beyond the database own security.
The tool is open to user extensions, so special test can be run over the data. See docs here-still only spanish- for the user functon module
- cubebrowse.py Is a tool designed to manipulate the cube definitions. They are a plain Json file (see below) and can be edited by hand if necessary
- danabrowse.py We can browse the contents of the database servers in our environment, and if necessary, generate direct cube definitions from the catalog of the database
- danaquery.py A very simple tool to execute arbitrary sql code against database servers in our environment
The tool is programmed in python3 + PyQt5 but it might be possible to be run under Python2 (we try to be as much compatible as possible, but haven't tested it in a while) . And we make avaliable the core functionality without the need of using Qt (but functionaly behind the main version)
The infrastructure is database agnostic. We use SqlAlchemy as data backend, so in theory every database which can be accessed thru it should be available, although a few specific changes might be needed
It's a work in progress
- An User's guide to the tool (spanish only now) here (a WIP)
- The API for the core functionality us here
- The API for the Guide model trees is here
- The full definition specs can be found at this place (spanish only)
- The user functions specs can be found this place (spanish only)
We will provide a test database (with results of the Spanish General Election in 2015) for several supported databases, with minimal changes between them. You will find both a sample_data.zip and a sample_data.tar.gz file in the root directory of the project, there you'll find both a cube definition file and a DB dump for the samples
As a matter of fact, the tool grew analizing those data
Besides PyQt, we use:
- SqlAlchemy as a data backend (only core functionality).Main reason is transparent access to the catalogs
- DateUtil for some date related functions
- SqlParse ( Optional ) for some trace outputs
- XlsxWriter Guess it ...
- Matplotlib for all the graphic stuff
For my part, while I (Werner Llácer Viciano) retain all ownership of the code, this is an open source product.
Best policy would be to comply to the terms of the LGPL license family (I find it the most honest license both for the authors and the users)
a good enough policy would be to acknowledge my autorship of this piece of code and to send upstream all corrections and enhancements to the original functionality.
If in doubt, or your legal overlords demand some clear answer, then, my code is LGPL v2 and/or greater than licensed. For . more grave doubts please contact me, We'll broker an favorable agreement.
A few caveats :
- Any module installed via the "user functions" functionality is NOT bound to the above mentioned license. That functionality was intendended for the users to extend the capabilities of the tool, so they remain (whatever the mode of linking) property of their developers. In spite of this, those provided by my as samples, are still mine, and licencing aplies (but you have unrestricted right to fork)
- From my point of view, data used and/ore produced by the tool, are owned by their users, not, in any way, by the tool (i.e. me)
- IIRC, the *GPL licenses demand that the code must be made available by the distributor. I think that linking where the source of Danacube resides covers it. Although it might be, from the practical POV a bad idea: repositories may move, version changes could be destructive, and any private enhancement could get lost, ...
- I'm not into legal hairsplitting, so just to avoid confusion, I don't mind if the code is used in/distributed with products under other open source license in the broad sense, as long as they honor my licensing for my code.
- IIRC, my jurisdiction -Spain- DOES NOT recognize software patents, so don't bother me with that. I wonder, anyhow, what would be "patentable" in my algorithms ... and if, not covered by thousands of previous art.
Qt, PyQt -and the additional libraries-, licensing might impose other restrictions, please keep an eye on it (AFAIK PyQt is/was GPL licensed)
What does it means?
-
We deem that we have achieved a functional 'completeness' of the tool, so it should be useful for valiant user; but that it still lacks proper outside testing (so, for sure, many bugs ahead) and documentation (hope to solve it soon)
-
What we know it's missing:
- Unknown bugs all around (i know i'm not perfect). And a few known ;-)
- Public API for the core functionality is still open (need input for use cases)
- The user interface is implemented just for my needs and lacks internationalization (worse still, it's now a mix of english and spanish)
- It's reasonably well tested with Sqlite, MySQL, PostgreSQL,;
- As of the last release Oracle 's support, while it works, is still missing thorough testing..
- I haven't had the chance to adapt/test it against DB2 or MSSQL Server ¿Any volunteer?
- Nor performance, neither security have been, till now, top priority goals. You've been warned
- Legalese is missing in code (copyrights, licence specs, and so on)
Active tasks can be read here
We could profit from someone knowledgable in UI development. I'm a DBA type and, well, it's kind of difficult for me
Testers are welcome.
If you feel my package isn't enough for you have a look at the following projects of similar scope and technology. They might be of interest for you
You can email me regarding this application thru the address danacube.sup at gmail dot com
A.M.D.G. & B.V.M.


