- Apr 15, 2014
- #latex , #matplotlib , #latex , #tricks , #script
- 2 min read
I write most of my math/numerical analysis scripts in Python, and I tend to use matplotlib for plotting. When including a matplotlib plot in LaTeX I got the highest quality results by saving the plot as a PDF and using \includegraphics{plot.pdf} in LaTeX. However, it bothered me that the plot had different fonts and font sizes than the rest of the document. Here’s how I fixed that.
I always choose the size of my plots as a percentage of the text width. For example width=0.6\textwidth. This allows me to use 0.3\textwidth for images that are going to be side-by-side and not worry about absolute sizes. We want matplotlib to output the right size plot so we need to find what exactly the textwidth is and tell matplotlib. Do this by writing \the\textwidth inside your LaTeX document (inside the document, not the preamble) and running it through pdflatex or whatever LaTeX engine you use. You’ll find that LaTeX will replace the command with some number. Record this number.
For every LaTeX document that has plots, I write a script figures.py which creates all the plots. Copy the following script into figures.py and save it into the same folder as your LaTeX document. Replace fig_width_pt with whatever number you got from above.
import numpy as np
import matplotlib as mpl
mpl.use('pgf')
def figsize(scale):
fig_width_pt = 469.755 # Get this from LaTeX using \the\textwidth
inches_per_pt = 1.0/72.27 # Convert pt to inch
golden_mean = (np.sqrt(5.0)-1.0)/2.0 # Aesthetic ratio (you could change this)
fig_width = fig_width_pt*inches_per_pt*scale # width in inches
fig_height = fig_width*golden_mean # height in inches
fig_size = [fig_width,fig_height]
return fig_size
pgf_with_latex = { # setup matplotlib to use latex for output
"pgf.texsystem": "pdflatex", # change this if using xetex or lautex
"text.usetex": True, # use LaTeX to write all text
"font.family": "serif",
"font.serif": [], # blank entries should cause plots to inherit fonts from the document
"font.sans-serif": [],
"font.monospace": [],
"axes.labelsize": 10, # LaTeX default is 10pt font.
"font.size": 10,
"legend.fontsize": 8, # Make the legend/label fonts a little smaller
"xtick.labelsize": 8,
"ytick.labelsize": 8,
"figure.figsize": figsize(0.9), # default fig size of 0.9 textwidth
"pgf.preamble": [
r"\usepackage[utf8x]{inputenc}", # use utf8 fonts becasue your computer can handle it :)
r"\usepackage[T1]{fontenc}", # plots will be generated using this preamble
]
}
mpl.rcParams.update(pgf_with_latex)
import matplotlib.pyplot as plt
# I make my own newfig and savefig functions
def newfig(width):
plt.clf()
fig = plt.figure(figsize=figsize(width))
ax = fig.add_subplot(111)
return fig, ax
def savefig(filename):
plt.savefig('{}.pgf'.format(filename), bbox_inches='tight')
plt.savefig('{}.pdf'.format(filename), bbox_inches='tight')
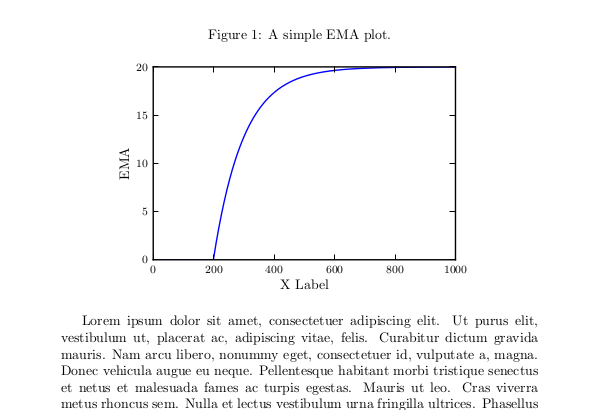
# Simple plot
fig, ax = newfig(0.6)
def ema(y, a):
s = []
s.append(y[0])
for t in range(1, len(y)):
s.append(a * y[t] + (1-a) * s[t-1])
return np.array(s)
y = [0]*200
y.extend([20]*(1000-len(y)))
s = ema(y, 0.01)
ax.plot(s)
ax.set_xlabel('X Label')
ax.set_ylabel('EMA')
savefig('ema')You must import matplotlib and make any rc changes before importing matplotlib.pyplot. matplotlib expresses sizes in inches, while LaTeX likes sizes to be in pt, so the first part of this script sets up sizes in matplotlib properly. The figure height is determined by the golden ratio, which is highly aesthetic ratio (it’s a good default).
Running the above with python figures.py produces two files: ema.pdf and ema.pgf. The PDF file is used just to have a stand-alone version of the plot and make sure everything looks right.
To incorporate the plot into LaTeX, put \usepackage{pgf} in the preamble and insert using \input{ema.pgf}. For example:
\documentclass{article}
\usepackage{pgf}

\begin{document}

\begin{figure}
    \caption{A simple EMA plot.\label{fig:ema1}}
    \centering
    \input{ema.pgf}
\end{figure}

\end{document}
Thank you Dan for the suggested changes to my script
original article: http://bkanuka.com/posts/native-latex-plots/