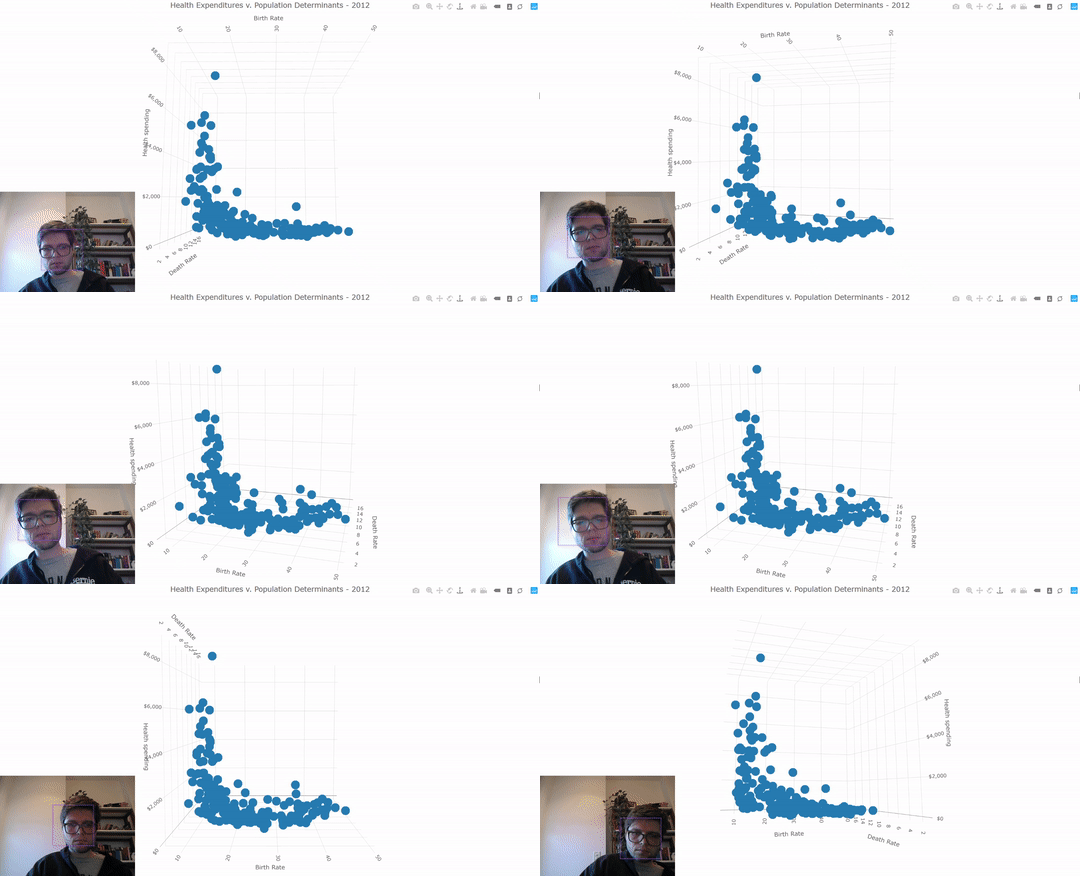
A plotly.js extension that adds a new option for navigating 3D plots: using your face.
Using JavaScript ML face tracking from the tracking.js library, the PortalViewer class transforms your screen into a magic portal, creating an artificial sense of depth by adjusting the perspective of the rendered plot according the position of your face relative to the screen. With Portal View, you can quickly gain an understanding of the 3D structure of a plot by moving your head to see the parallax effect of viewing the plot from different angles. This inuitive approach to navigating a 3D plot mirrors the way we subconsciously gain understanding of our real-world surroundings.
yarn add plotly-portal-vieweror
npm install plotly-portal-viewerInitialize an instance of the PortalViewer class and call .addToPlot with a rendered plotly element.
Initialization must be after the DOM as loaded, e.g. in a DOMContentLoaded event handler or in a script at the end of the body.
const PortalViewer = require('plotly-portal-viewer')
const myPortalViewer = new PortalViewer()
Plotly.newPlot('myDiv', data, layout)
  .then(() => myPortalViewer.addToPlot('myDiv'))
This will add the Portal Viewer button to your plot's modebar. Click to activate. While Portal View is active, an aditional modebar button appears to toggle showing the webcam view and face tracking debug information.
PortalViewer (cameraSettings, trackerSettings)
Optional settings objects may be passed to customize the viewer config. All settings are optional.
| Property | Description |
|---|---|
| cameraSettings.range | Maximum amount of camera offset to apply. Default: {x: 3, z: 3} |
| cameraSettings.smoothingDecay | Larger values increase the amount of smoothing. Default: 300 |
| cameraSettings.forecastStart | How long for lost tracking to be recovered to wait before substituting forceasted face position. Default: 22 (ms) |
| cameraPosition.forecastEnd | When to stop forecasting and leave the camera position idle ater losing tracking. Default: 500 (ms) |
| trackerSettings.trackerInitialScale | The initial scale to start the block scaling. |
| trackerSettings.trackerStepSize | The block step size. Default: 1 |
| trackerSettings.edgesDensity | Percentage density edges inside the classifier block. Default: 0.1. Valid range [0.0, 1.0]. |
For additional documentation on the tracker settings, see https://trackingjs.com/
.AddToPlot(plot)
Extends an existing plotly 3D plot with Portal Viewer capabilities, adding the Portal View button to the modebar.
| Property | Description |
|---|---|
| plot | Either an element object for a plot or a string containing the id of one. Required. |
.toggleTracking()
Manually activate or deactivate tracking. Updates the corresponding modebar button state.
.toggleVideo()
Manually activate or deactive video passthorugh. Updates the corresponding modebar button state. Video will only be visible when tracking is also active.
