A runtime profiler for Rails applications.
Check which part of your Rails application is causing slow response time. runtime_profiler gives you an easy way to find performance problems by profiling an endpoint or a method in your Rails application.
Add this line to your application's Gemfile:
# In your Gemfile
group :development, :test do
  gem 'runtime_profiler'
end
And then execute:
$ bundle
Or install it yourself as:
$ gem install runtime_profiler
To profile a specific class (model, controller, etc), all you need to do is to wrap a line where the target class (or instance) is calling a method (entry point of profiling).
# Profiles runtime of `ClassToProfile` class.
RuntimeProfiler.profile!('description', [ClassToProfile]) {
  # one line where `ClassToProfile` (or its instance) is calling a method
}
Since the second argument of .profile! accepts array of classes, then you can provide all target classes that you want to profile.
You can make a test that targets a particular endpoint (or even just a method) and use RuntimeProfiler.profile! method in the test.
it 'updates user' do
  # Profiles runtime of PUT /users/:id endpoint and
  # specifically interested with the methods of `User` model.
  RuntimeProfiler.profile!('updates user', [User]) {
    patch :update, { id: user.id, name: 'Joe' }
  }

  expect(response.status).to eq(200)
end
Run the test as usual and follow printed instructions after running.
Or if you prefer writing just code snippet, then just wrap the snippet with RuntimeProfiler.profile! method:
# Profiles runtime of `UserMailer` mailer.
RuntimeProfiler.profile!('UserMailer', [UserMailer]) {
  user = User.last
  UserMailer.with(user: user).weekly_summary.deliver_now
}
Note: The code (test or not) where RuntimeProfiler.profile! is used must be free from any mocking/stubbing since the goal is to check performance bottlenecks.
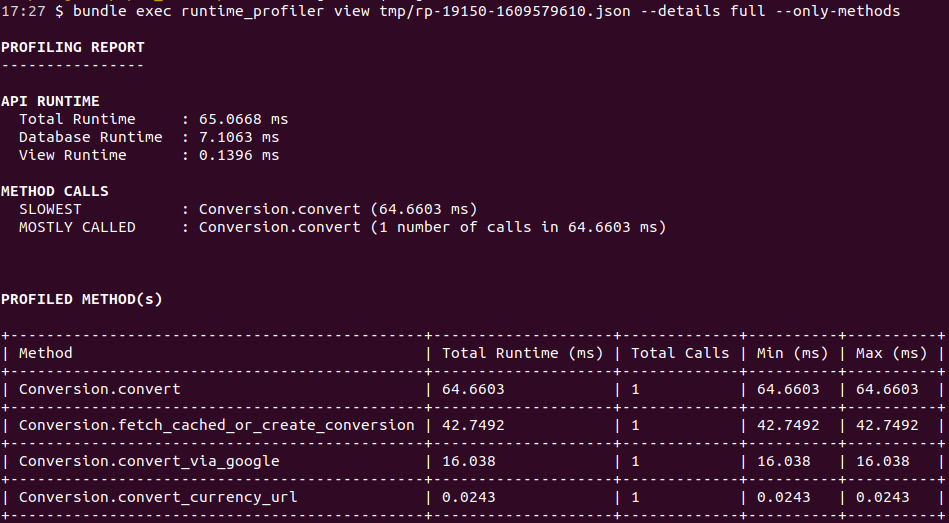
To see profiling report, you can open the report in browser with JSON viewer report. Or you can run the following command:
bundle exec runtime_profiler view tmp/rp-124094-1608308786.jsonHere are the command line options for runtime_profiler view command.
$ bundle exec runtime_profiler view --help

  NAME:

    view

  SYNOPSIS:

    runtime_profiler view <profile.report.json> [options]

  DESCRIPTION:

    Display report in console given the JSON report file

  OPTIONS:

    --sort-by COLUMN
        Sort by COLUMN. COLUMN can be "max_runtime", total_calls" or "total_runtime". Default is "max_runtime".

    --details TYPE
        TYPE can be "full" or "summary". Default is "summary"

    --only-sqls
        Show only SQL queries. Default is false.

    --only-methods
        Show only methods. Default is false.

    --runtime-above RUNTIME
        RUNTIME is integer or float value in ms.

    --calls-above CALLS
        CALLS is integer value.

    --rounding ROUNDING
ROUNDING is integer value. Used in rounding runtimes. Default is 4.All the configurable variables and their defaults are listed below. There is no one correct place where to put these configurations. It can be inside config/initializers folder of your Rails application. Or if you are using test to profile, it can be in the last part of spec/spec_helper.rb.
RuntimeProfiler.output_path = File.join(Rails.root.to_s, 'tmp')
RuntimeProfiler.profiled_constants = [User]
RuntimeProfiler.profiled_paths = %w(app lib)
RuntimeProfiler.profiled_sql_commands = %w(SELECT INSERT UPDATE DELETE)
# Useful when you want to exclude in profiling specific method(s) from framework/library being used
RuntimeProfiler.excepted_methods = [:attribute_type_decorations, :_validators, :defined_enums]After checking out the repo, run bin/setup to install dependencies. Then, run rake spec to run the tests. You can also run bin/console for an interactive prompt that will allow you to experiment.
To install this gem onto your local machine, run bundle exec rake install. To release a new version, update the version number in version.rb, and then run bundle exec rake release, which will create a git tag for the version, push git commits and tags, and push the .gem file to rubygems.org.
Bug reports and pull requests are welcome on GitHub at https://github.com/wnuqui/runtime_profiler. This project is intended to be a safe, welcoming space for collaboration, and contributors are expected to adhere to the Contributor Covenant code of conduct.
Part of this profiler is based from https://github.com/steventen/sql_tracker.
The gem is available as open source under the terms of the MIT License.
