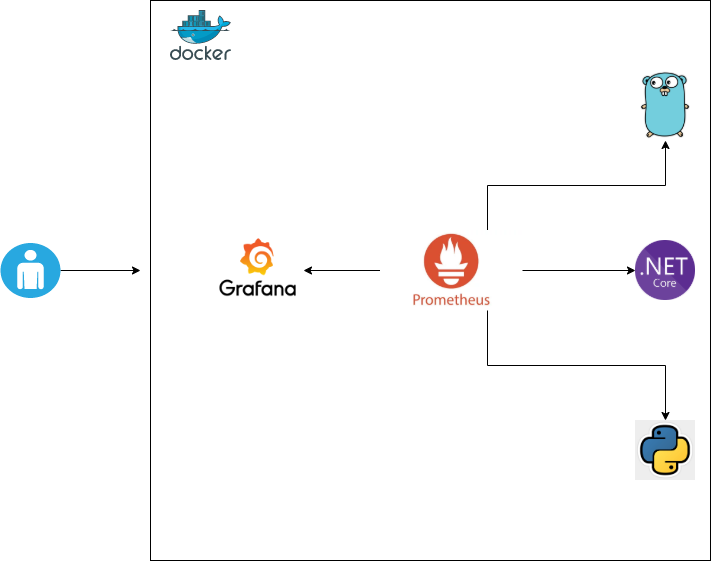
This workshop will cover
- Fundamental concepts of metrics scraping using Prometheus
- Extending a demo application with Prometheus scraping using built-in and custom metrics
- Adding Grafana dashboard to represent Prometheus metrics
- Defining rules for triggering alerts
- Quick overview of exporters to infrastructure tooling
This workshop focuses on presenting a modern approach for collecting metrics from developed services and infrastructure tools. Prometheus will be used to collect, query, output metrics and triggering alerts which should be represented through Grafana.
The workshop is very hands-on, which means the focus is doing exercises with the tools and instrumenting code that uses those tools.
- Part 0: Setup
- Part 1: Prometheus and Grafana
- Part 2: Instrumenting Code
- Part 3: Grafana Dashboards
- Part 4: Alerting
- Docker
- Prometheus
docker pull prom/prometheus - Grafana
docker pull grafana/grafana
- Prometheus
