This repo contains the source code for the work MultiVision: Designing Analytical Dashboards with Deep Learning Based Recommendation, accepted at IEEE VIS 2021. The paper preprint is at this arxiv link.
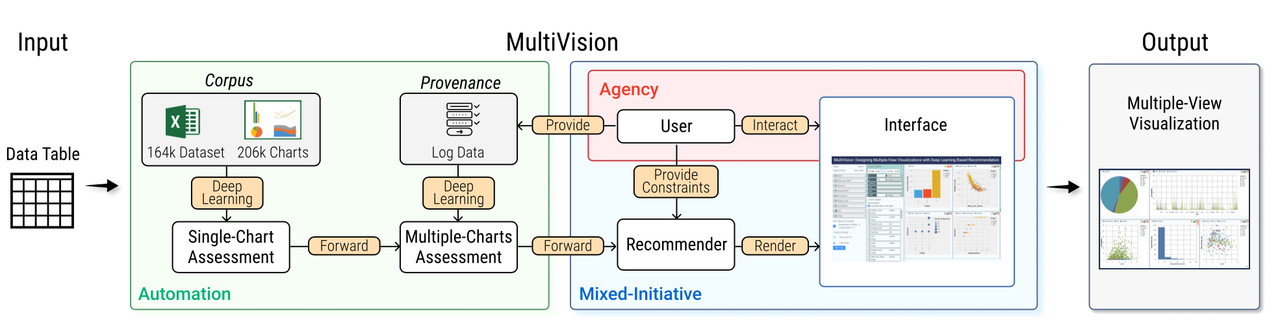
Given a data table, MultiVision recommends a chart and/or a dashboard containing multiple charts for conducting data analysis.
This repo is wroten in python 3.6 with Pytorch 1.7.1. The full dependency can be found and installed via requirements.txt.
Demo.ipynb demonstrates how to run the trained model.
- Input: a data table in CSV format
- Output: an MV, describled as a list of charts (as shown below, where the `indices' is the indices of data columns encoded by this chart.
## The first chart is a line chart encoding data columns 2, 3, 5. The second chart is a bar chart encoding data columns 0, 1, 6.
[{'indices': (2, 3, 5),
  'column_selection_score': 0.17087826005069967,
  'chart_type': 'line',
  'chart_type_prob': 0.9999961295181747,
  'final_score': 0.1708775986694998},
 {'indices': (0, 1, 6),
  'column_selection_score': 0.953993421295783,
  'chart_type': 'bar',
  'chart_type_prob': 0.9747984895572608,
  'final_score': 0.9299513461266928}]
VegaLiteRender.py provides a toolkit for rendering the above results into a Vega-Lite chart.

This repo is under construction.
- The trained model and demo
- Tutorial for running the scoring model
- The visual encoding recommender
- The interface
- The training script
For the training dataset, please refer to udpates from Table2Charts.