Hopefully helpful information about installing solar for a residence
Introduction
Selecting a System
Planning the System
Installing the System
Maintenance
Heat Pump
This first graph shows the amount of electricity generated, and the amount used. The usage is with no electric car and pretty minimal use of other electricity, but some electrical use for heating in the winter. This means that for the first year, we have used natural gas for heating for a couple of days.
This following graph adds in the solar declination, which is the angle that the sun hits the earth and
the average daily temperature over a week.
The following graph shows the amount of surplus electricity. My utility has an annual true-up program, which means the amount you owe or are paid is figured out once per year. The goal generally is to generate the same amount of electricity over the year as you use. Note that coming out even for the year would be getting back to zero, so this indicates a large surplus the first and following years. This graph shows the Covid impact in March of 2020 where two of us were working at home.
I used a Watt meter (Killawatt) to measure different devices and multiplied by estimated time of use. I am showing these numbers just to give an idea of what some devices can use.
| Wh/day | Device | Description |
|---|---|---|
| 1232 | Refrigerator | Energy rating between 435 and 470 = 450 kWh per year/365 = 1232 Wh |
| 400 | Oven | 2400W * 5 hours per month / 30 days |
| 200 | Microwave | 1200W * .16h (10 minutes) = 360 |
| 13 | Range | 800W * .5h * 5 days / 30 days |
| 100 | Washer | 500W * 40 minutes = 350W * 2 people / 7 = 100 Wh |
| 0 | Dryer | All drying is done on a rack. |
| 540 | TV | 0W when off, 90W * 6h |
| 480 | Cable Box | 12-20W * 8h (19W when off, same as on?) = 20*24 |
| 168 | Computer | 56W * 3h |
| 75 | Computer Monitor | 25W * 3h |
| 240 | Cable Router | 10W * 24h |
| 40 | Home Router | 5W * 8h |
| 132 | LED Living Lights | 12 W * 4 lights * .7 dimmed * 3 hours = 132 Wh |
| 156 | Office Lights | 26 W * 2 lights * 3 hours = 156 Wh |
| 96 | POE Injector | 4W * 24 |
| 3904 | Total | Wh per day |
By doing this exercise, I was able to find a few things we weren't really using, and I was surprised at what the entertainment cost was and that the Cable Box indicated that we were saving electricity when it was off, but really wasn't. Unplugging is more important than expected in some cases if you really want to use the least amount of electricity possible.
I also looked at utility bills and found that our actual use for one month was 186 kWh, which means that our actual use is about 186kWh/month / 31 days = 6kWh/d. So the measurements and calculations above are not completely accurate. We must be using things a bit more than expected.
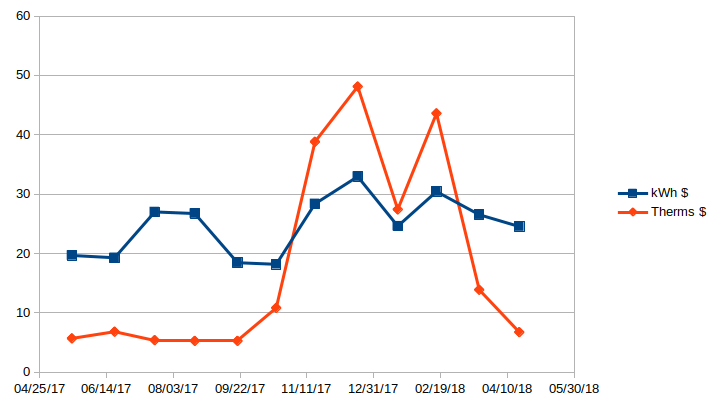
The following table shows actual electrical cost for one year (2017).
| Quantity | Calculation | Description |
|---|---|---|
| 180 kWh per Month | 145+142+199+197+136+134+209+242+180+217+186+172=2159/12=180 | Total Electrical |
| 25$ per Month | 20+19+27+27+18+18+28+33+25+30+27+25=296/12=24.72 | Total Cost |
| Quantity | Calculation | Description |
|---|---|---|
| 156 Therms/Year | 4+5+4+4+4+8+28+34+19+31+10+5=156/12=13 | Total Heating and Water Heater |
| 18.16$/Month | 6+7+5+5+5+11+39+48+27+44+14+7=217.93/12=18.16 | Total Cost |
| 108 Therms/Year | 156-(48 water heater) | Heating Only |
| 14$/Month | 217$ - (4*12=48:water heater) = 169$ / 12 = 14$ | Heating Only Cost |
| 48 Therms/Year | 12*4=48 | Water Heater |
| MPGe | Car | Notes |
|---|---|---|
| 136 | Hundai Ioniq | |
| 128 | Tesla Model 3 | long range model |
| 124 | BMW i3 | |
| 119 | Chevy Bolt | |
| 112 | Nissan Leaf |
My typical driving at the moment is less than 8K miles/year = 21 miles per day. A Tesla Model 3 will go 100 miles on 23.7 kWh. So 23.7 / 100 = .237 kWh per mile * 21 miles = 4.977 or about 5 kWh per day. This means an electric car would double our electricty use.
We used 108 to 142 Therms per year for gas heating. 142 therms = 4146 kWh. 4146 / 12 months = 346 kWh, or 4146 / 365 days = 11.4 kWh per day. Using electrical for all of our heating could triple our electrical use.For the first two years, we kept the house very cold in the winter, so did not use much electricty for heating, but it was a bit painful. In September of 2020, we purchased a heat pump, which is supposedly 2 to 3 times more efficient than a plain electric heater. I am expecting it to be fairly efficient since our climate is pretty mild.
You can skip this section to use the online caclulator described below in Solar System Size or us this calculator https://pvwatts.nrel.gov. This section gives a little more information about the details of a calculator and what is important for roof angles, and your location.You can find sun angles for your location from different web sites such as https://www.esrl.noaa.gov/gmd/grad/solcalc/azel.html or http://solarelectricityhandbook.com/solar-angle-calculator.html. My winter angle is about 60 degrees from horizontal and the summer angle is about 25 degrees. My roof pitch is 18.43 degrees. The solar panels I was investigating were about 18.6% efficient. The solar declination for my location was about 23 degrees. Putting on a north roof drops efficiency by about 34% and subtract another 7% for roof azimuth angle.
There are a few ways to figure out peak sun hours. There is a calculator here where you can enter your zip code. https://tyconsystems.com/html/nrel_lookup.htm. For my location, I got, Dec = 3.72, Jul = 7.32. So the average of the two is 3.72+7.32/2 = .552
Another way is to use https://solarenergylocal.com and use a map to select location. For summer I got 7.02 and for winter 3.62, so the average is 3.62+7.02/2 = .532
This site shows the roof angle information. https://www.civicsolar.com/support/installer/articles/calculating-your-optimal-azimuth-angle
For my location, it seels like the efficiency is about 1/2 the total during winter, and another 10% lower for azimuth and roof angle. Actual measurements so far seems like it is about 1/3 the total during winter. This also matches the nrel.gov site.
| kWh | System | Calculation |
|---|---|---|
| 195 | Base use (home only, no heating or car) | 6.3 kWh per day * 31 days |
| 541 | Base use with heating | 195 kWh + 346 kWh |
| 696 | Base use with heating and car | 541 kWh + (5 kWh * 31 days) |
| System Size | Panels | System | Calculation |
|---|---|---|---|
| 149 kWh | 4 270W panels | Partial base use, no car, no heating | 2497$ for 1.08kW / (148/186=.8*471=375) = 6.6 years |
| 316 kWh | 8 290W panels | Base use, no car, no heating | 4728$ for 2.32 kW/265$ = 18 Years |
| 447 kWh | 12 270W panels | Partial base use with heating | 5619$ for 3.24kW kW/(265+206=471$) = 12 years |
| 475 kWh | 12 290W panels | Base use with heating | 6355$ for 3.48kW / (265+206=471$) = 13.5 years |
Notes about the system size:
- For the 475 kWh numbers, 290 * 12 = 3480 so these must be peak numbers.
- PTC numbers can be looked up at https://www.gosolarcalifornia.org/equipment/documents/PV_Module_List_Simplified_Data.xlsx
- PTC=266.3 * 95% inverter = 252.98 * 12 panels = 3.035 CEC-AC
- 3.035 CEC-AC * 5.84 peak sun hours = 17.7kWh/day = 17.7 * 31 days = 548.7 kWh
- These numbers are a bit off from their web site numbers, so perhaps they added in roof pitch or something.
- The payoff numbers are a bit off from my actual use since I originally used different base use numbers due to the fact that I didn't have the complete use numbers at the time.
- I used the following to calculate electrical costs, 6kWh * .15 = 0.9$ per day = 328$ per year. This was a bit off since my actual electrical cost for the full year was 217$.
| Year | Percent |
|---|---|
| 2018 | 30 |
| 2019 | 30 |
| 2020 | 26 |
| 2021 | 22 |
| 2022 | 10 |
| System Type | Description |
|---|---|
| Minimal | I believe this ties all of the panels together. If a single panel has sun blockage, then output from other panels can also be reduced. |
| Power Optimizer | This is a small box at each panel that communicates with the main inverter to optimize the DC voltage for each panel to send to the inverter. This system is very safe and easy to install since there is no output if it is not connected to the inverter. It actually outputs a low 1V output for each panel so it is easy to see how many panels are connected correctly. |
| Micro Inverter | This is a small box at each panel that converts the DC to AC so that no main inverter is needed. This is typically higher cost since many small micro inverters are more expensive than a single large inverter. |
| With Storage | I don't think this system was available at the time that I purchased a system. |
I ended up picking the 447 kWh (3.24kW) system with power optimizers because I have a tree and fireplace that could block output from some panels. The panels are rated at 80% output at 25 years. I will redo the system payoff calculations later since the total system cost is higher than shown here.
With this system, we plan to use a very small amount of electricity in the summer, and generate a lot. So there is no way for us to save it in batteries. Plus I am not sure if there is a way to not be connected to the grid partly for fire safety reasons. The city/county seem to have a goal that if the utility goes off, so does your solar, then if there is a fire, the firefighters won't get shocked. This also makes it very easy to install some systems (like the one I got) since there is no electrical on the system (except right at the panels) when you install it.
We will generate excess electricity in the summer that goes back to the grid, then use a lot in the winter for heating. So the excess in the summer goes towards other people's AC units, which can still reduce the amount of utility plant generation even if we aren't using it.
I originally started making the plans on my own. In my case the city controls solar permits and the city requires the following:- A drawing of the plot of land and house showing the solar panels
- Electrical diagrams and codes that show the solar system from the main junction box to the panels
- How the system attaches to the rafters
- The manufacture information about all of the solar hardware including racks, footings, inverter, panel, grounding parts, etc.
For this reason, I decided to purchase plans from Wholesale Solar. The plans cost about 1000$. They allowed a deal where I could pay 15% of the system plus the plan cost, and then pay the total solar system cost later after plans were completed and passes local permitting rules through city.
There were a few mistakes and adjustments made to the plans.
- I was originally thinking I would put panels only on the southwest roof. Their plans shows panels on the southwest, southeast, and northeast. This would make the install more difficult. They put some on the northeast because they assumed we had a tree that would block a lot of solar. I told them we were going to trim the tree since much of it was dead. They changed the plans according to my request. The fact that they had solar on the southeast was better than my plans, so I am glad that they calculated better than I did. They subcontracted out the calculations to https://www.brightharvestsolar.com/. These plans were pretty nice because they showed the maximum number of panels that could go on the house and the estimated relational efficiency of the panels including shading from trees. It might have been nice to also have a more unshaded information.
- There were a few incorrect measurements for panel location on the roof. This mistake was not on the Bright Harvest drawings. I also originally sent in some drawings with correct measurements, so I am not sure why their measurements were wrong. In any case, it helped to know the fire code walkway information so that I could install the panels correctly.
- They also shipped fewer footer connectors than were shown on the plans. I checked the manufacturing information about the racks to check what the longest span can be without footer connectors, and verified that I did not need as many as were shown on the diagrams.
- Even after the revised plans, there were three holes for conduit in the roof when only two were necessary. I called Wholesale Solar and they verified that only two were necessary.
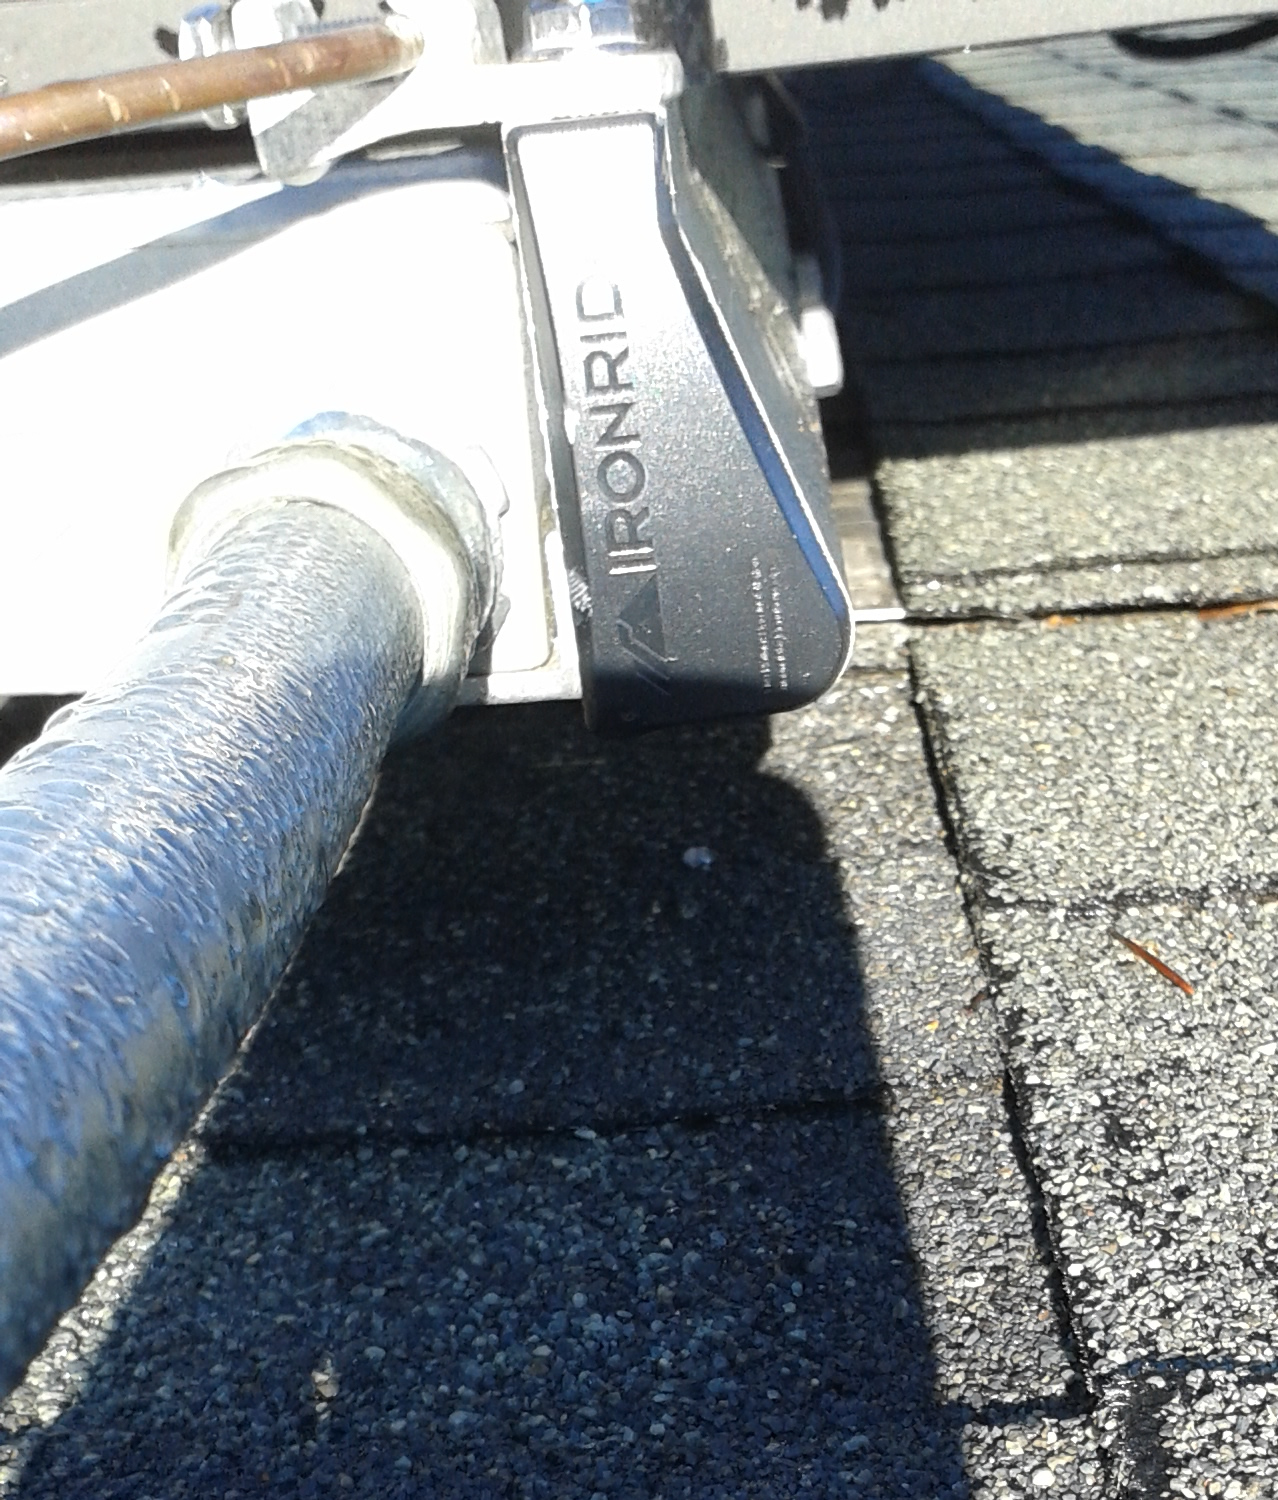
The IronRidge racking system gives two dimensions of adjustment, so it was not that critical where the feet are mounted. Overall the mounting system seems to work very well. The racks are aluminum and serve as a ground from the panels. Then a ground wire must be run all the way to the inverter. The bolts have a system so that they connect to the rack slots when the bolts are rotated. There is no need for finding holes, or sliding parts from the ends of the slots.
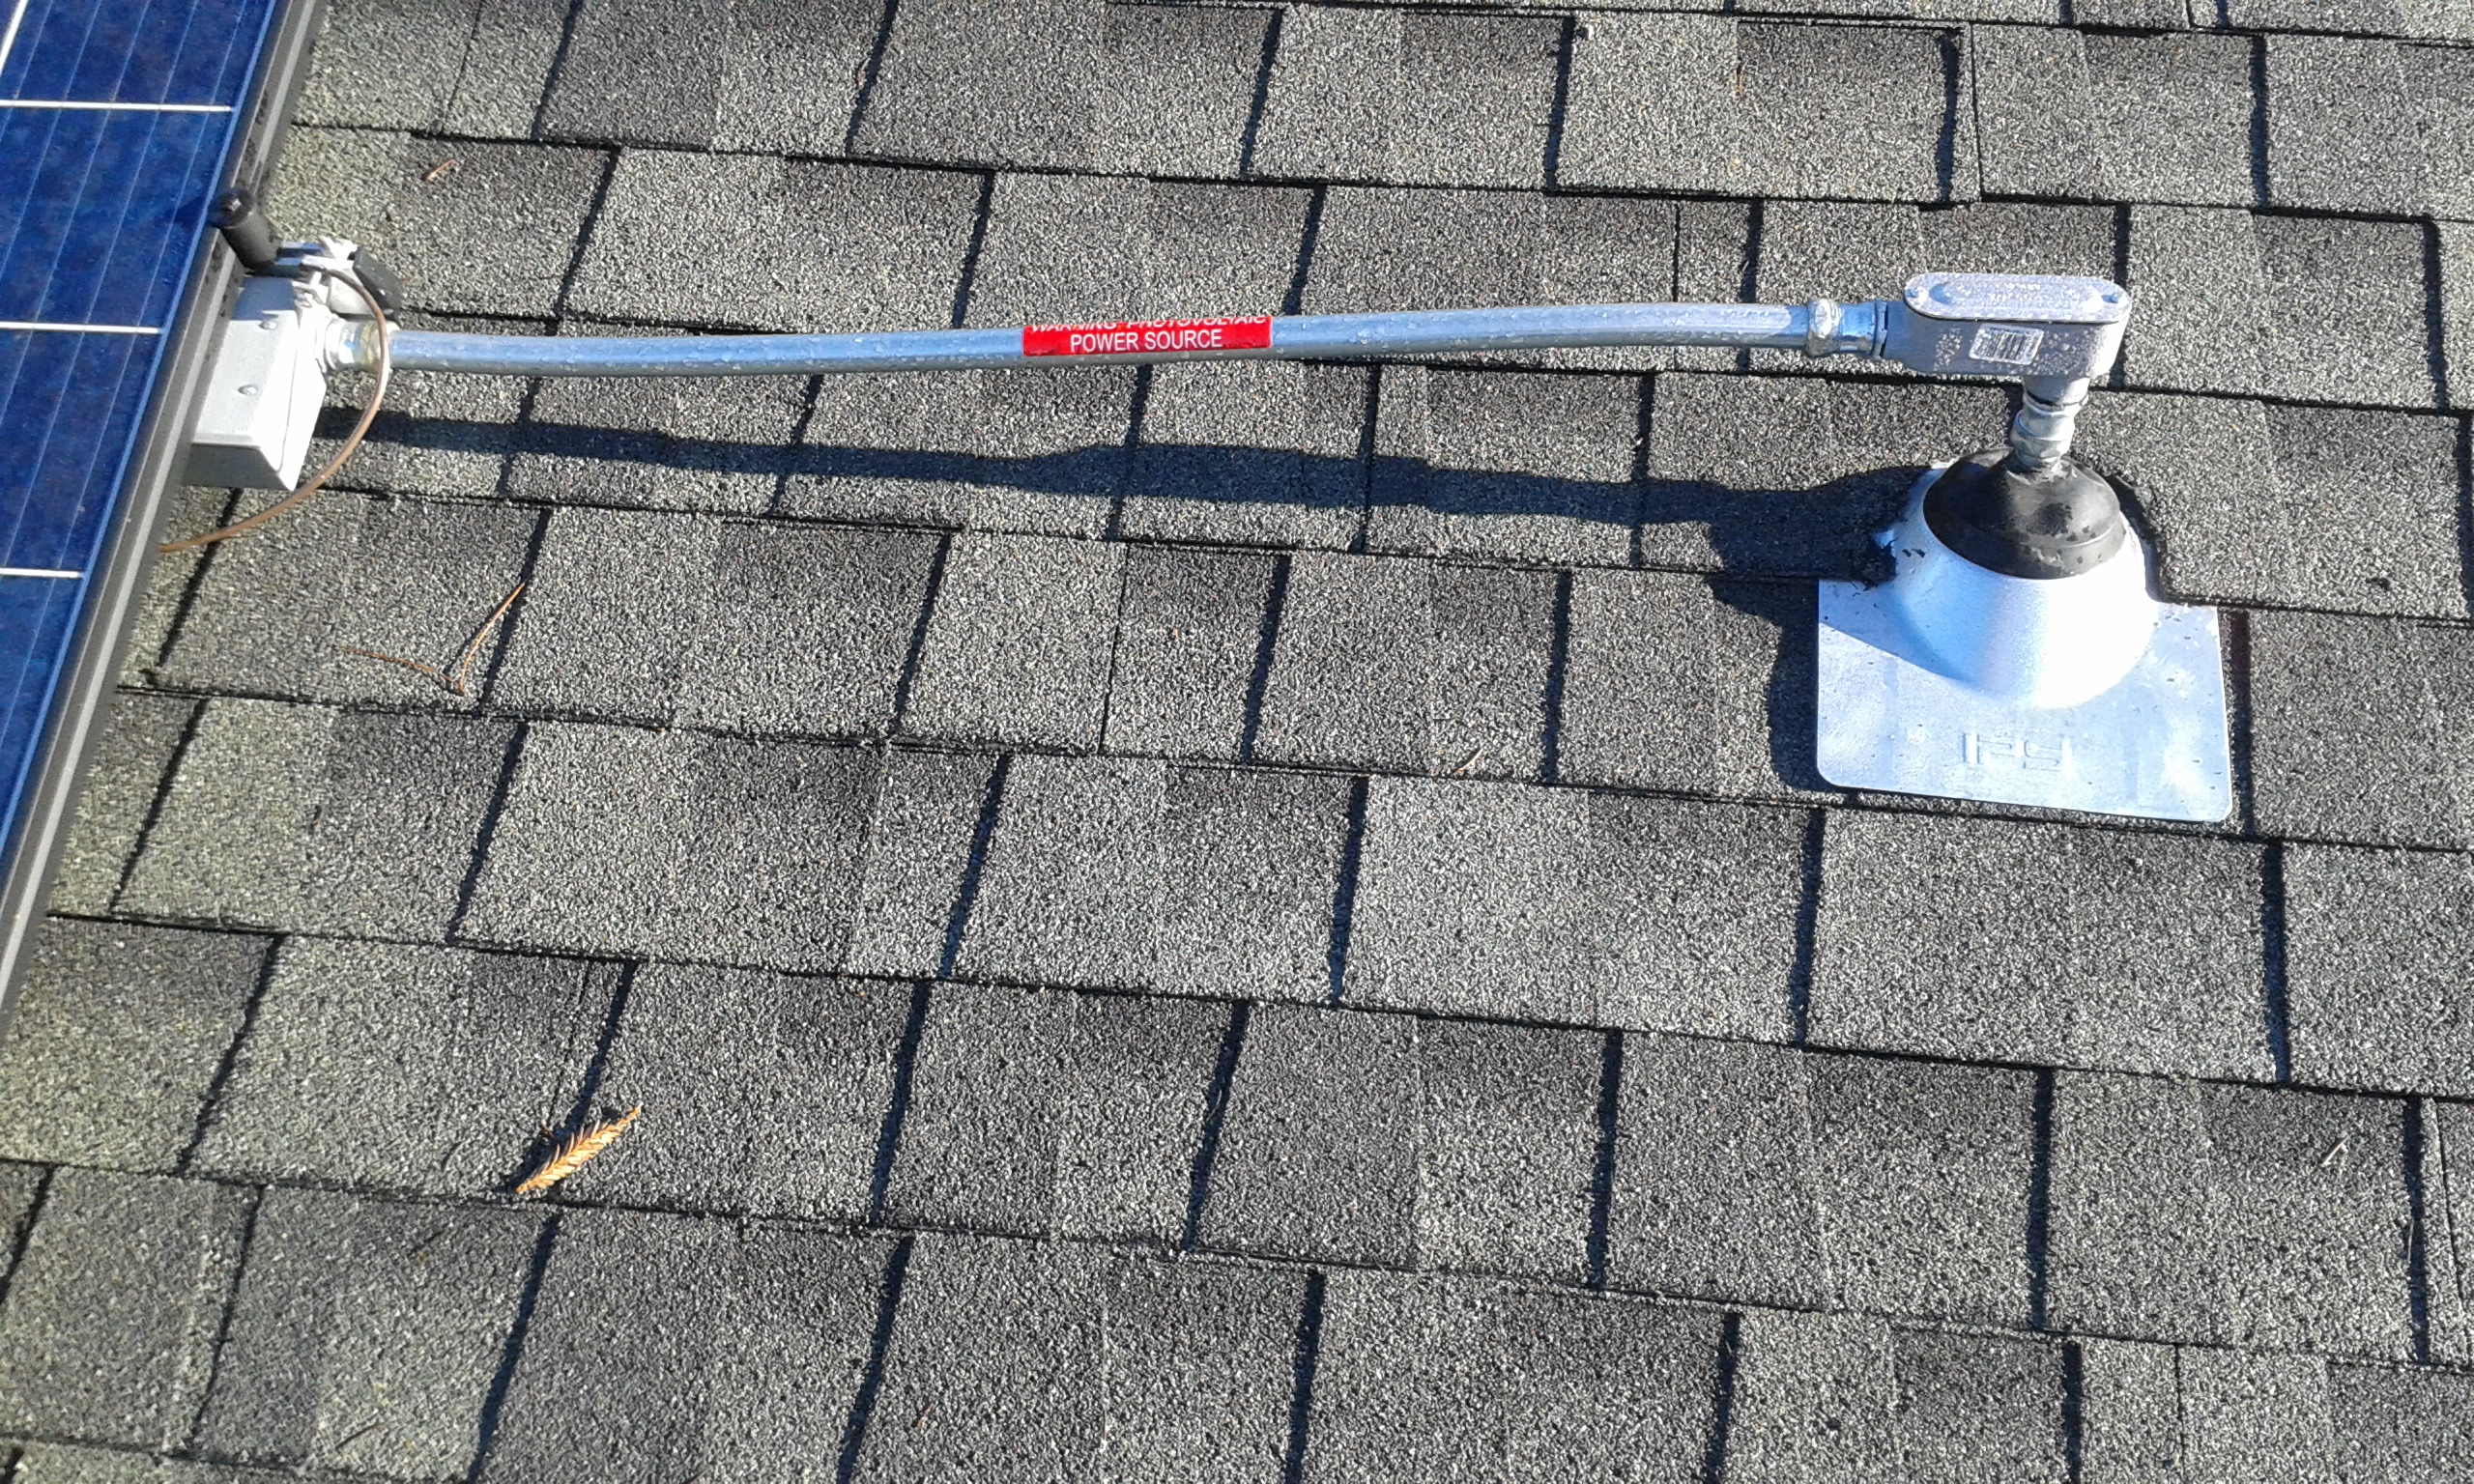
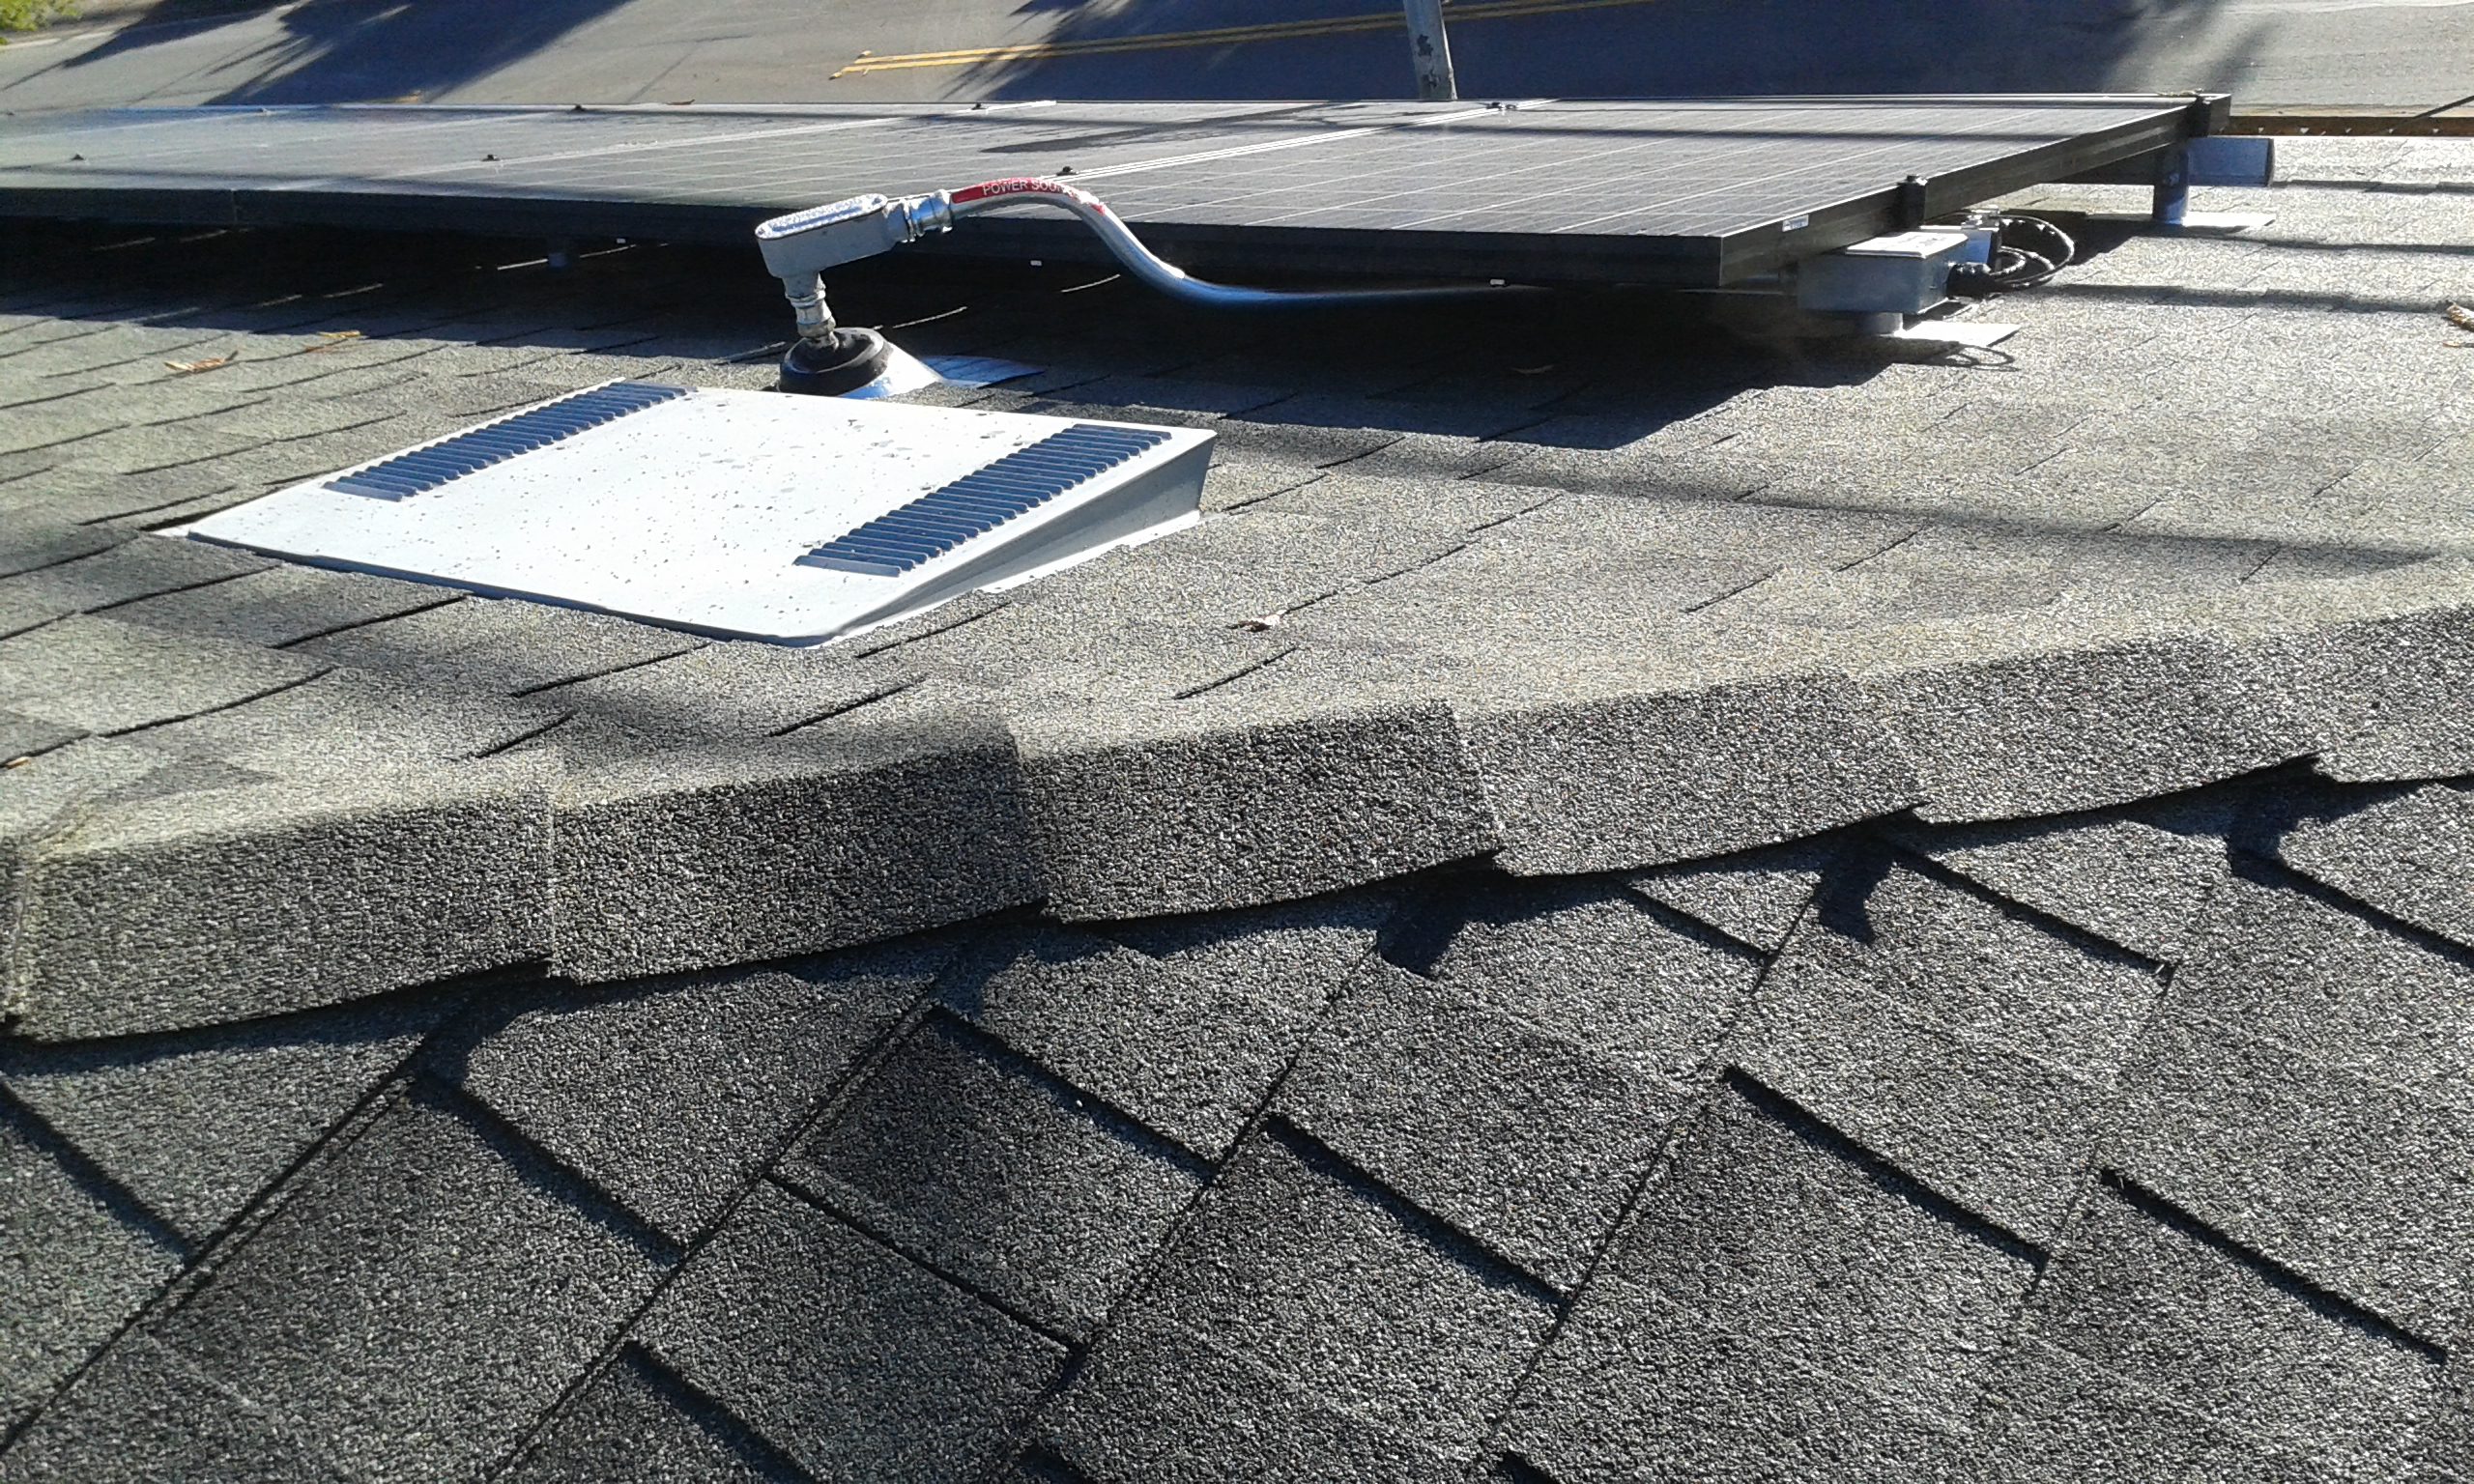
I debated whether to mount the conduit penetration point through the roof closer to the solar panels. It might look strange, but the hole in the roof for the conduit is in the location in the picture because that is where the garage wall is. I could have gone through the garage wall, but it would have been much more difficult because the attic is tricky with beams and the sloped ceiling. The conduit is run with a hair over the 3 feet maximum distance without support, but the inspector didn't say anything.
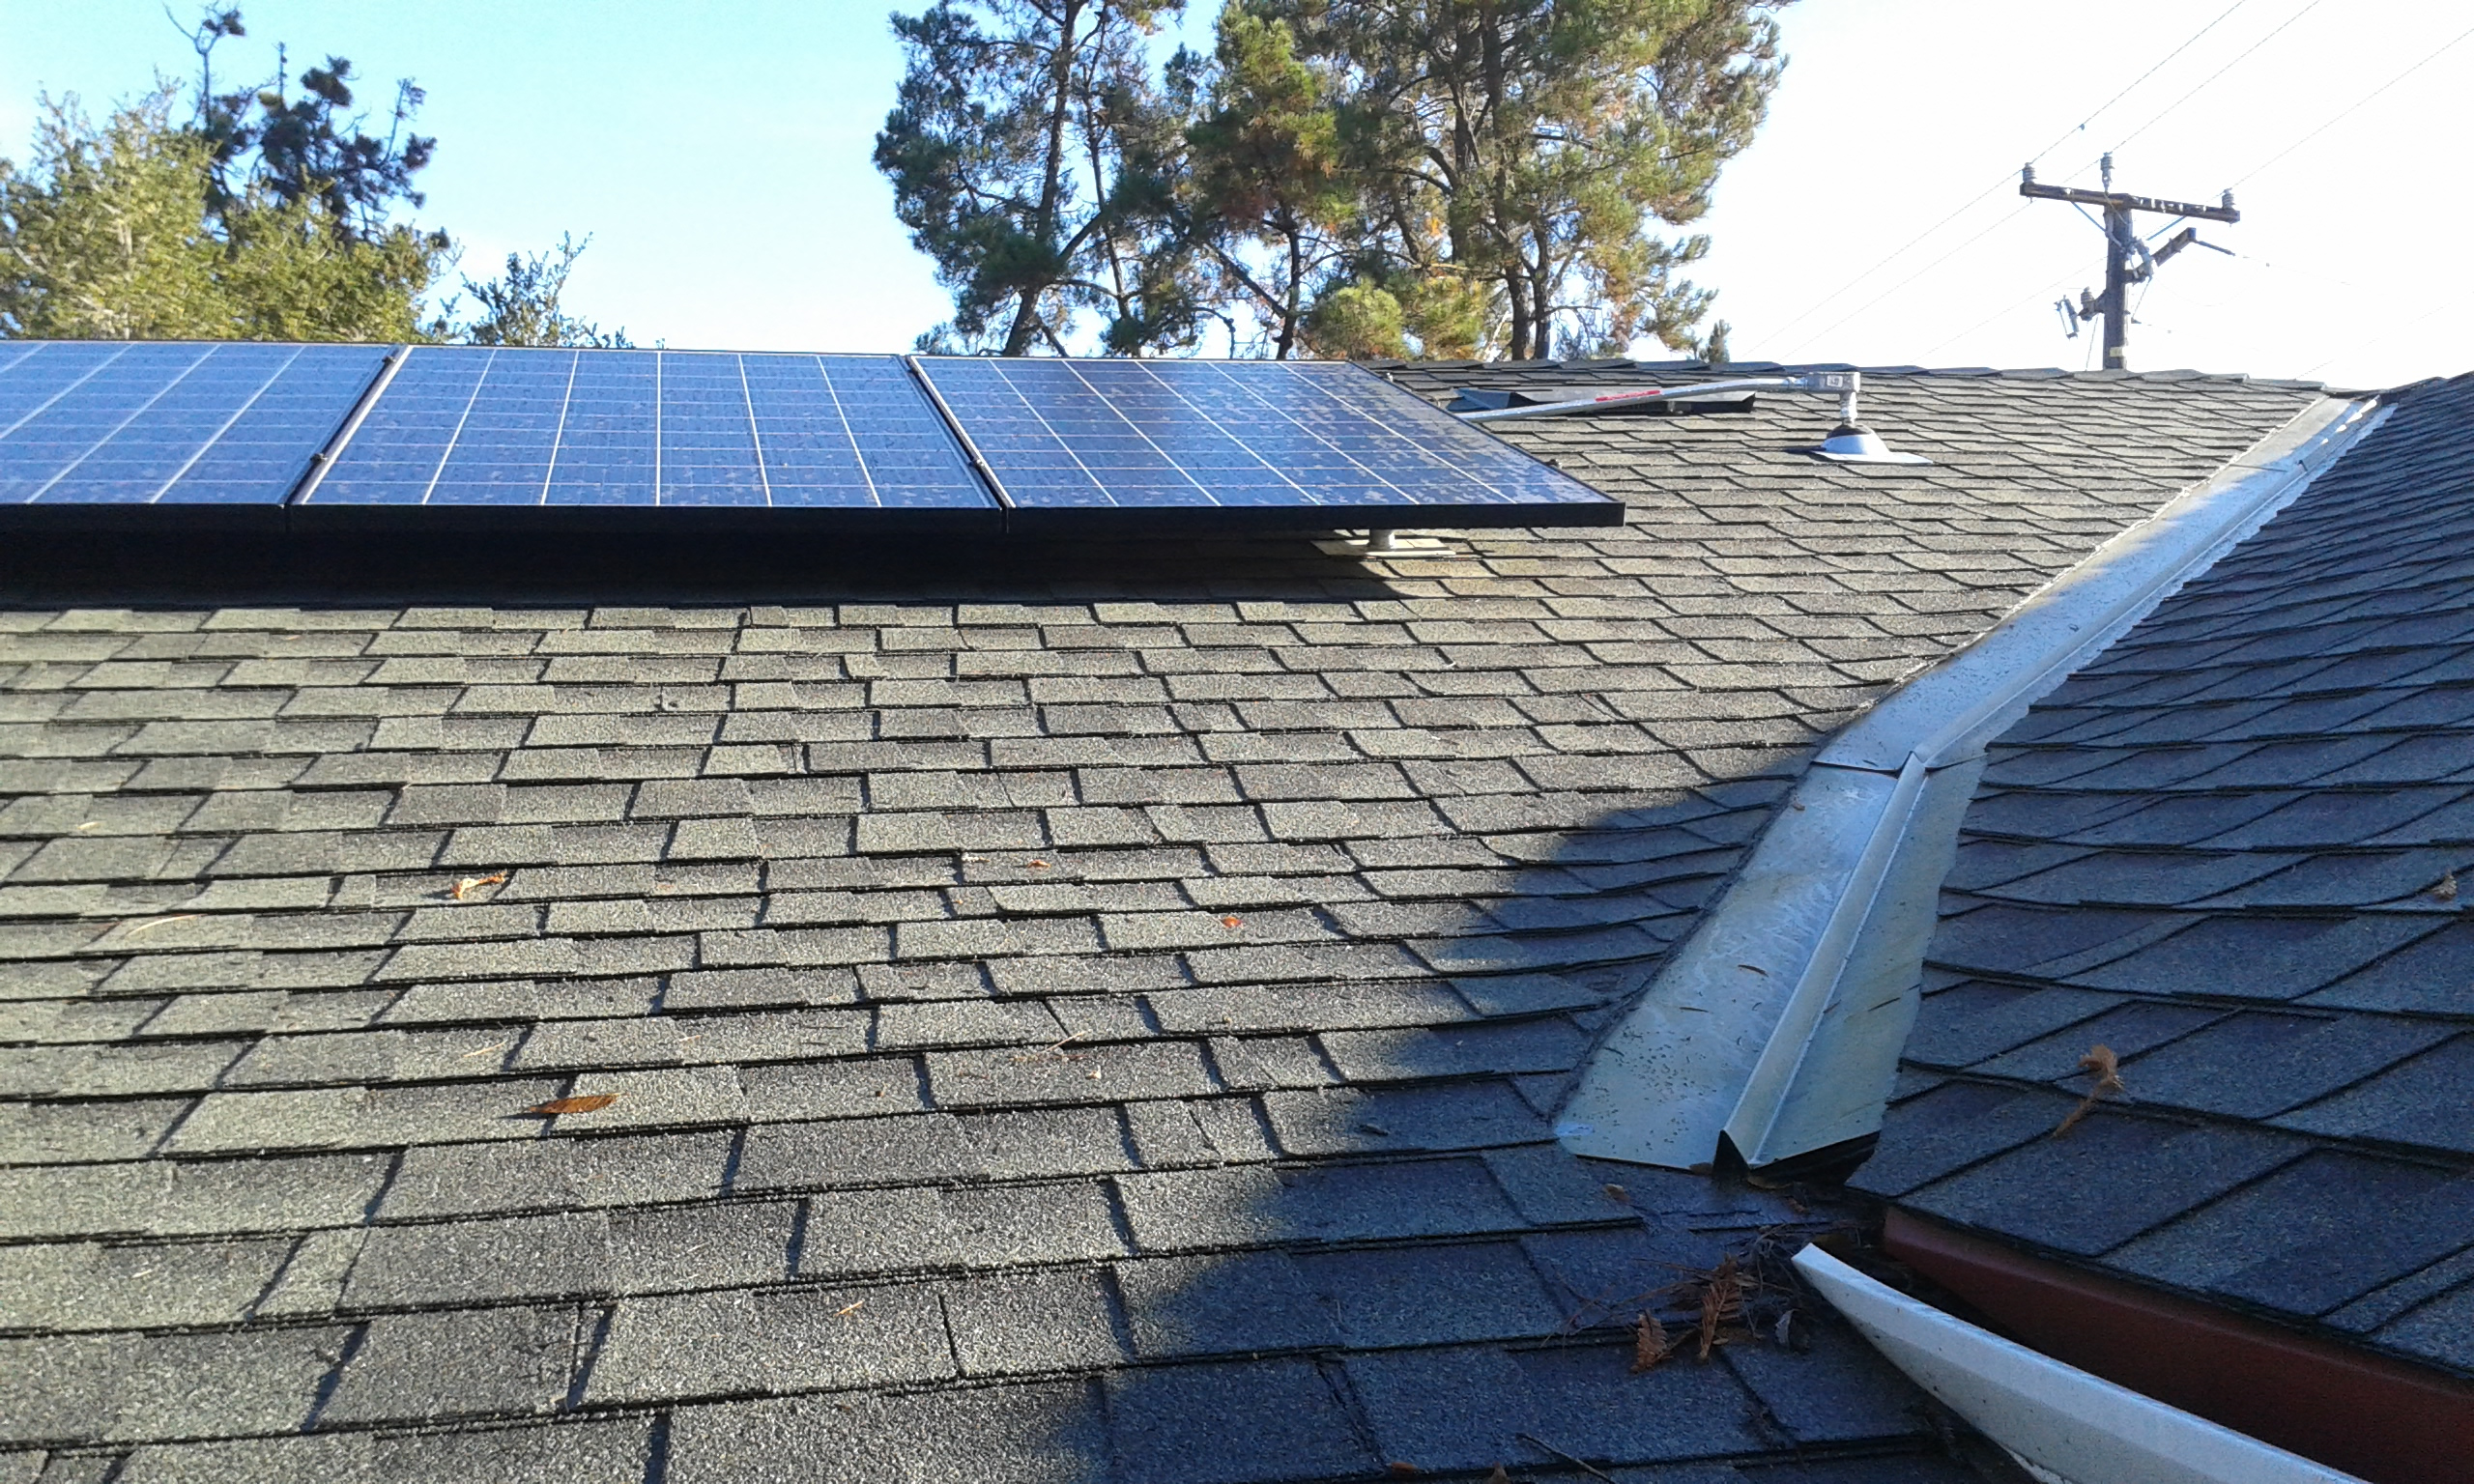 One thing to remember to do is to record the serial numbers of each power optimizer. This may be useful in the future to determine where a poorly performing panel is. The inverter company does not make the information available easily, but there may be software available on the net that allows doing some of this.
The following links show quite a bit of the rack information.
- https://www.quickmountpv.com/support/videos/conduit-penetration-install.html
- https://www.youtube.com/watch?v=5a2mc-LrQlY
- https://www.wholesalesolar.com/6913221/ironridge/racking/ironridge-xr100-option-d-racks-per-65-x-39-module-inc-grounding#downloads
- https://www.youtube.com/watch?time_continue=57&v=hkT2fVZ9C5g
- se_power_optimizers_installation_guide.pdf
I think the connector I purchased was something like this. https://www.amazon.com/Liquid-Tight-Strain-Relief-Cord/dp/B071S7G2K6/ref=sr_1_7?ie=UTF8&qid=1543171969&sr=8-7&keywords=heyco+cord+grip
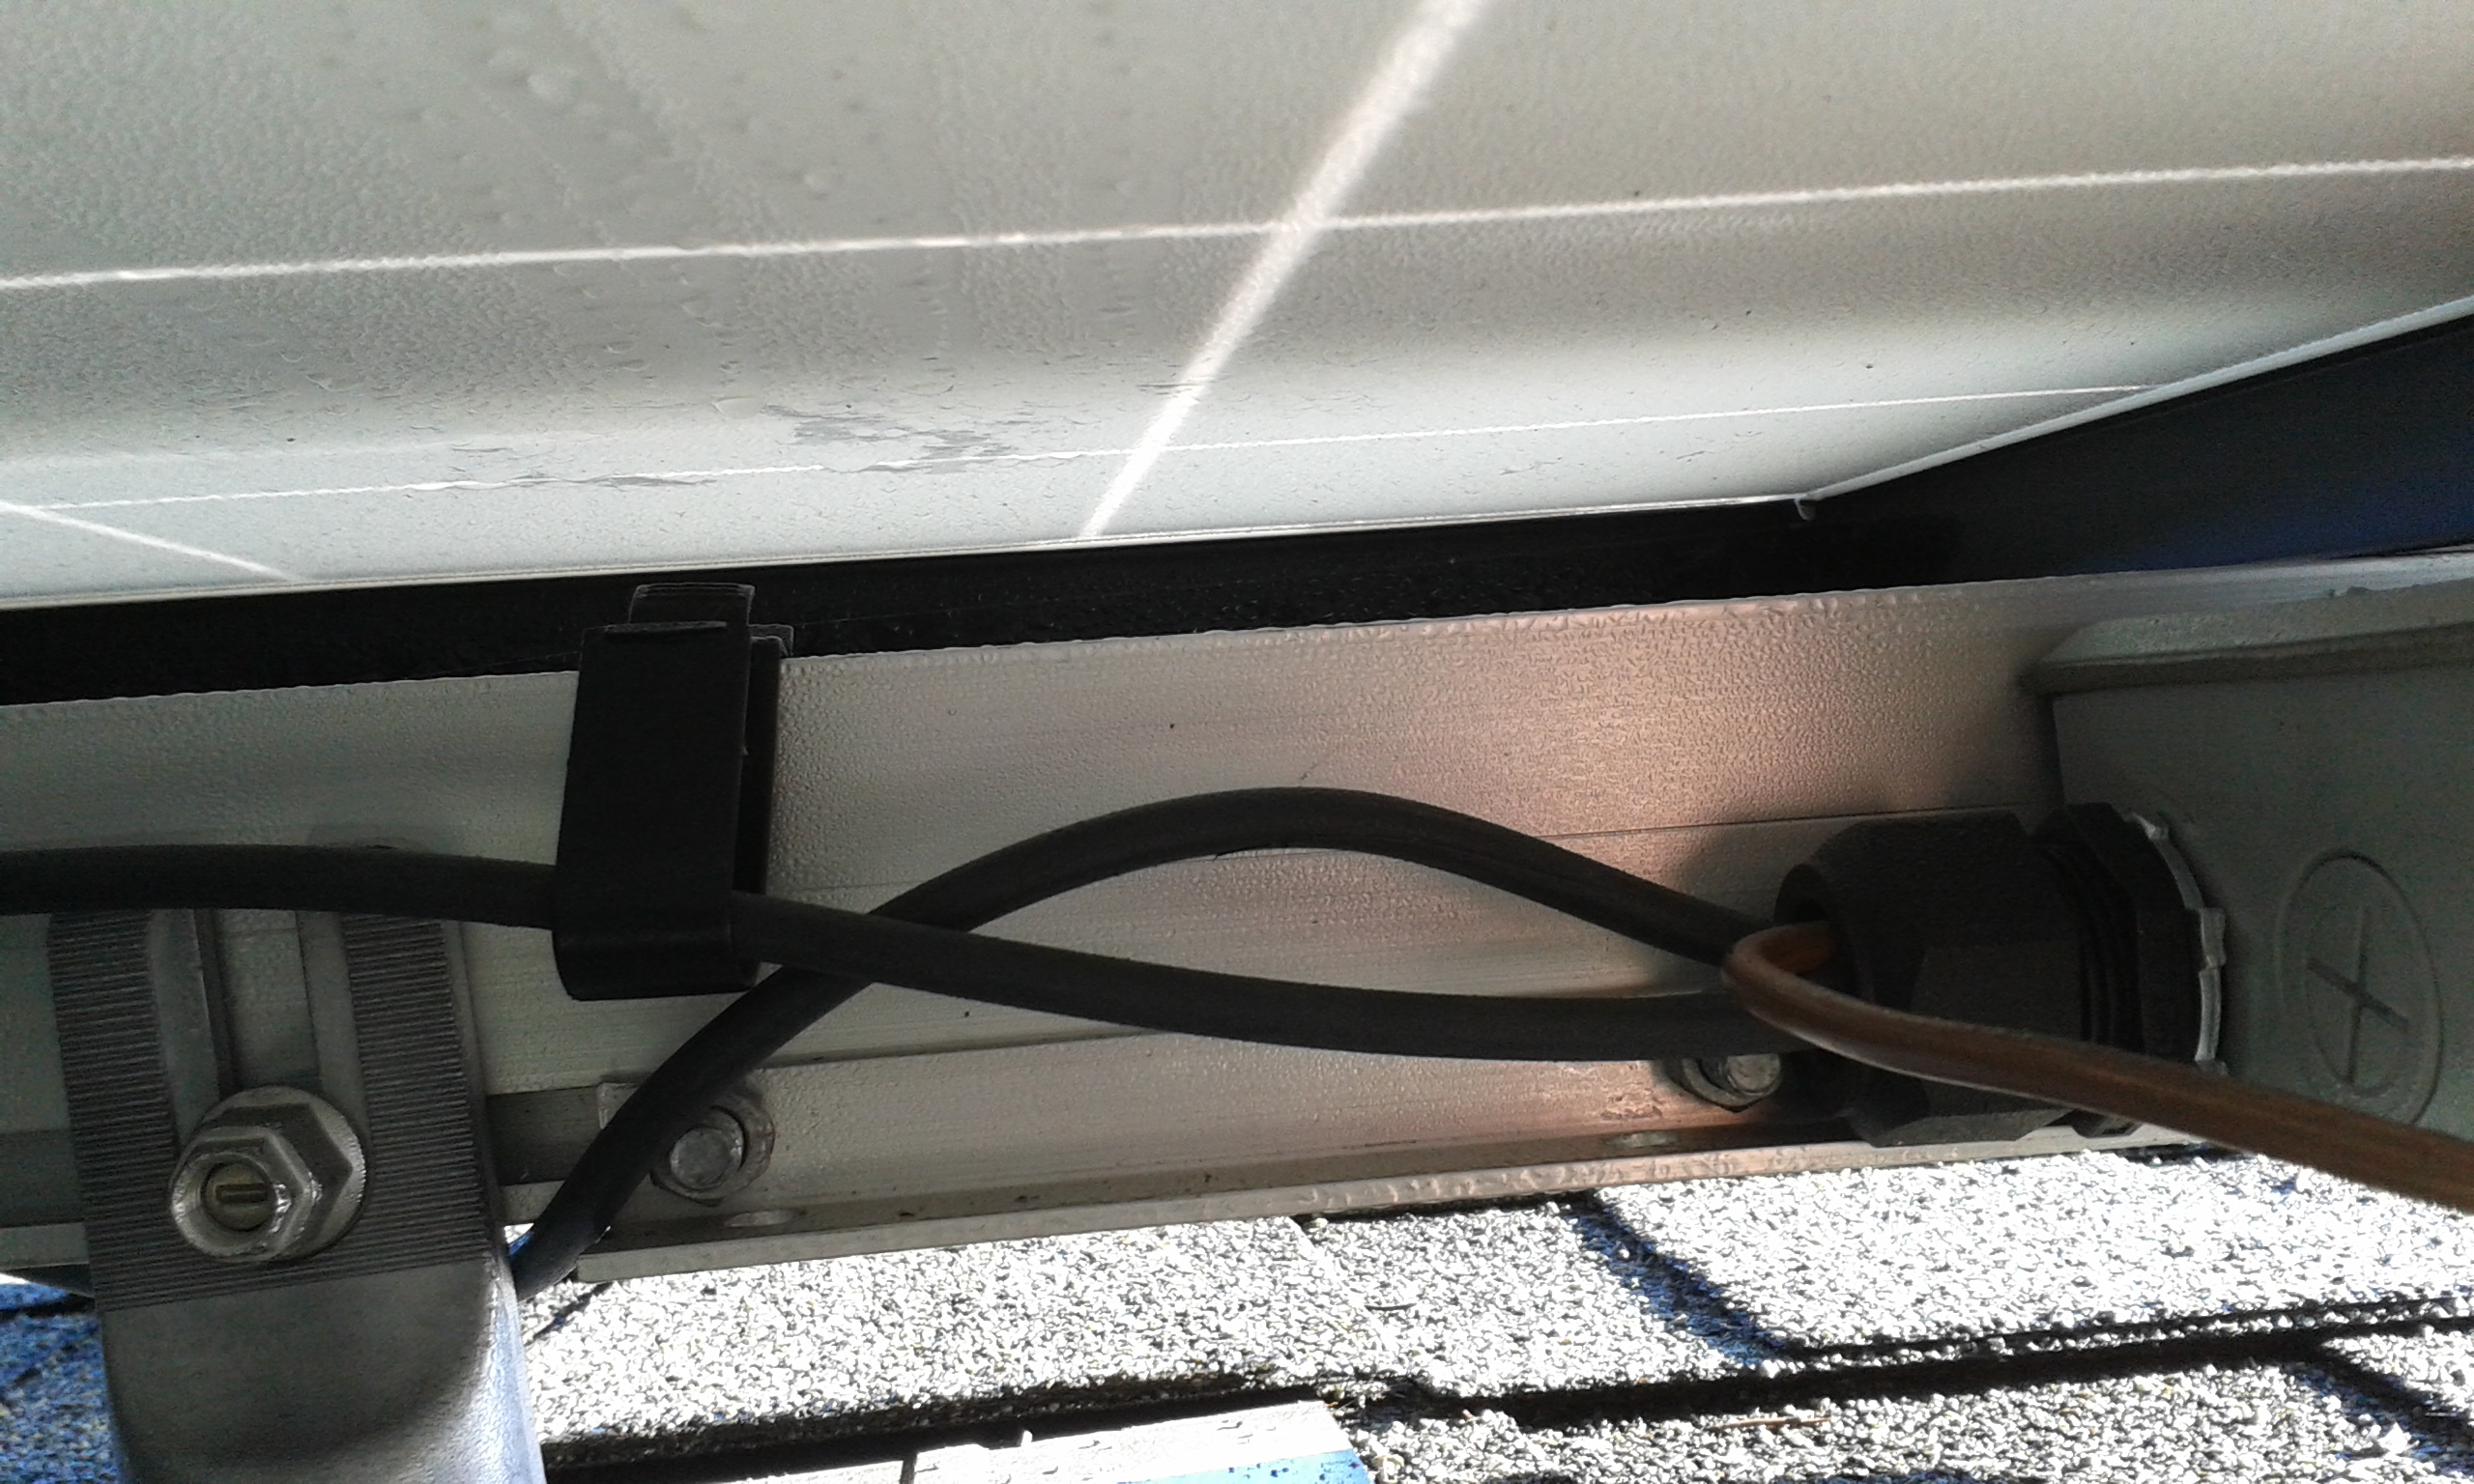 I kept some slack wire under the panels in the case that things have to be adjusted, or perhaps for adding more panels in the future. The wiring must be kept off of the roof so that the wind doesn't cause rubbing between the shingles and cable jacket. I used the cable mounts that come with the kit, and also separately purchased some cable ties, which made it quite a bit easier.
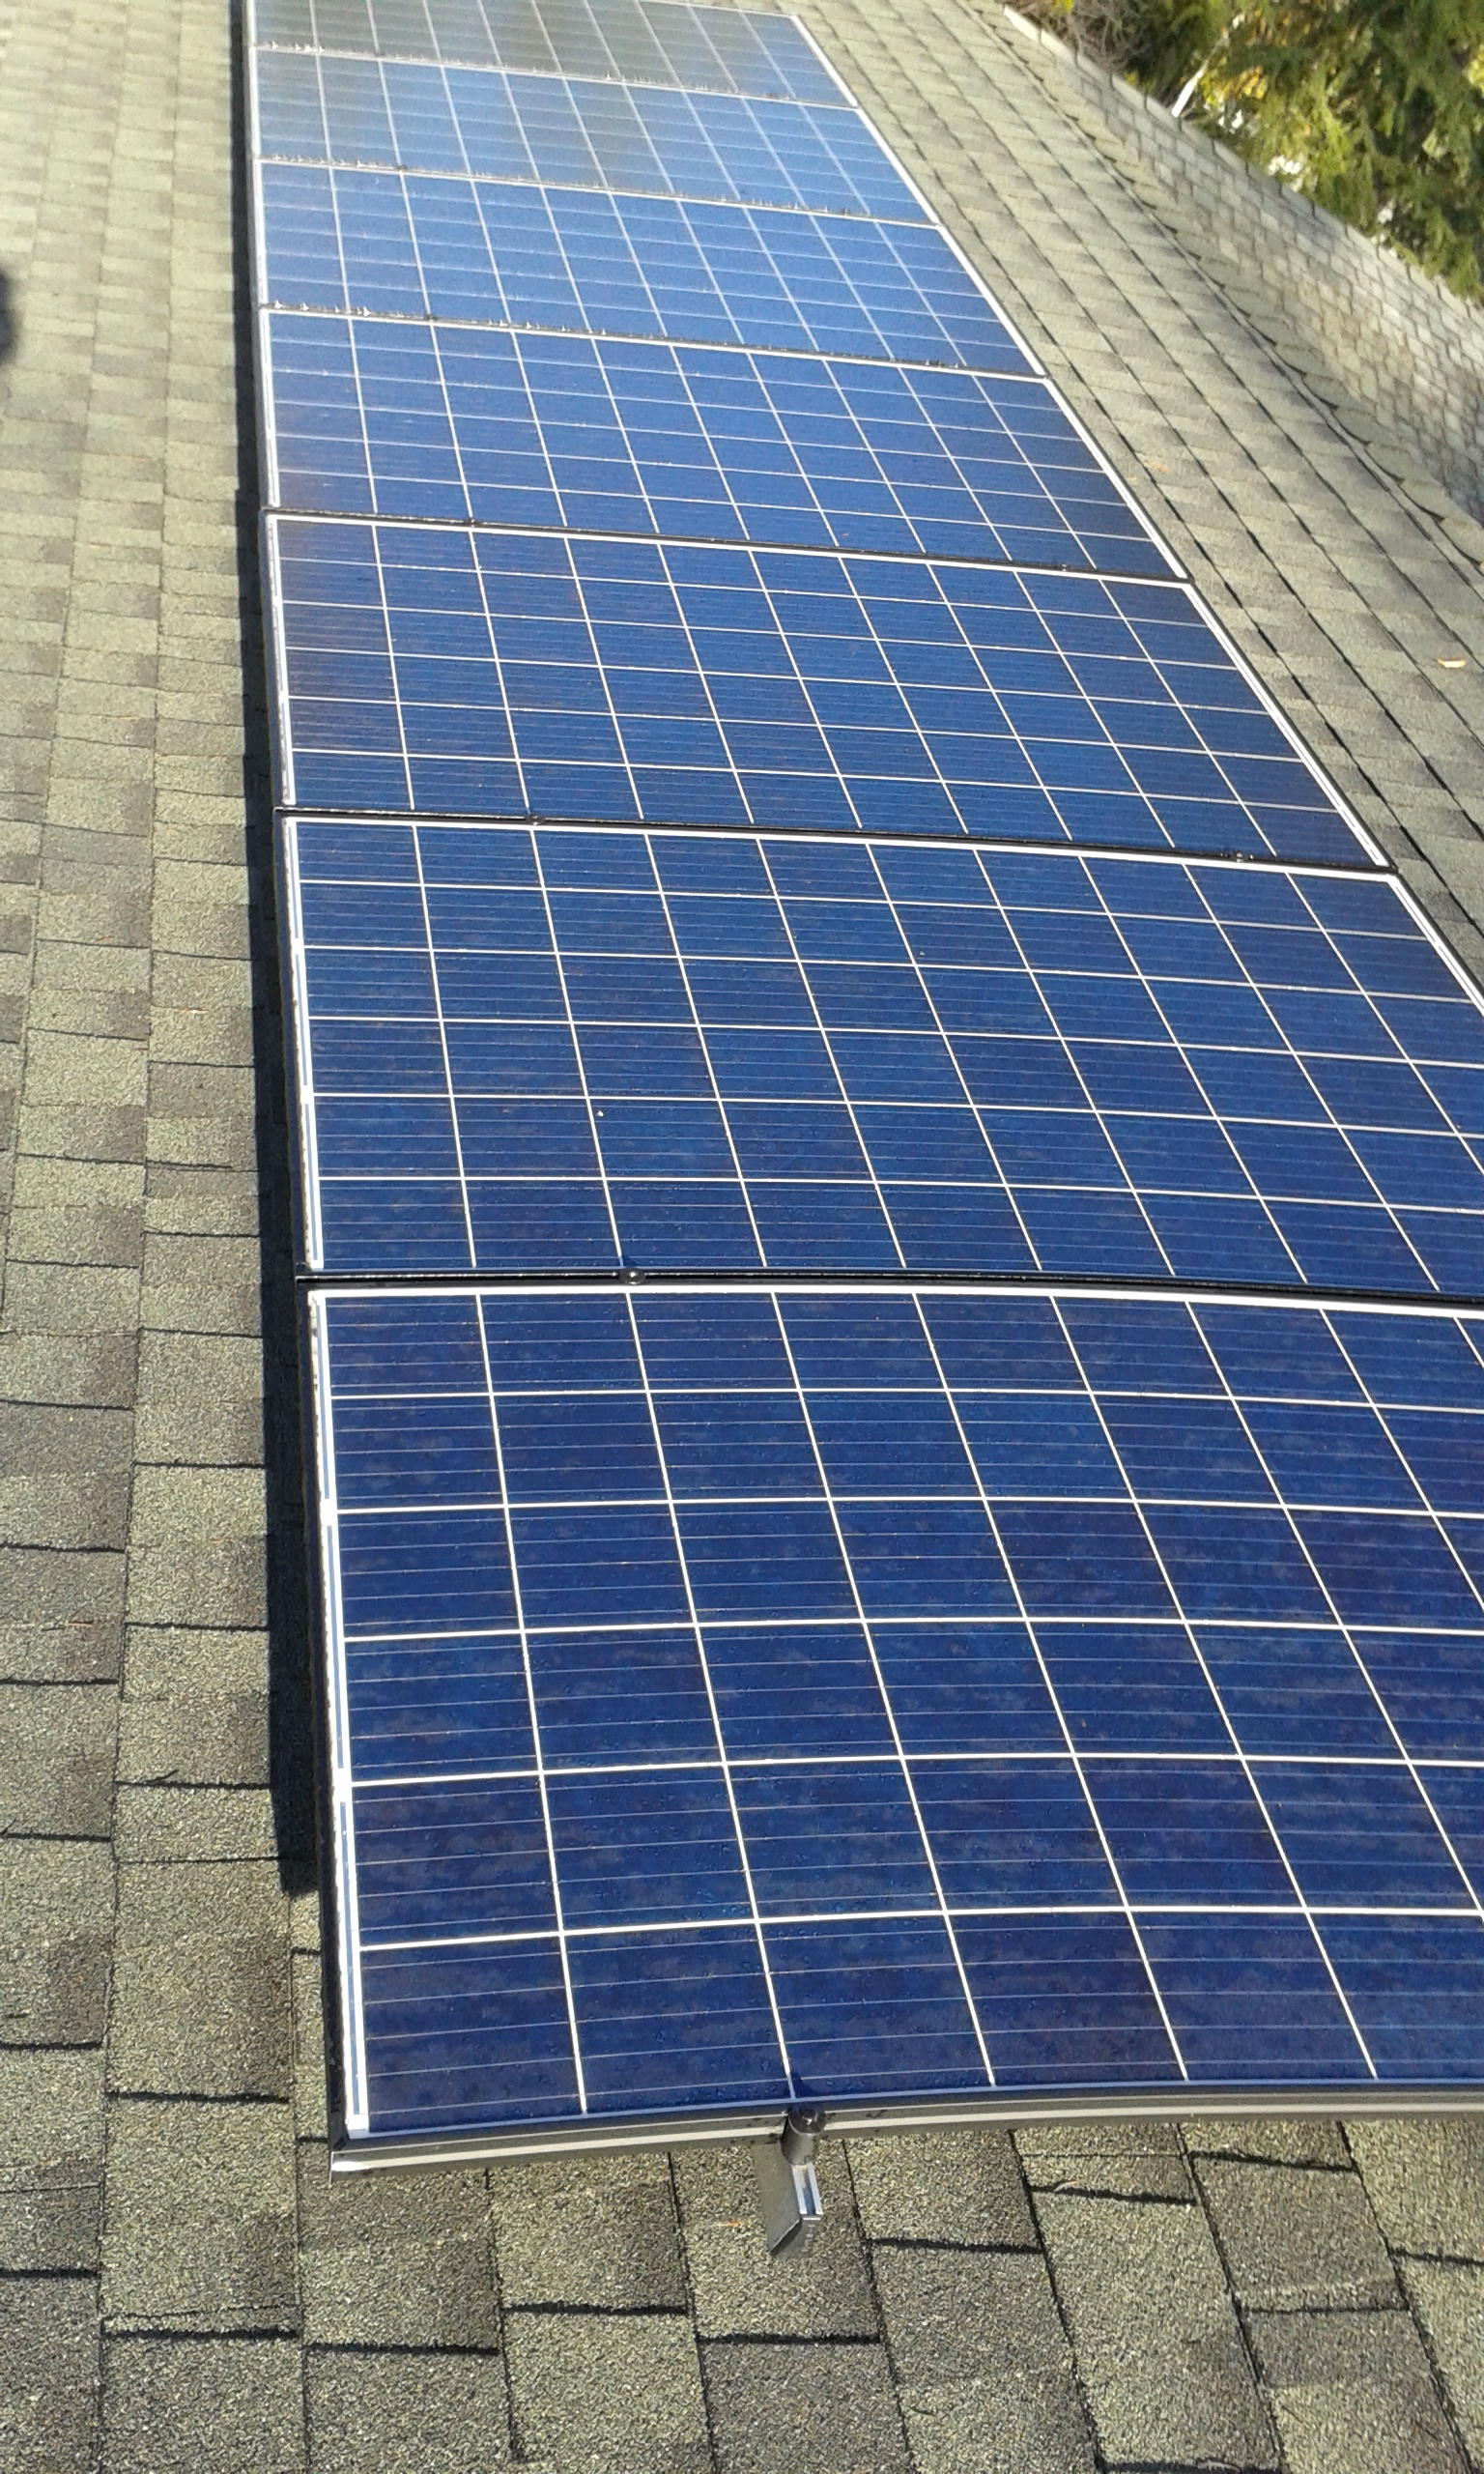
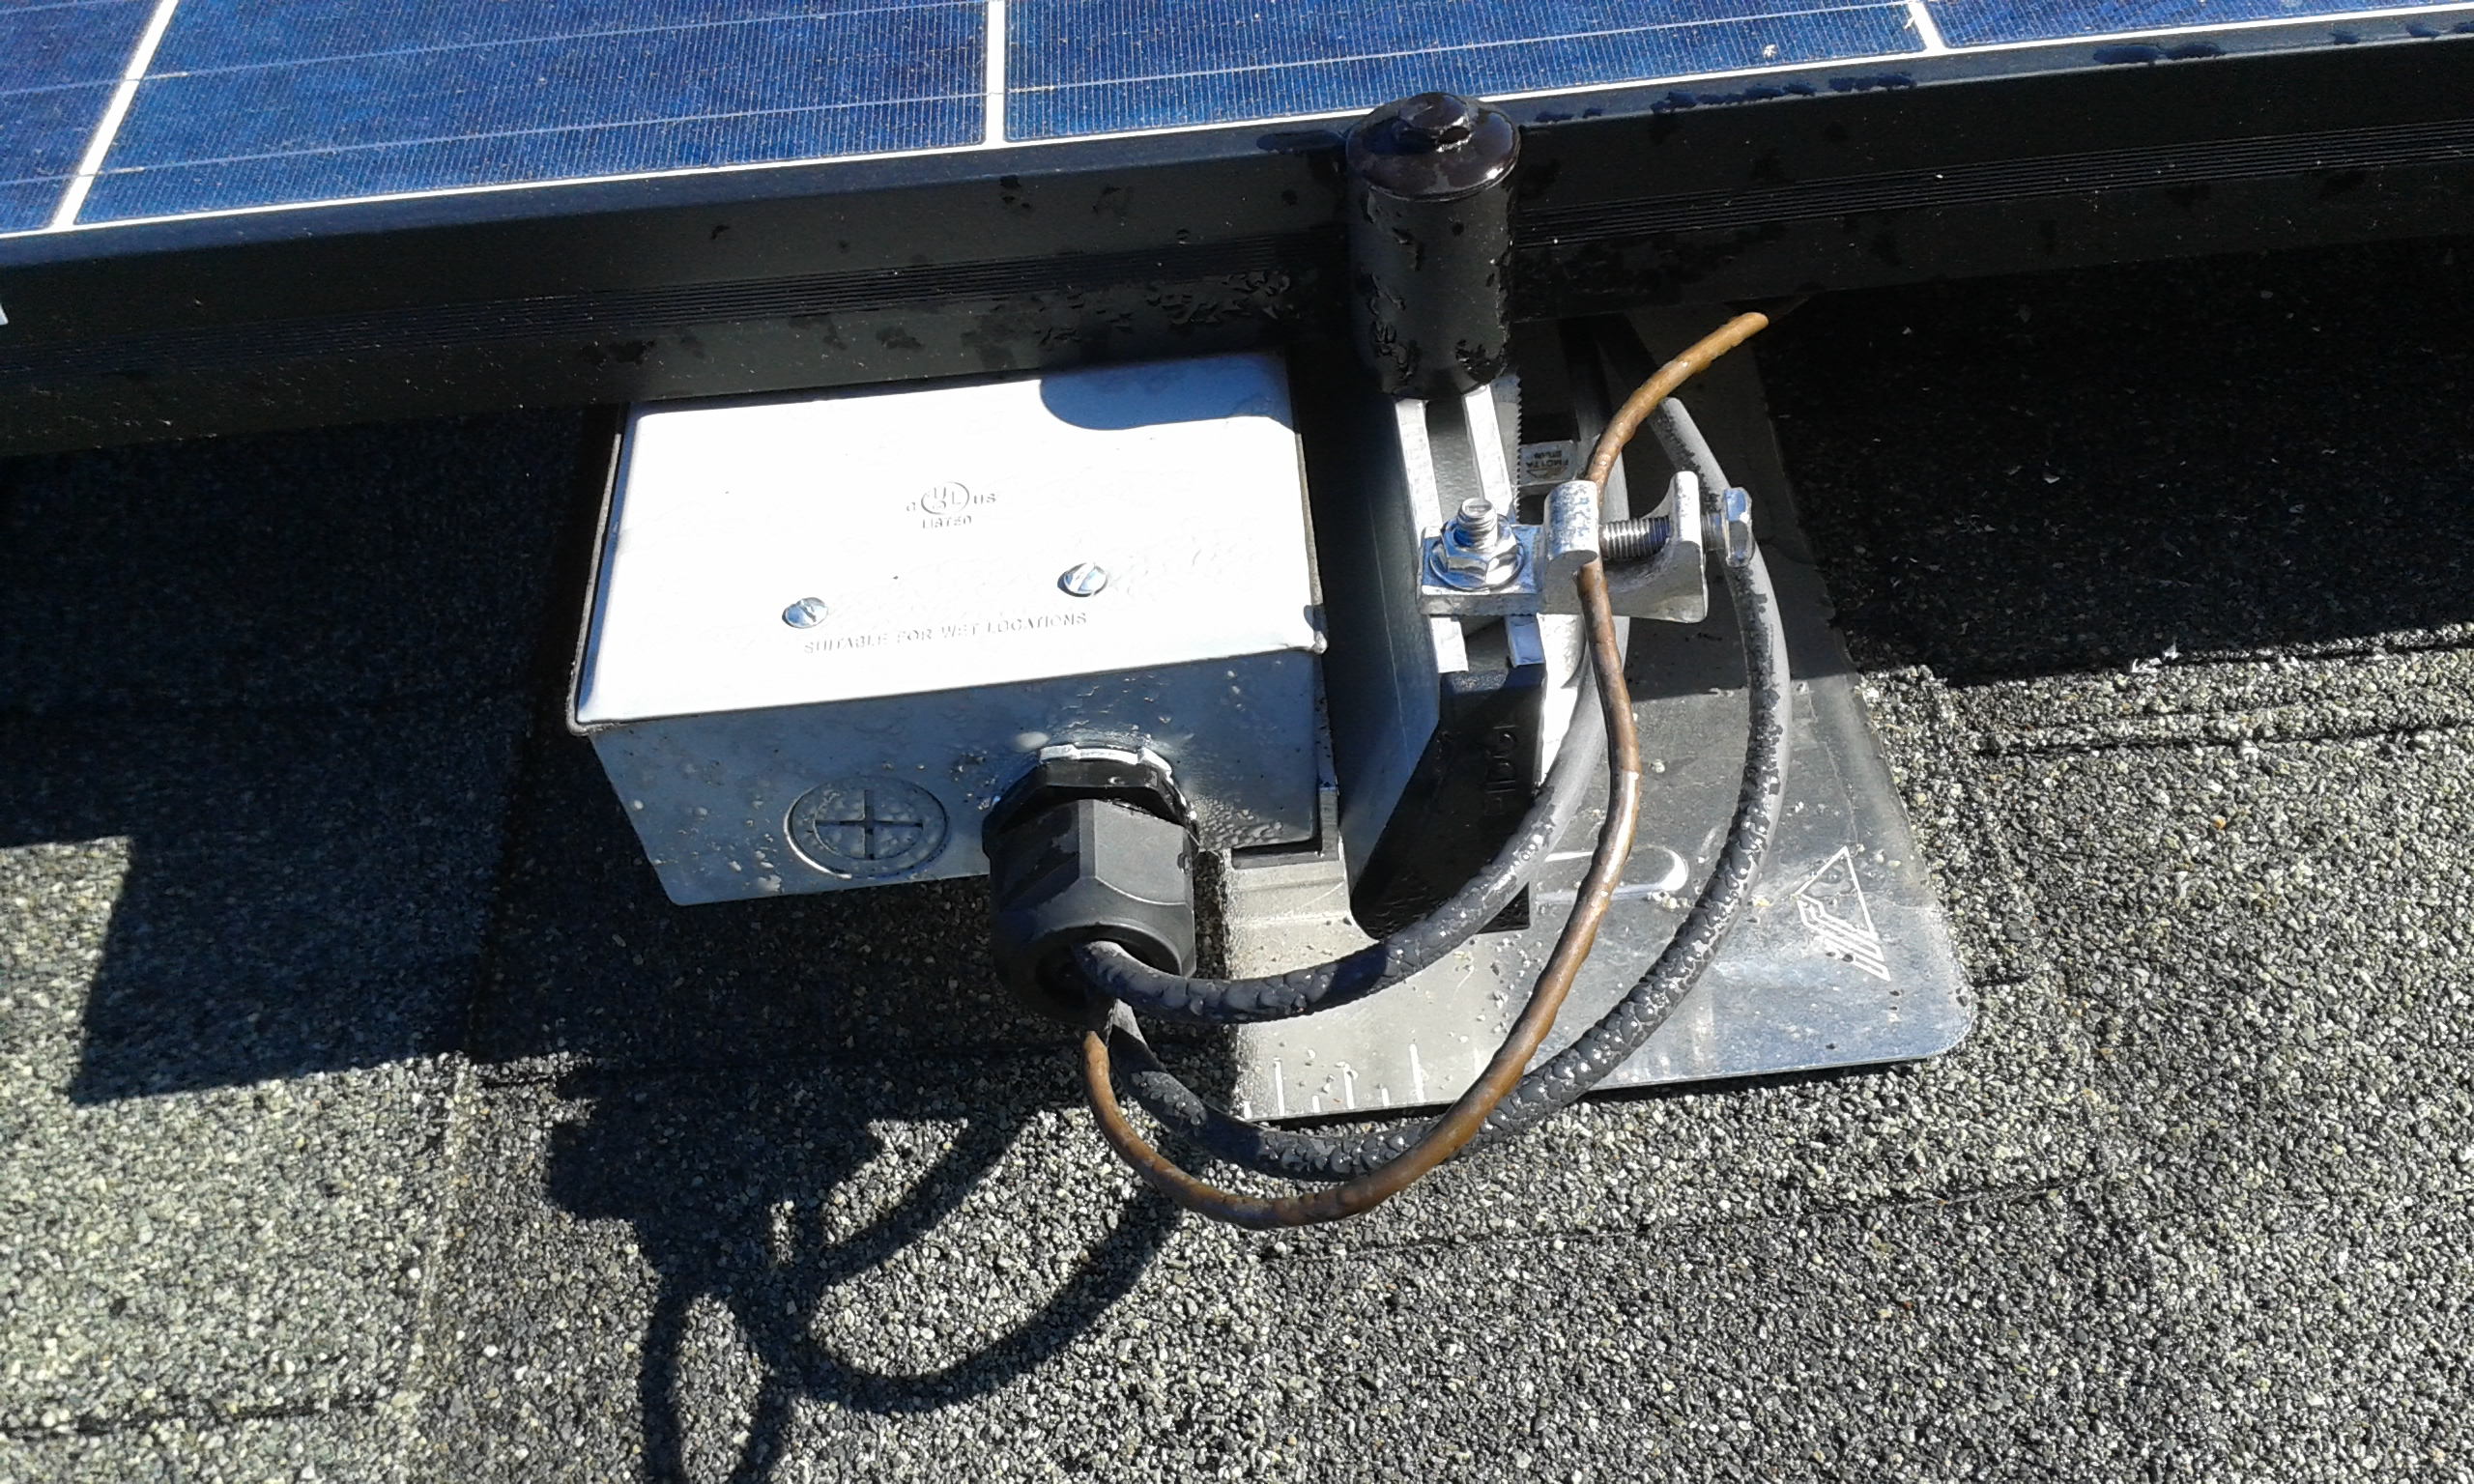
In the picture below you can see the bolts holding the panels to the racks. The optimizers are under the panels. It is pretty important to use a voltmeter as you go so that you can measure whether the connections are correct between the panels and optimizers. I found a couple of mistakes as I was going along. You are also supposed to cover the panels when connecting the optimizers. I used a piece of cardboard that the panels were shipped with.
This is a one story house, so I was able to carry the panels onto the roof by myself and completed the entire installation without needing anybody else. I put an old rug on the edge of the roof so that I could push the panels onto the roof from below by sliding the panels onto the rug. This worked really well. It was a bit difficult to install the panels onto the racks by myself, and probably would recommend against doing this especially if there is not much room to stand on below the panels on the roof.
This was my first time bending conduit, and it's kind of fun. This box is mounted the opposite direction from the
southwest panels because of where the conduit enters.
 On this box, the end of the angle bracket is easier to see. The cord grip is also visible.
 I was wondering if there were any rules on how close panels can be to electrical, but the inspector didn't say anything.
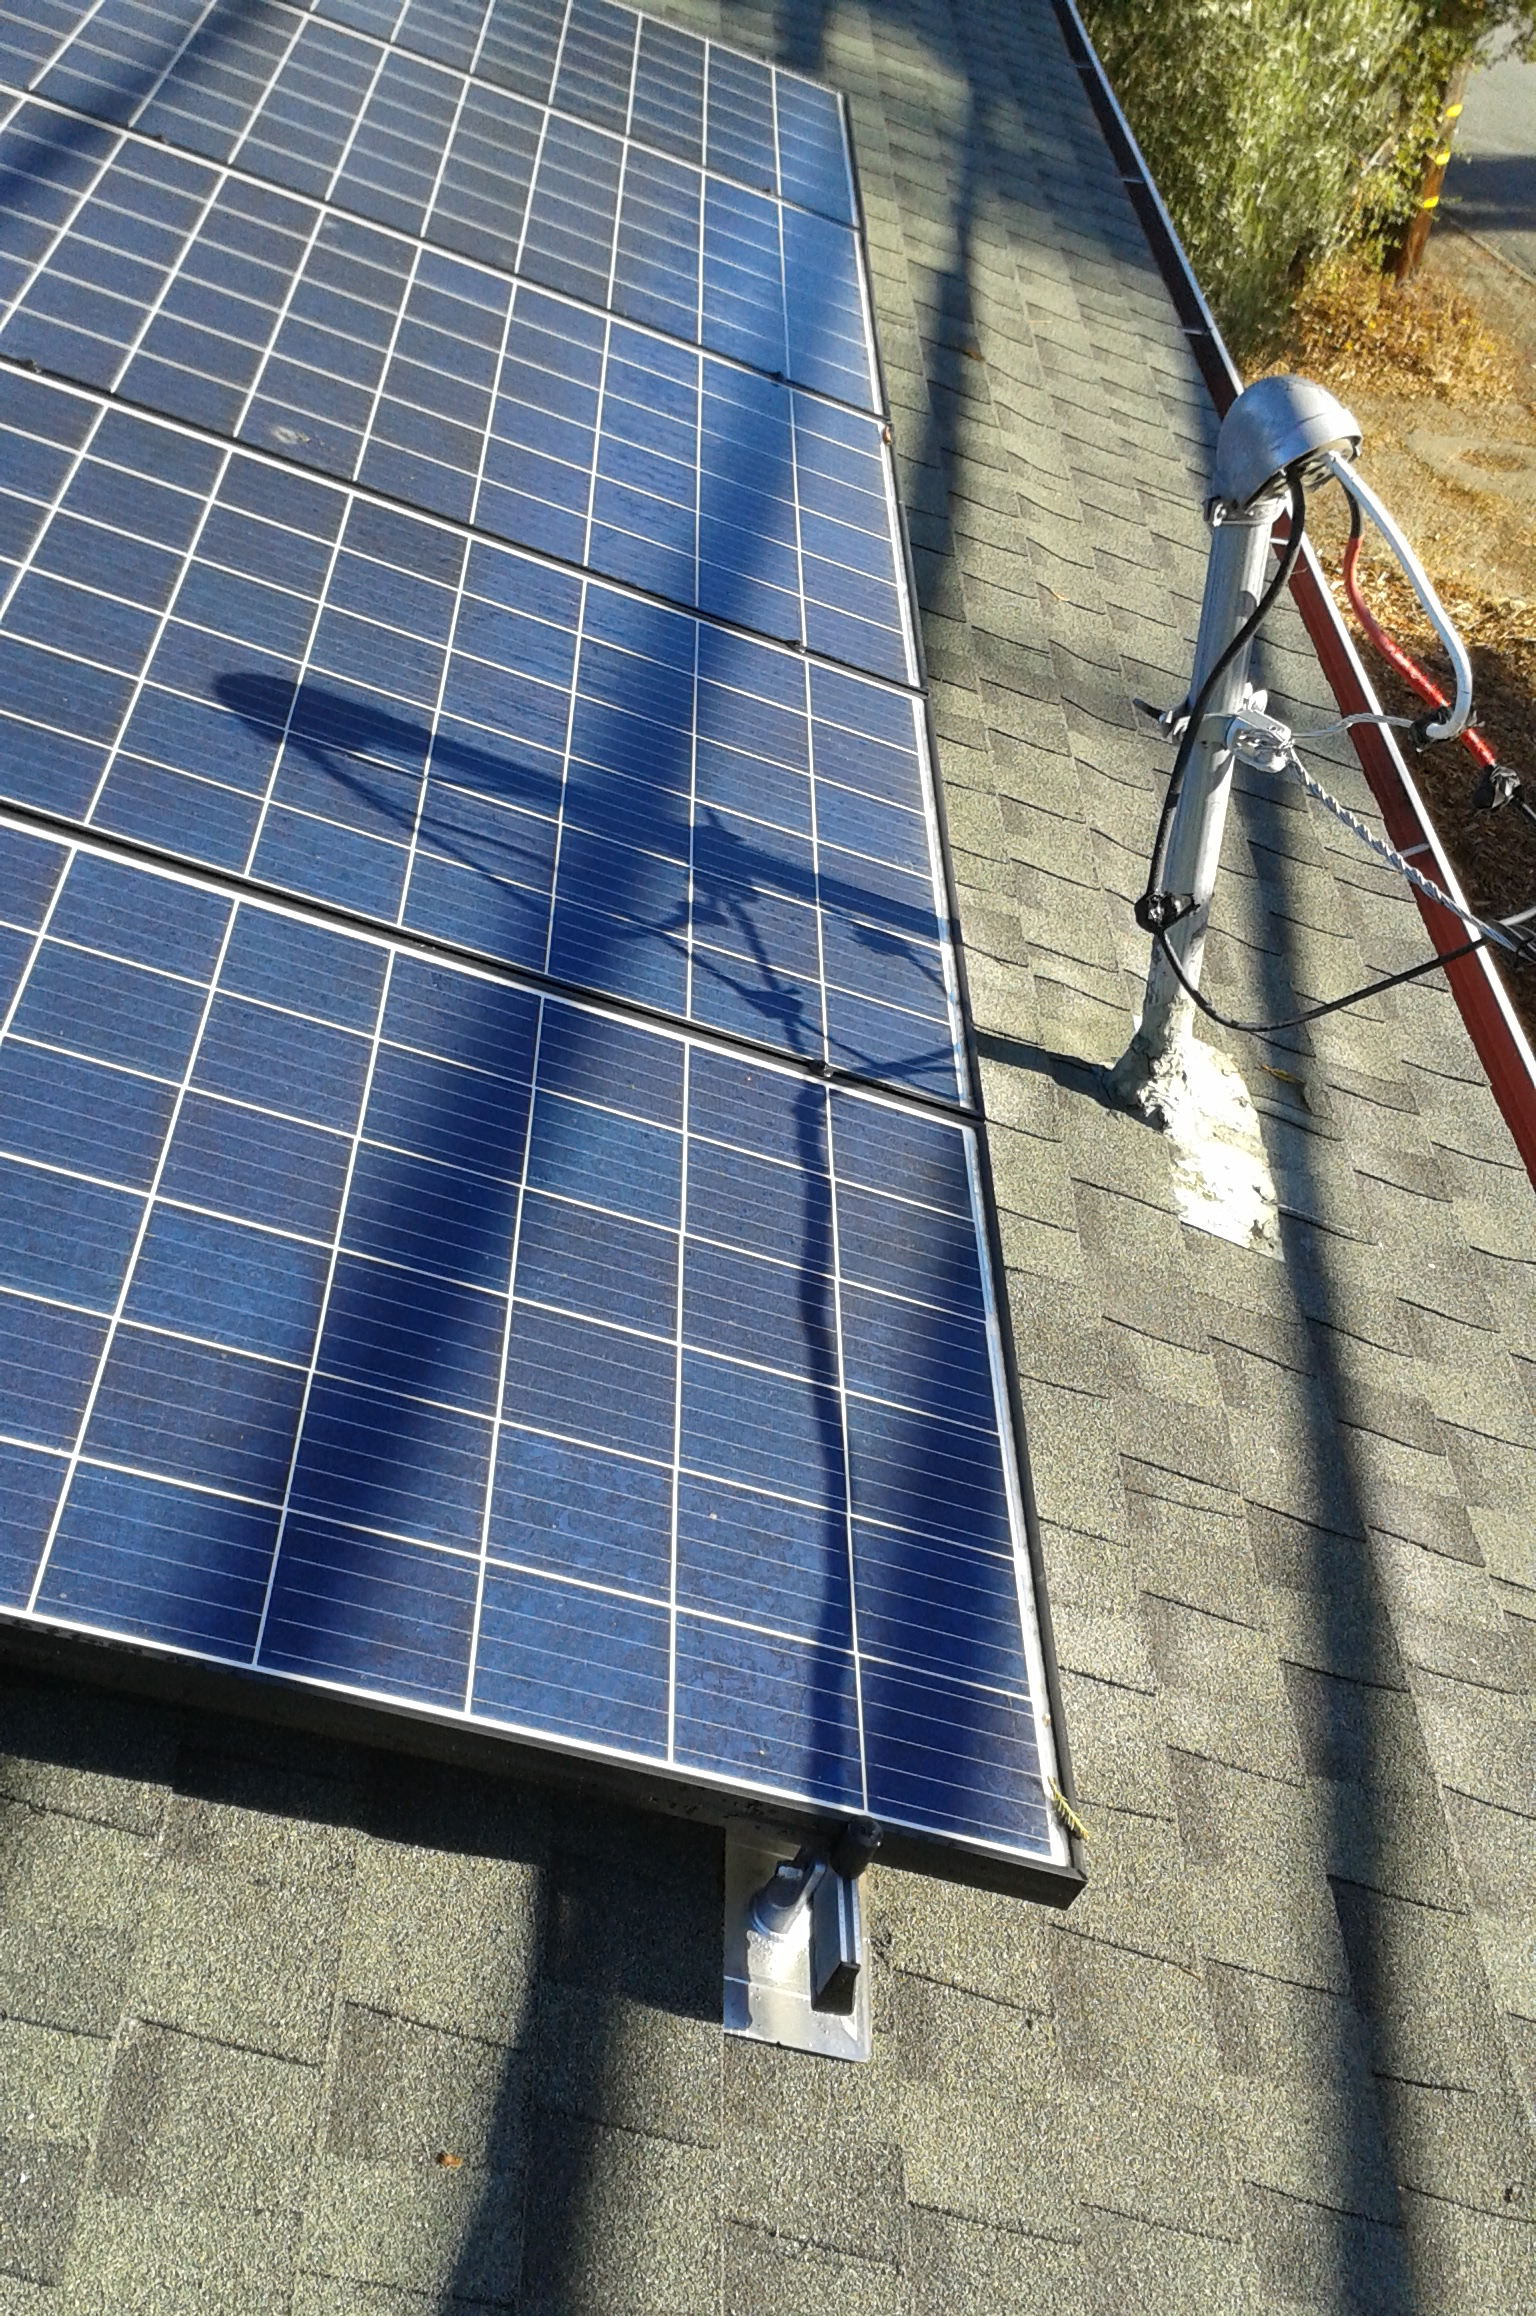 This shows all panels on the southeast side.
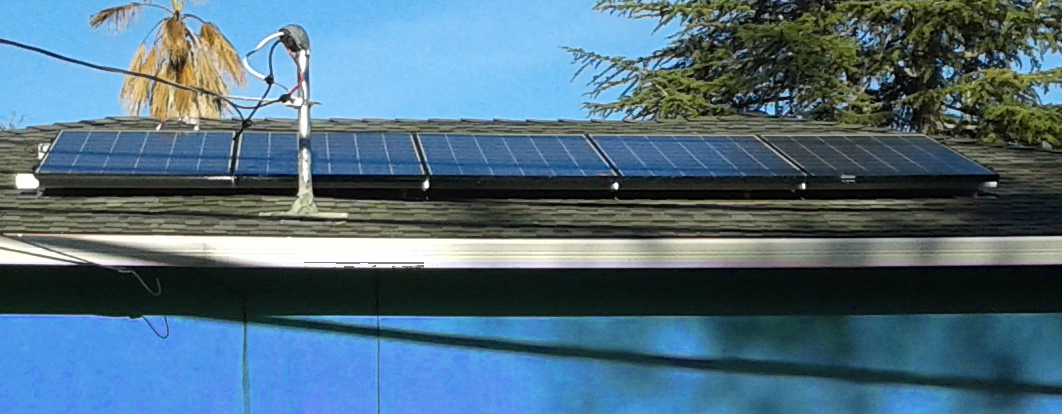
The stickers on the box and later on the conduit all came from the solar kit. I laid all stickers out on a large flat space so that I could figure out all sticker locations before mounting them. When the inspector came, he asked where a sticker was on some conduit, and I pointed a bit down the line. I said that that was all the stickers in the kit, and he was ok with it.
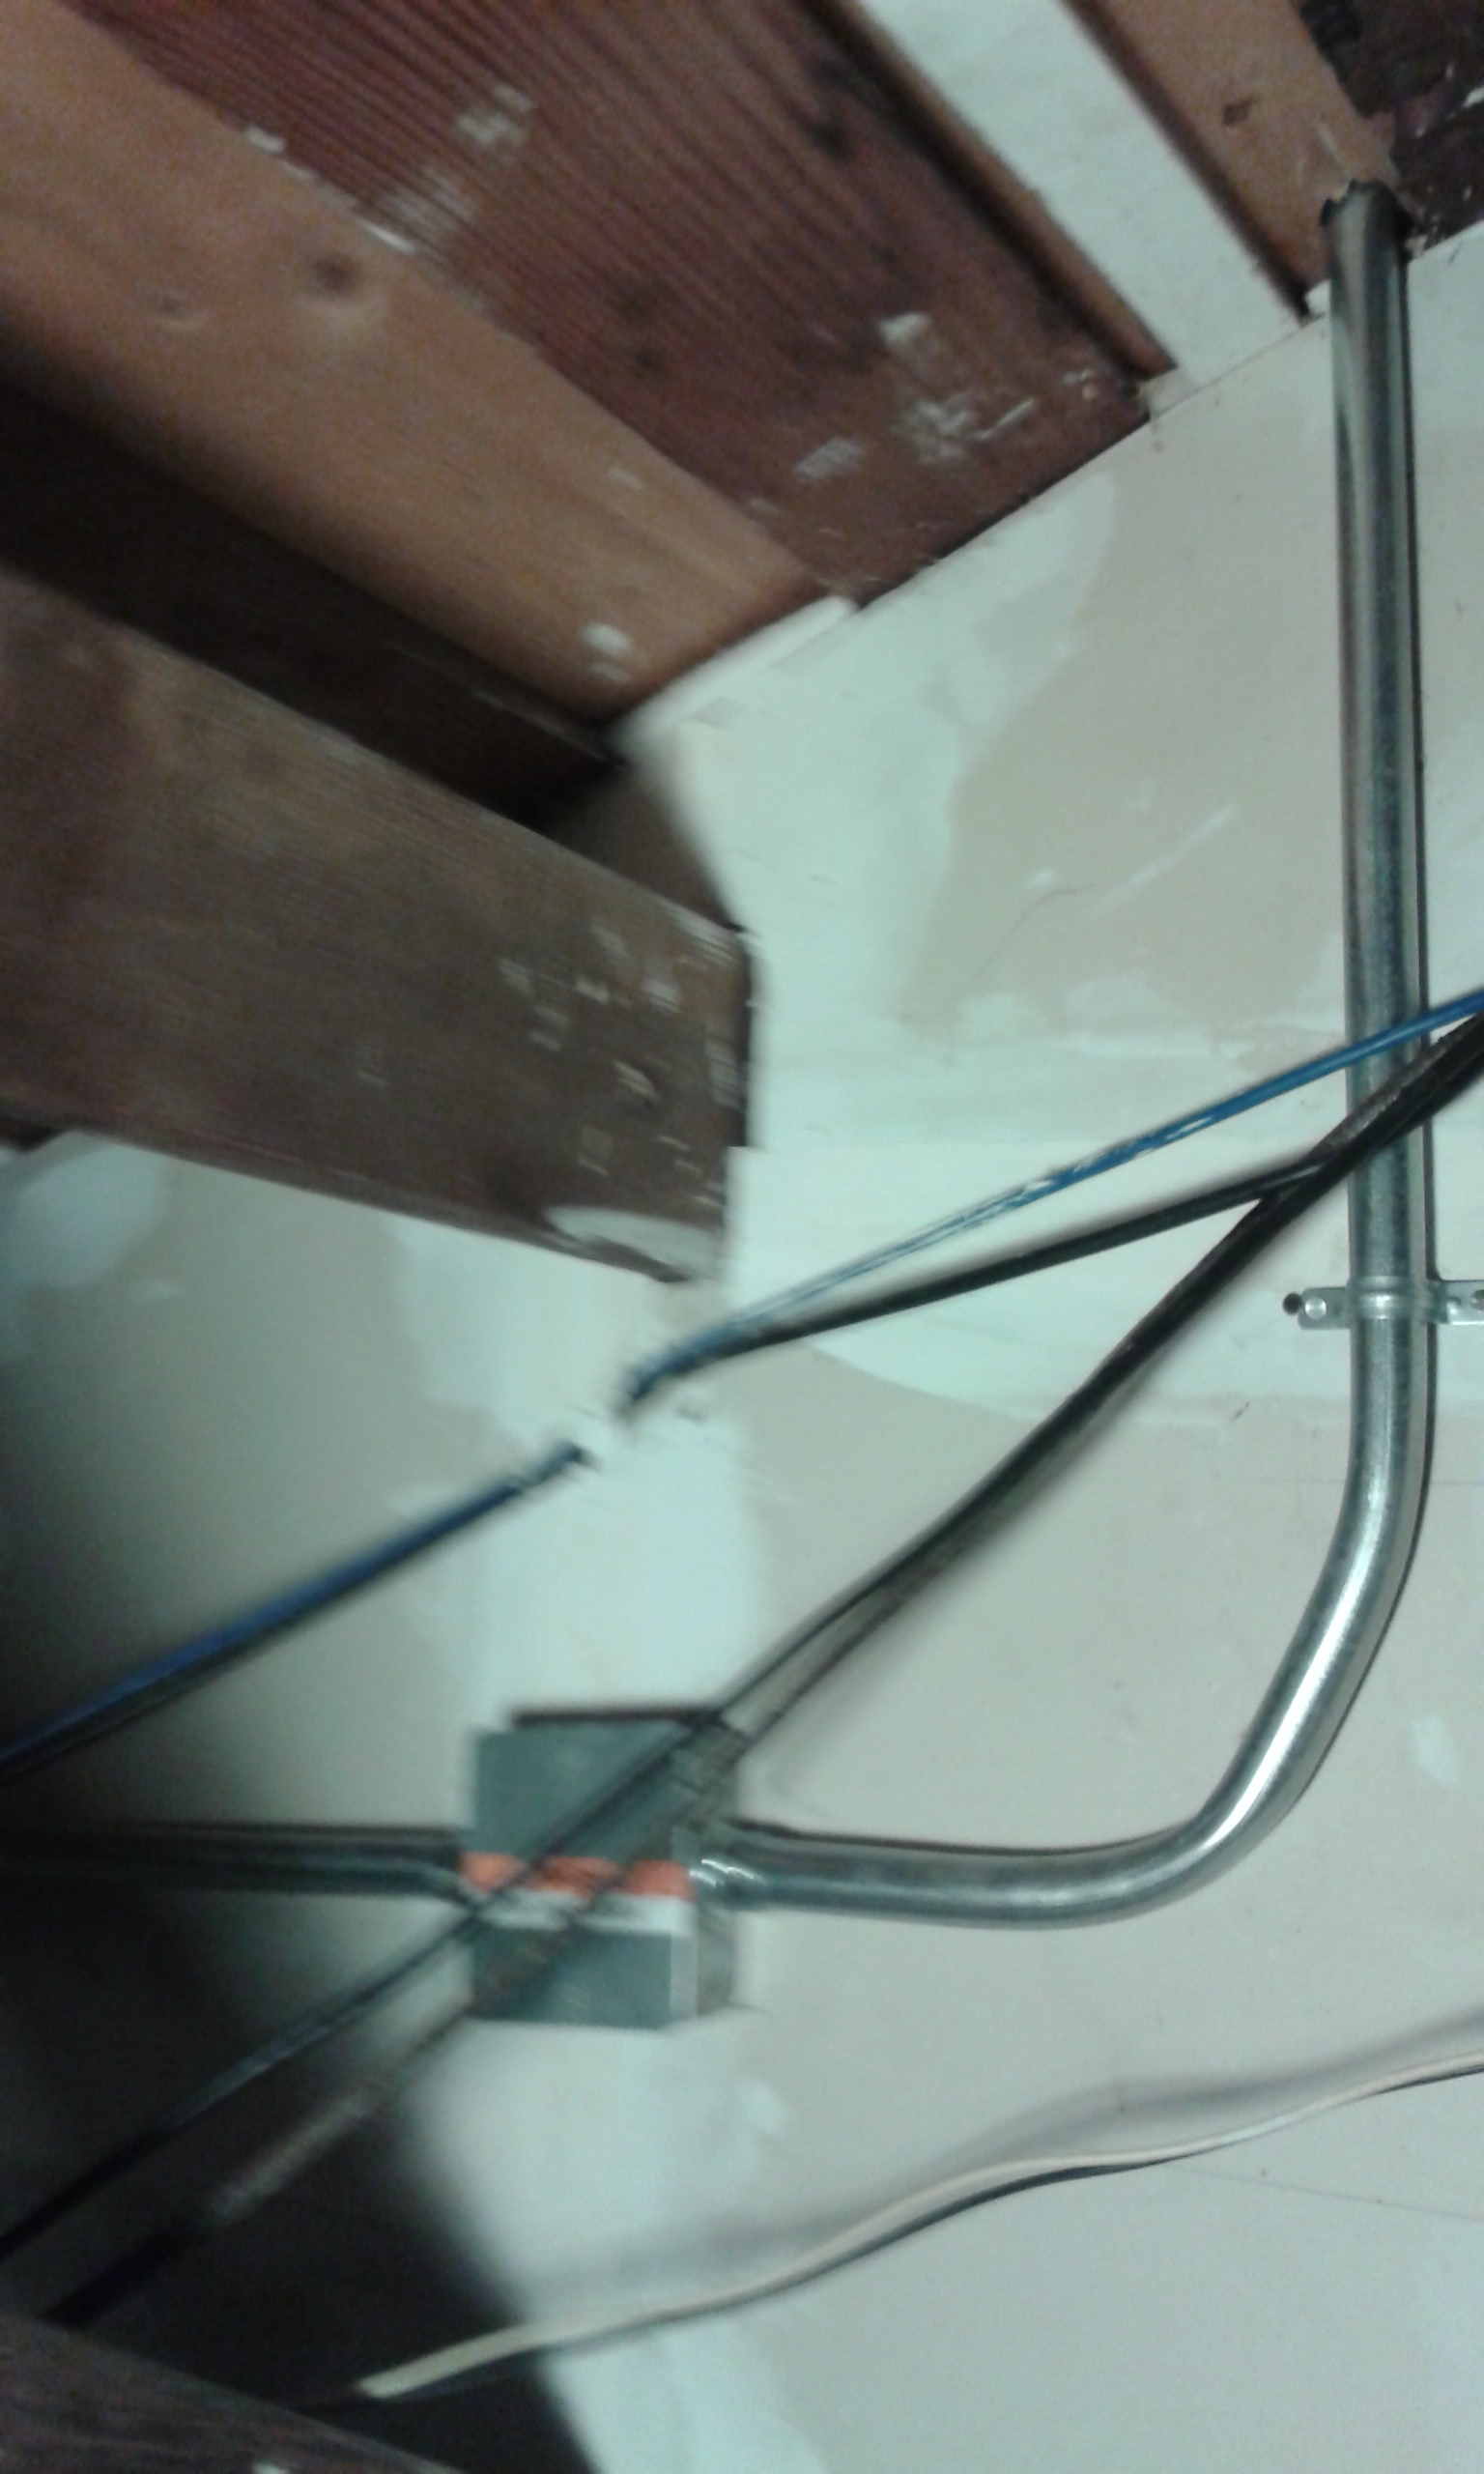
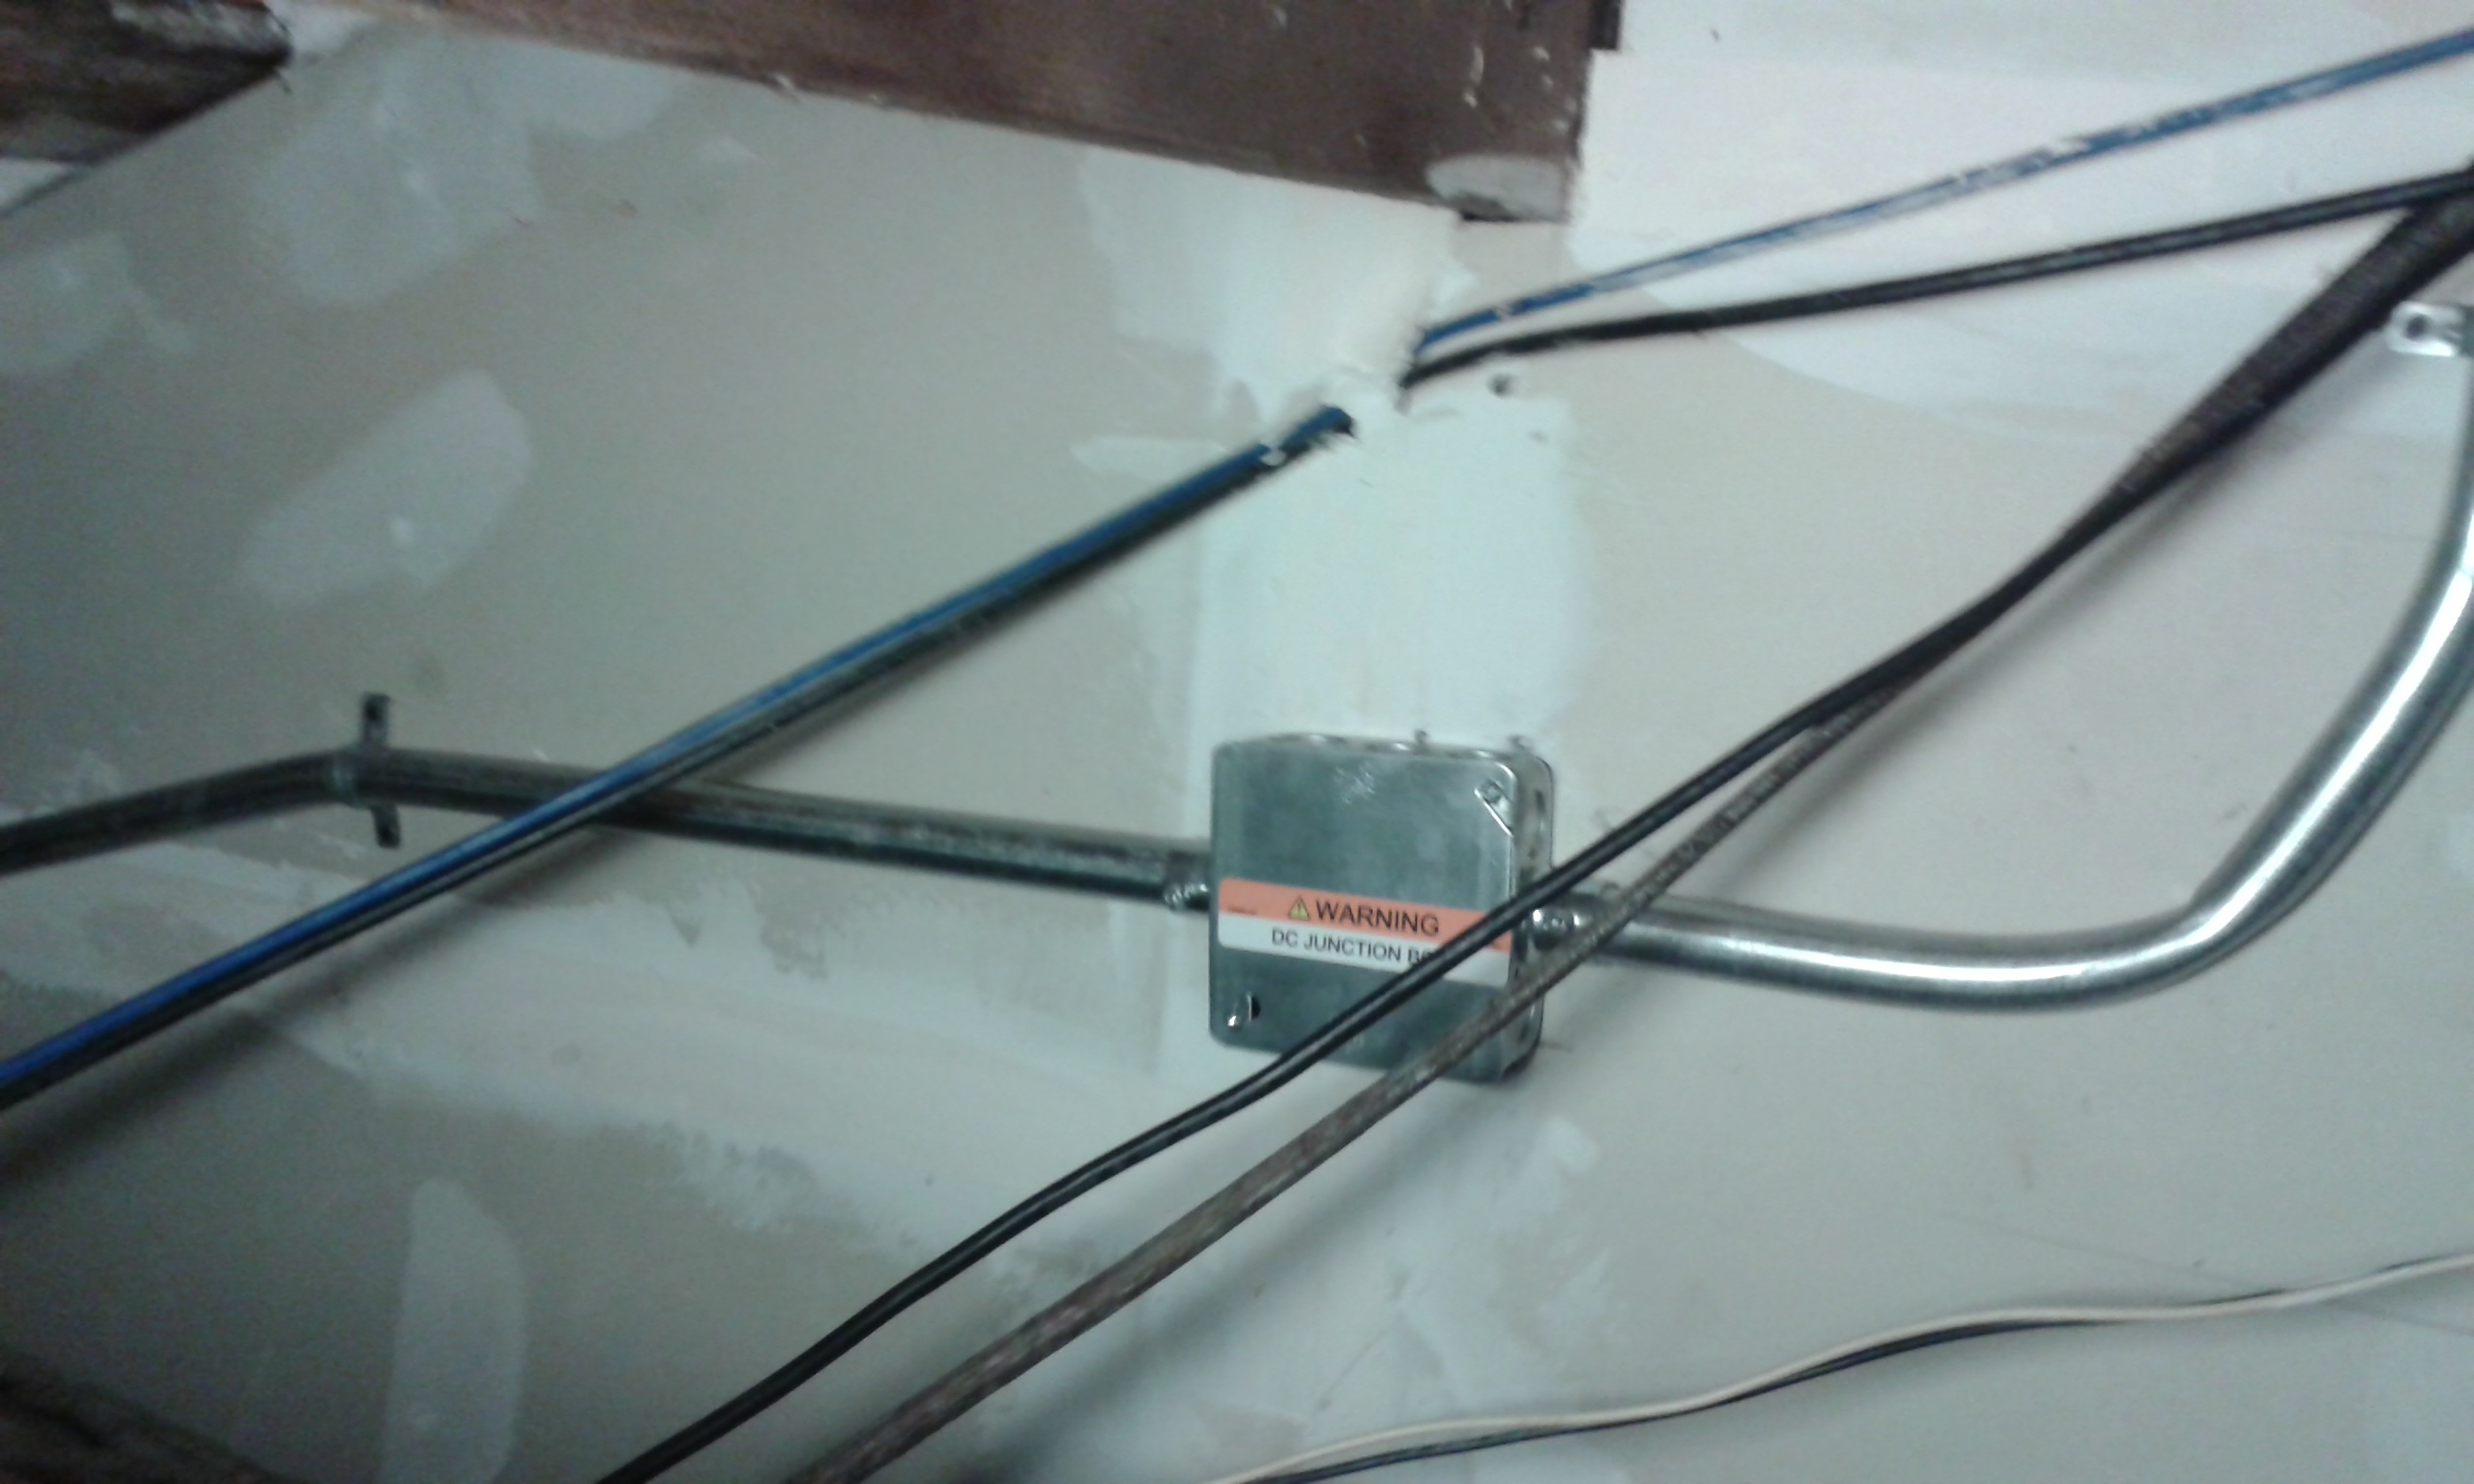 I was able to run all conduit in the garage. This was a lot easier than many installations will be.
The conduit must be 10" below the roof because the firefighters may use a saw to cut open the roof.
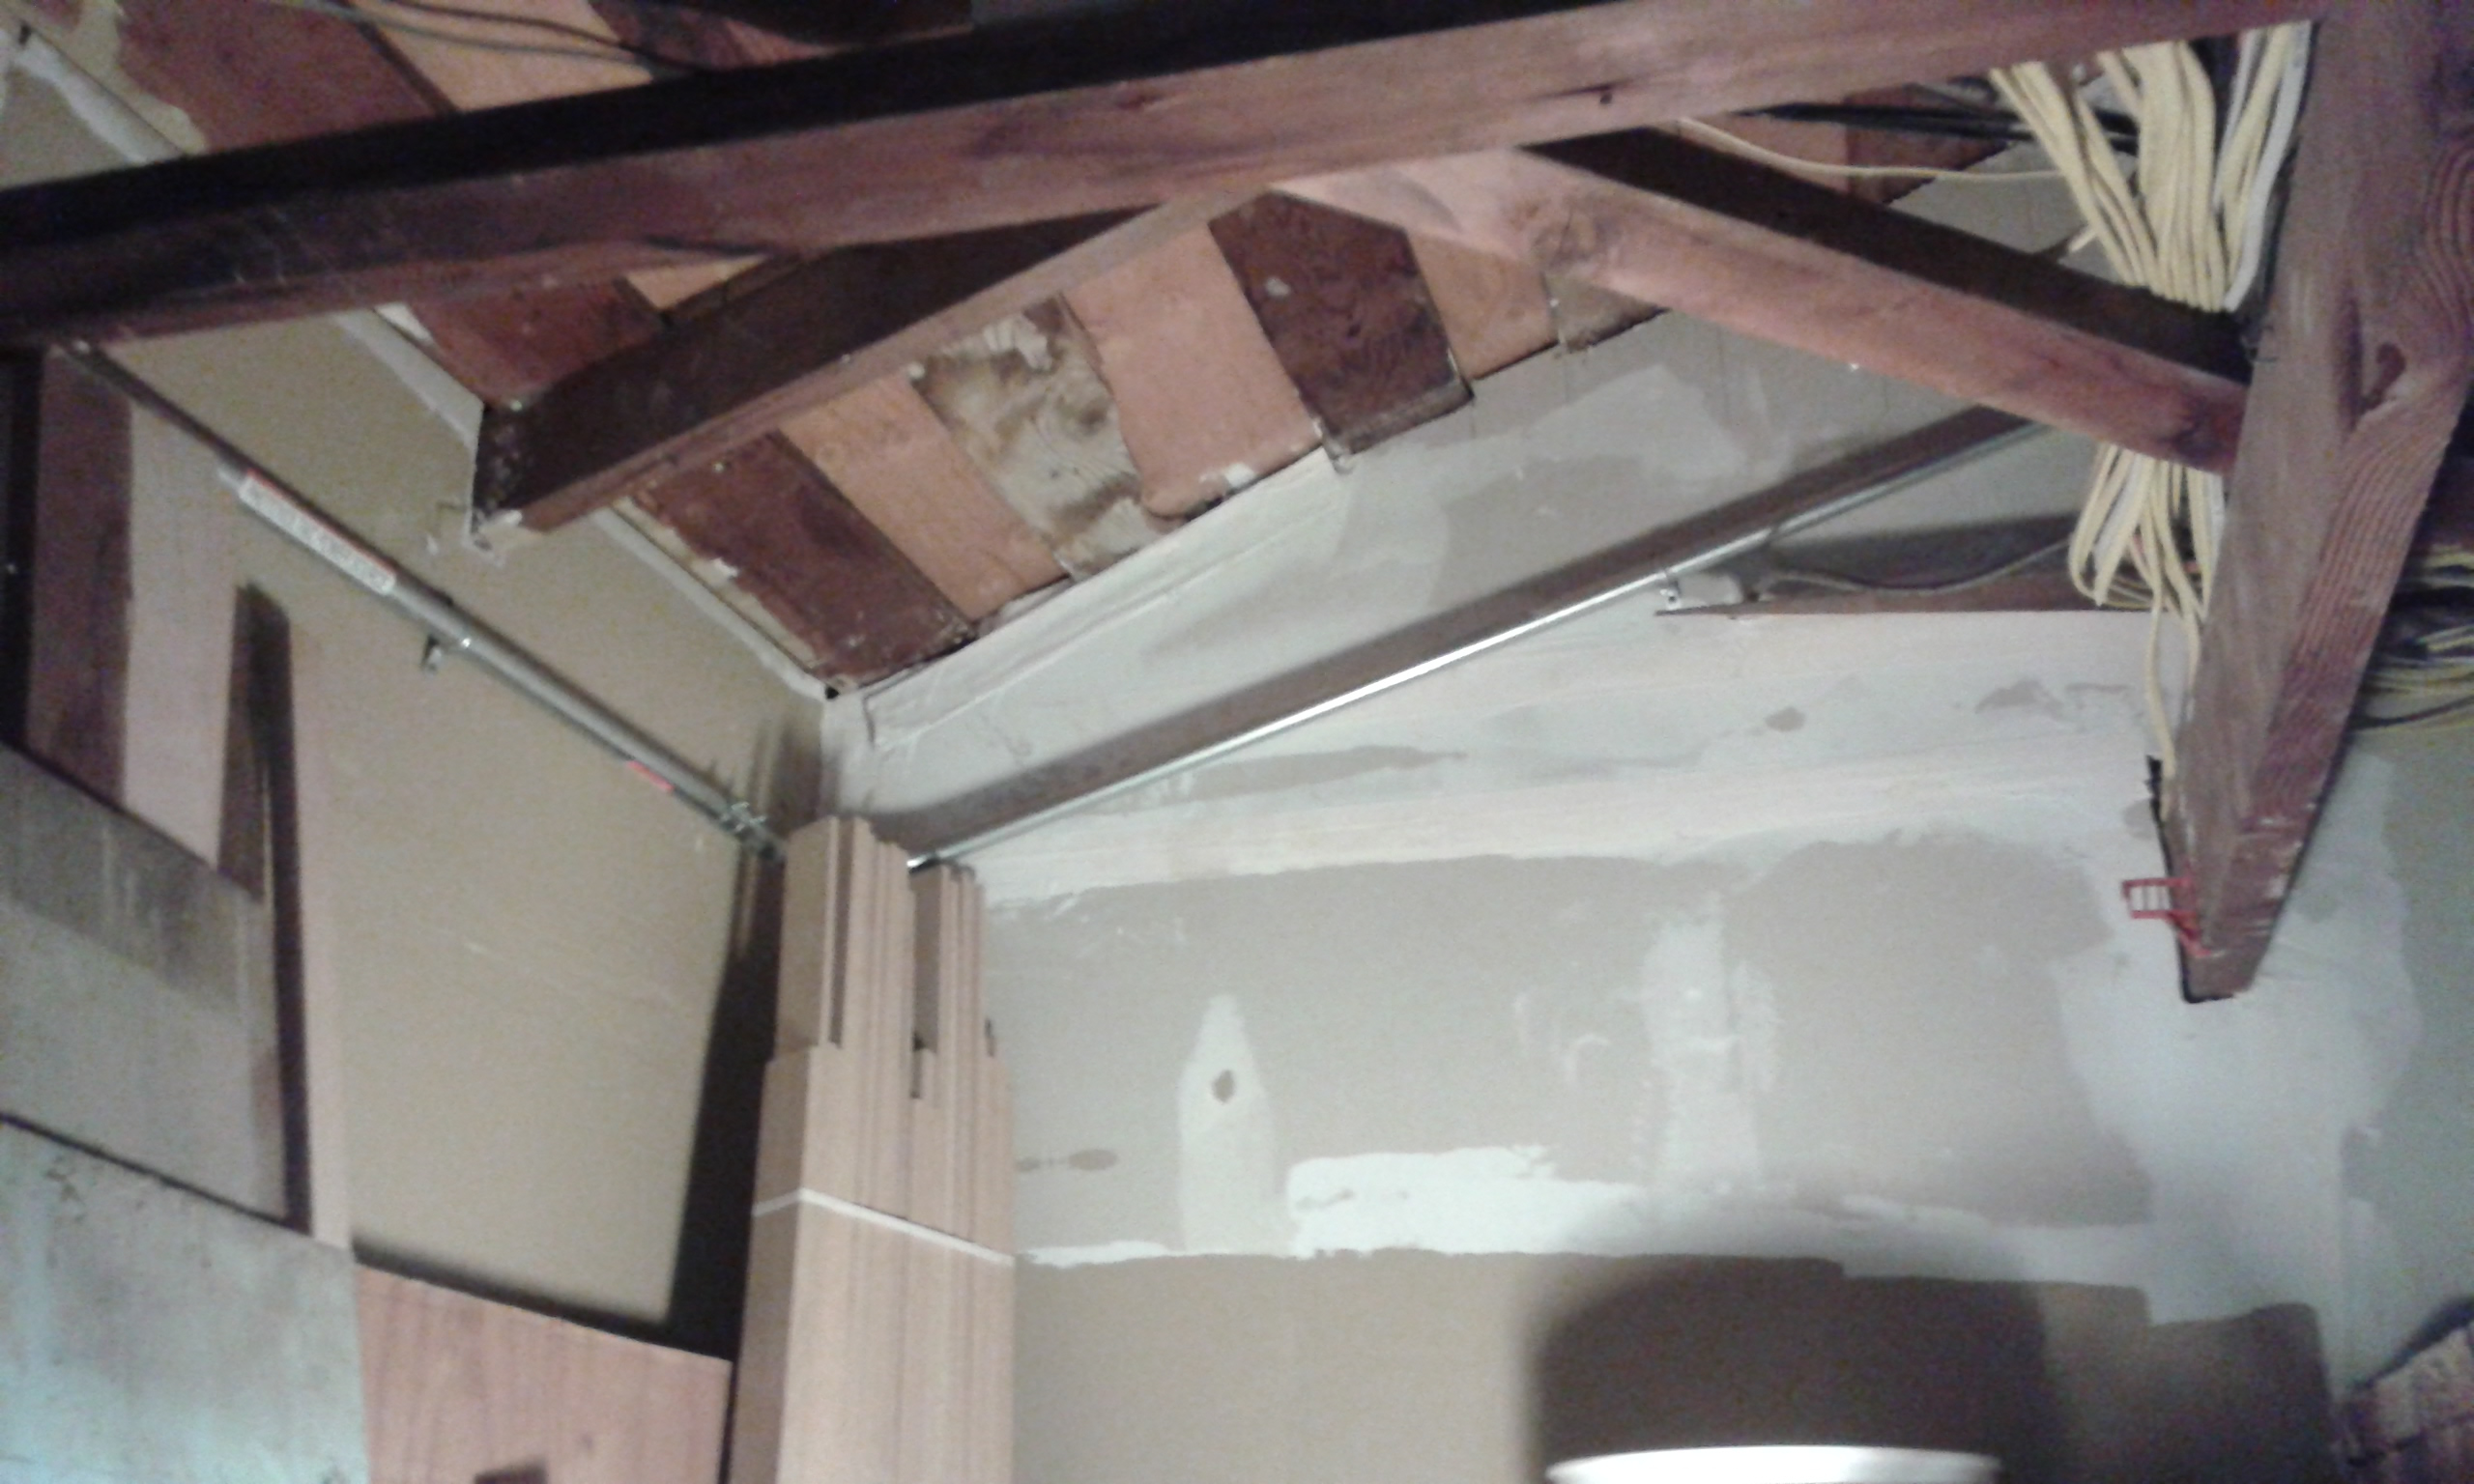 This shows the conduit going up to the southwest panels. The roof looks strange here because this is an add-on to the house, and this old part of the roof is now under the new roof.
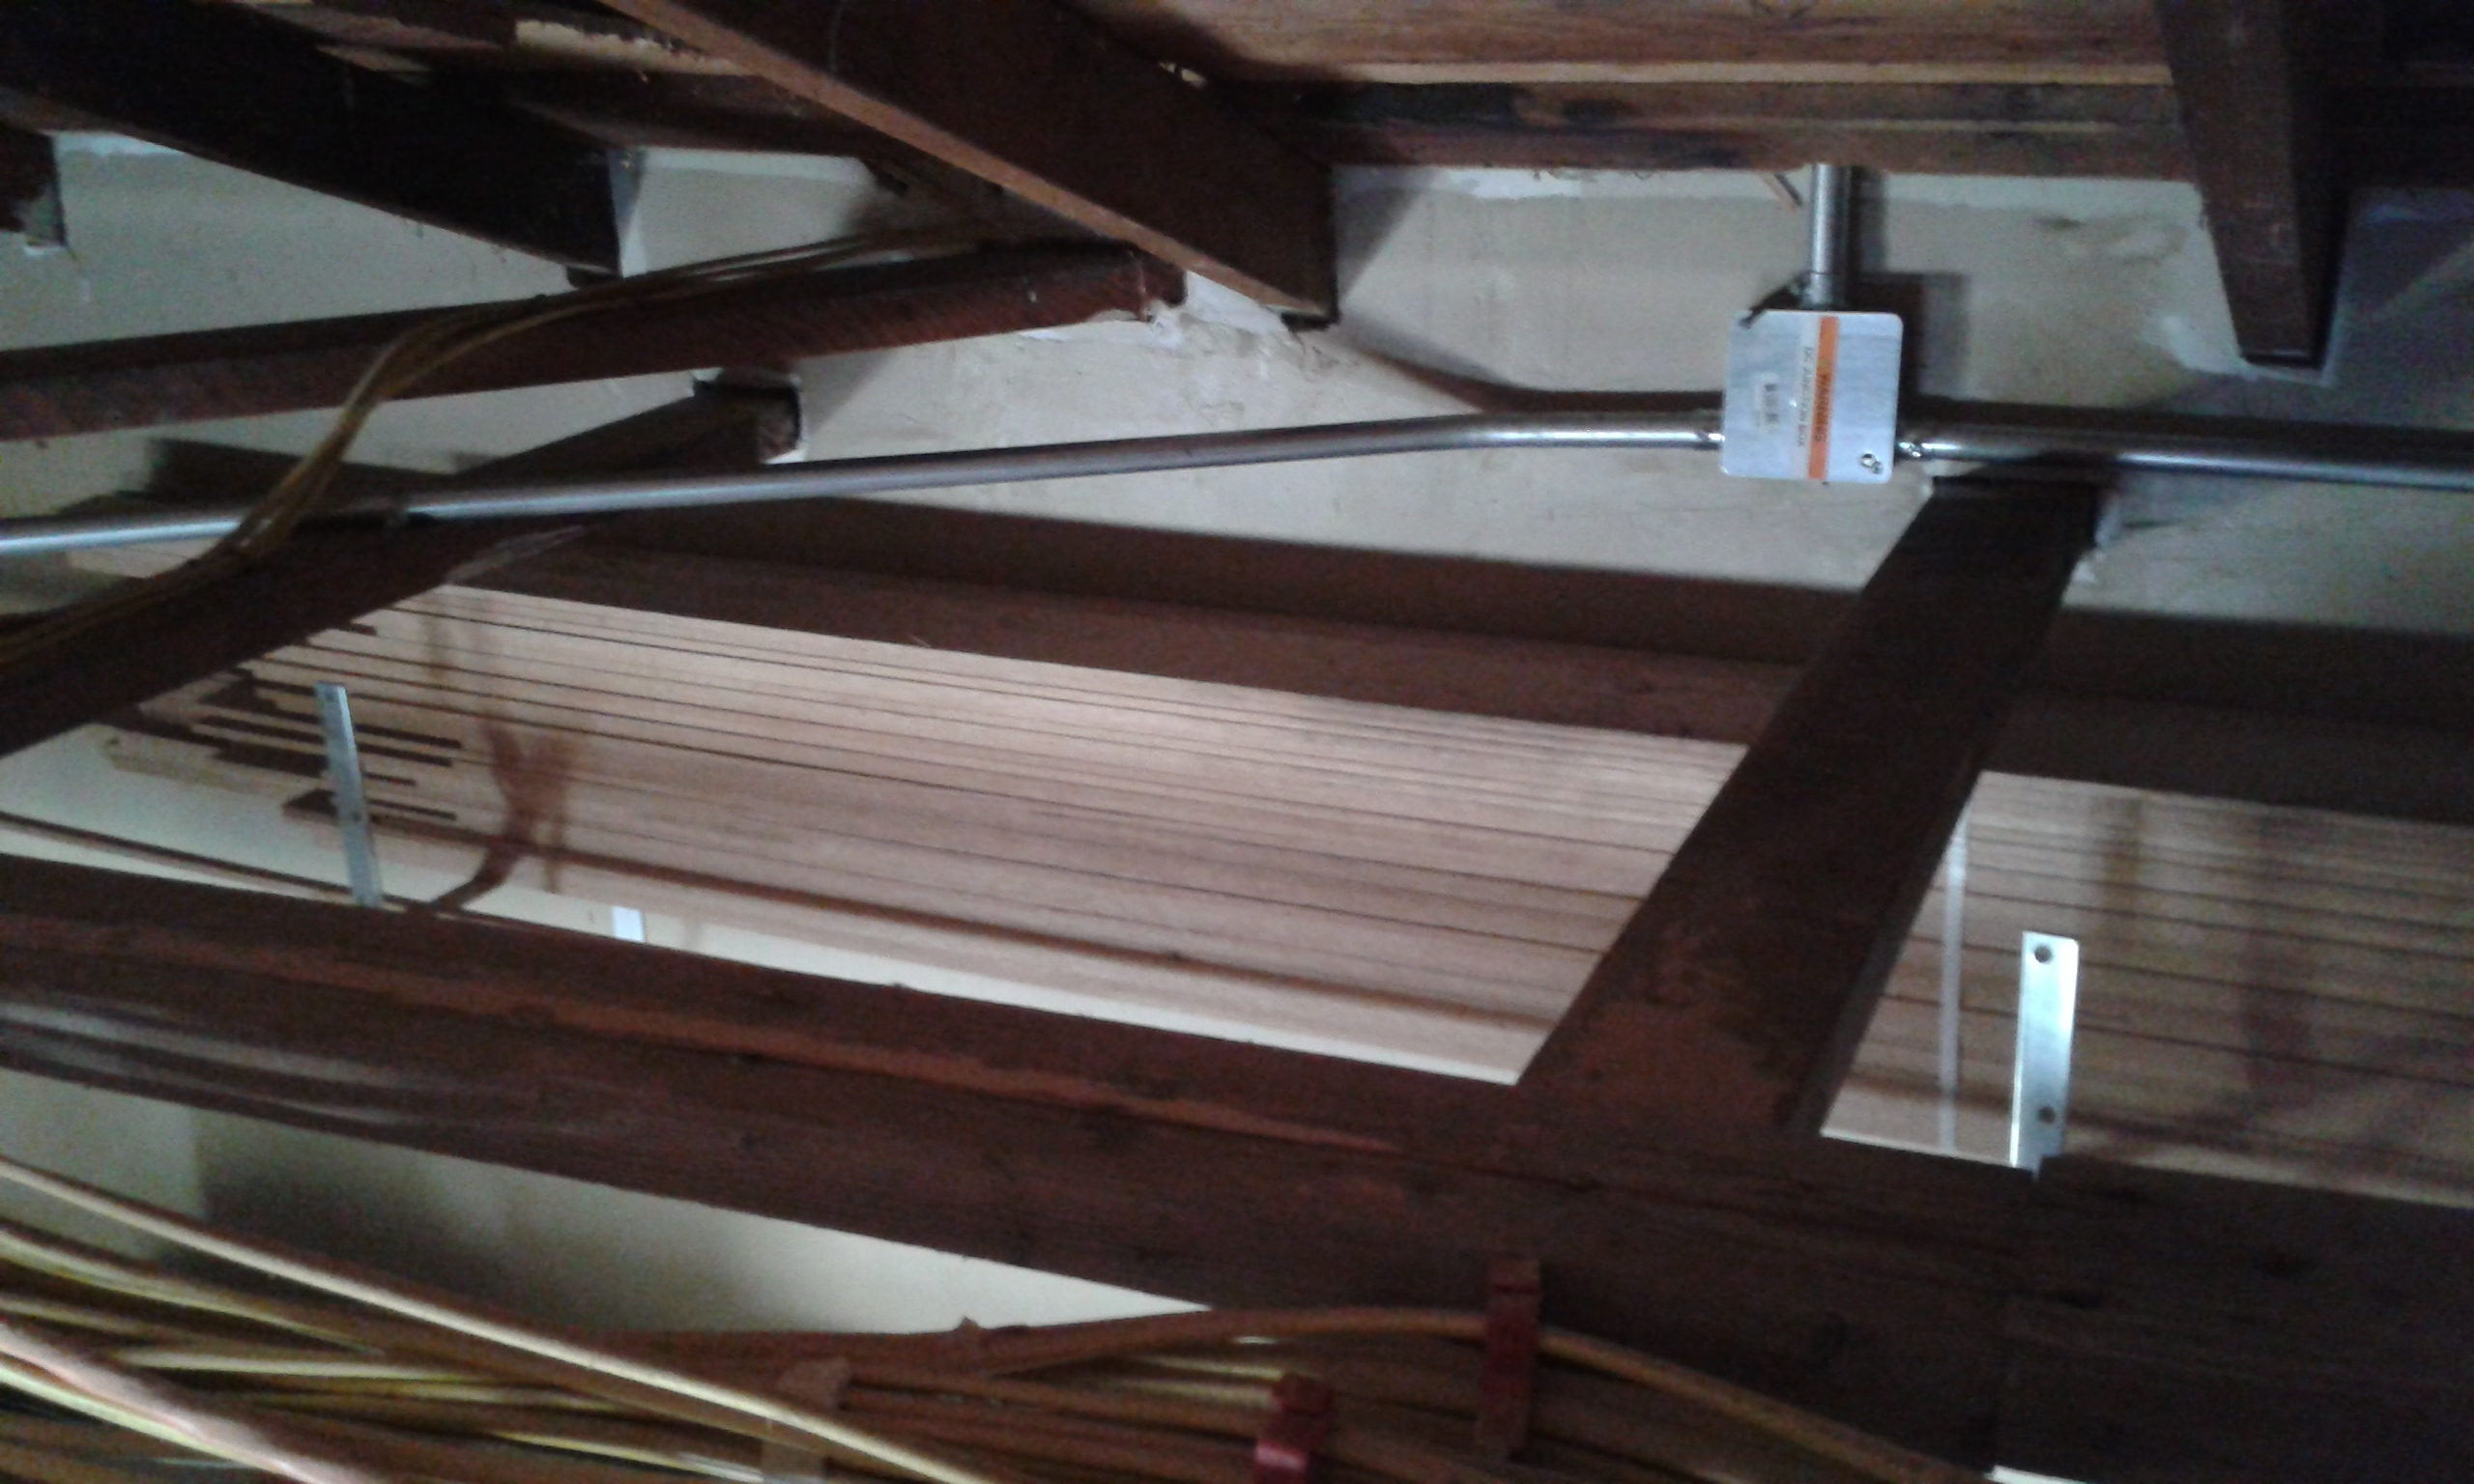 I put some extra vents in the garage. One is above the inverter in an attempt to keep some more air flow around the inverter in order to keep it cooler for longer life.
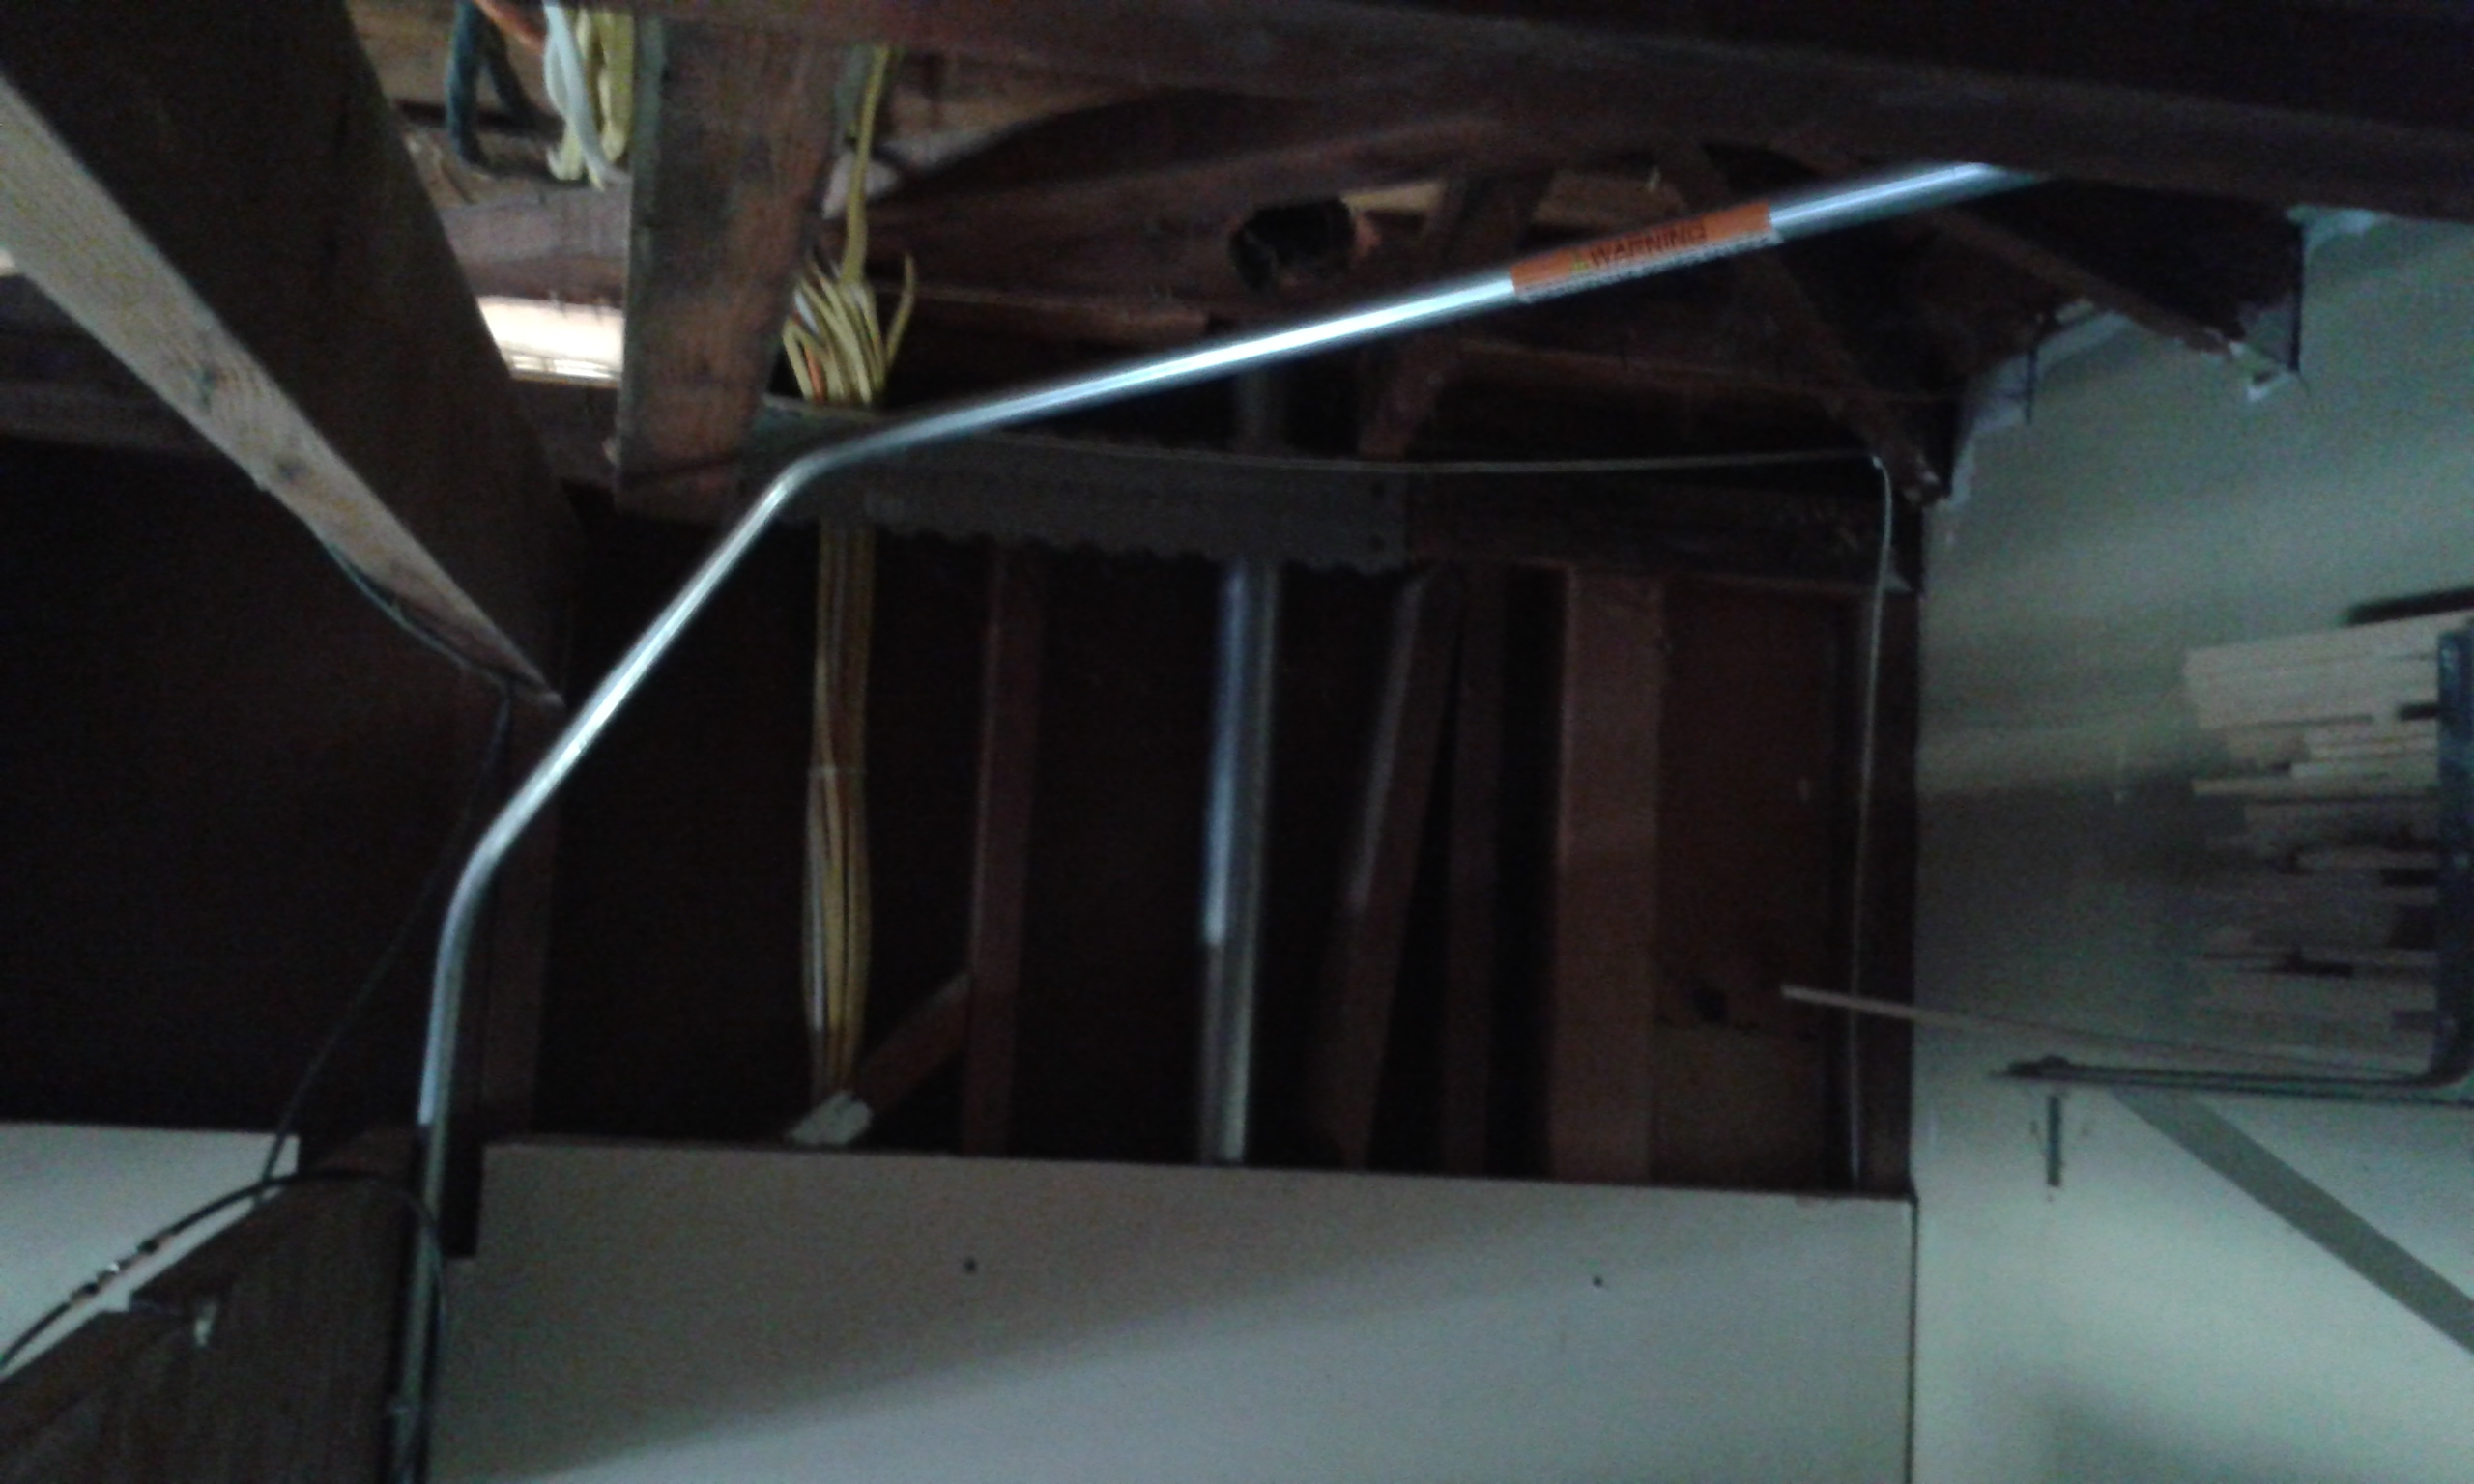 Finally the conduit down to the inverter. Note that all of the conduit so far has been for the DC electrical to the inverter. The DC wiring was supplied in the kit.
The network wire is connected to the inverter, but I have not set up software for it yet.
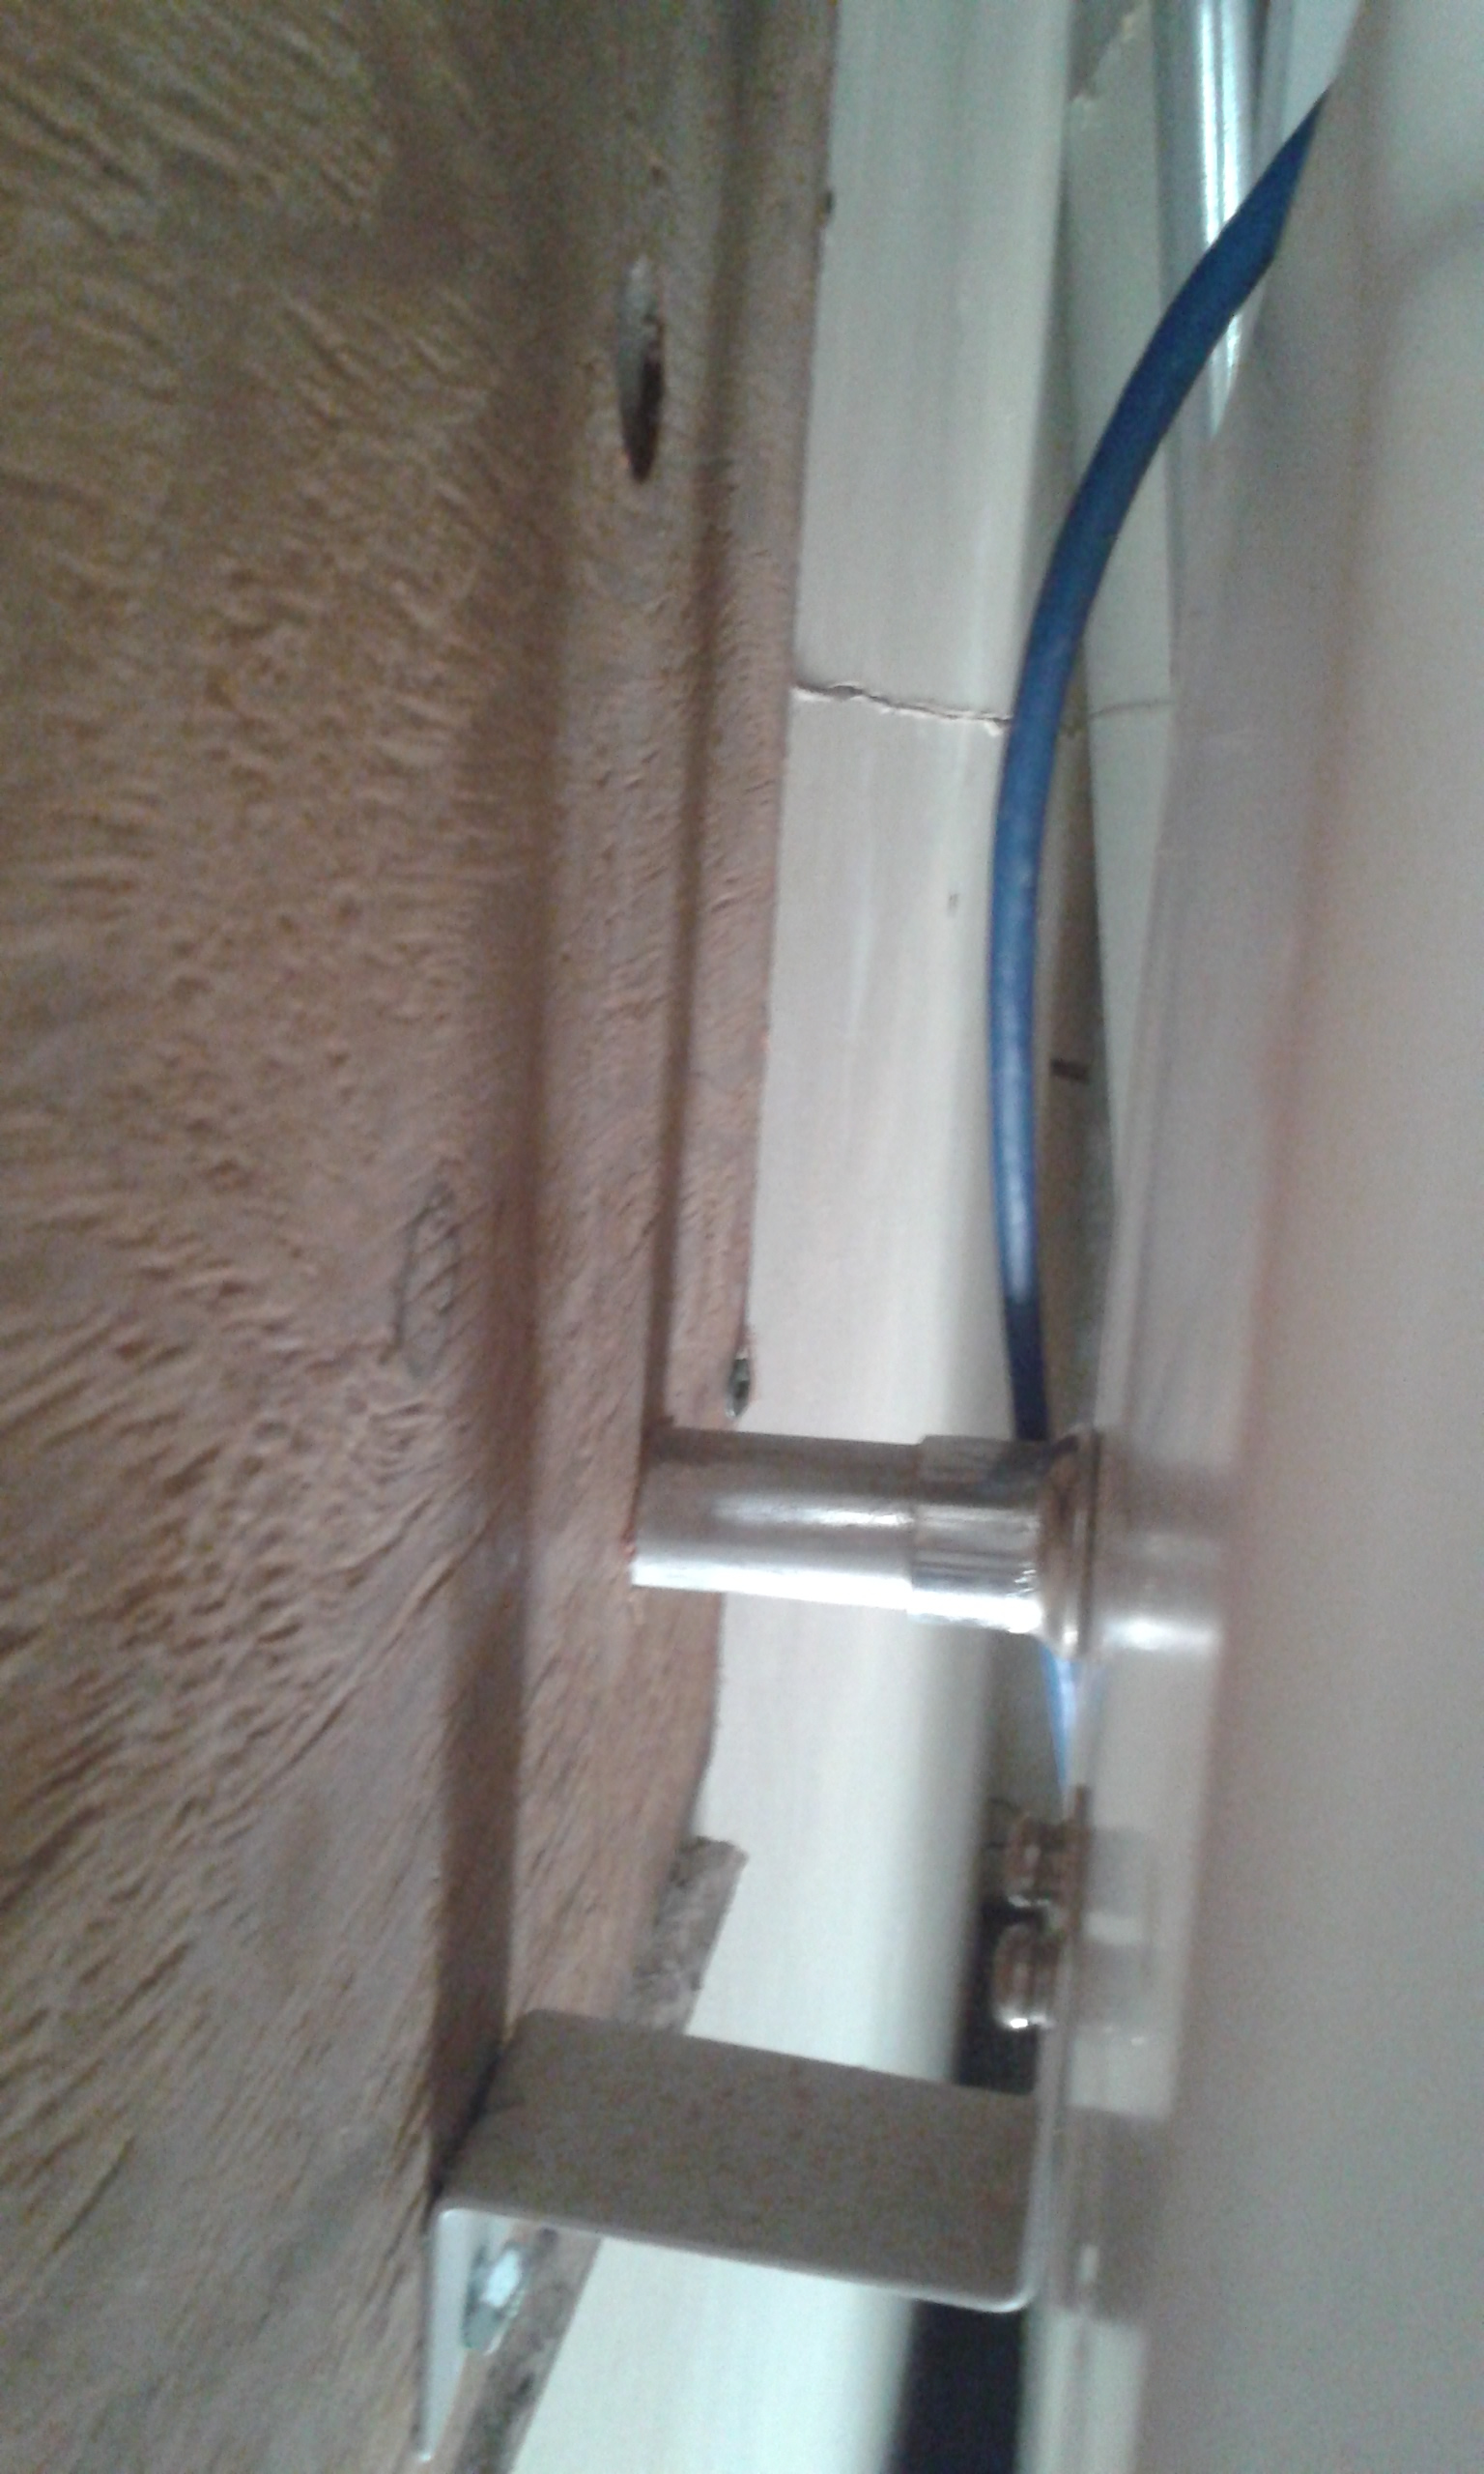
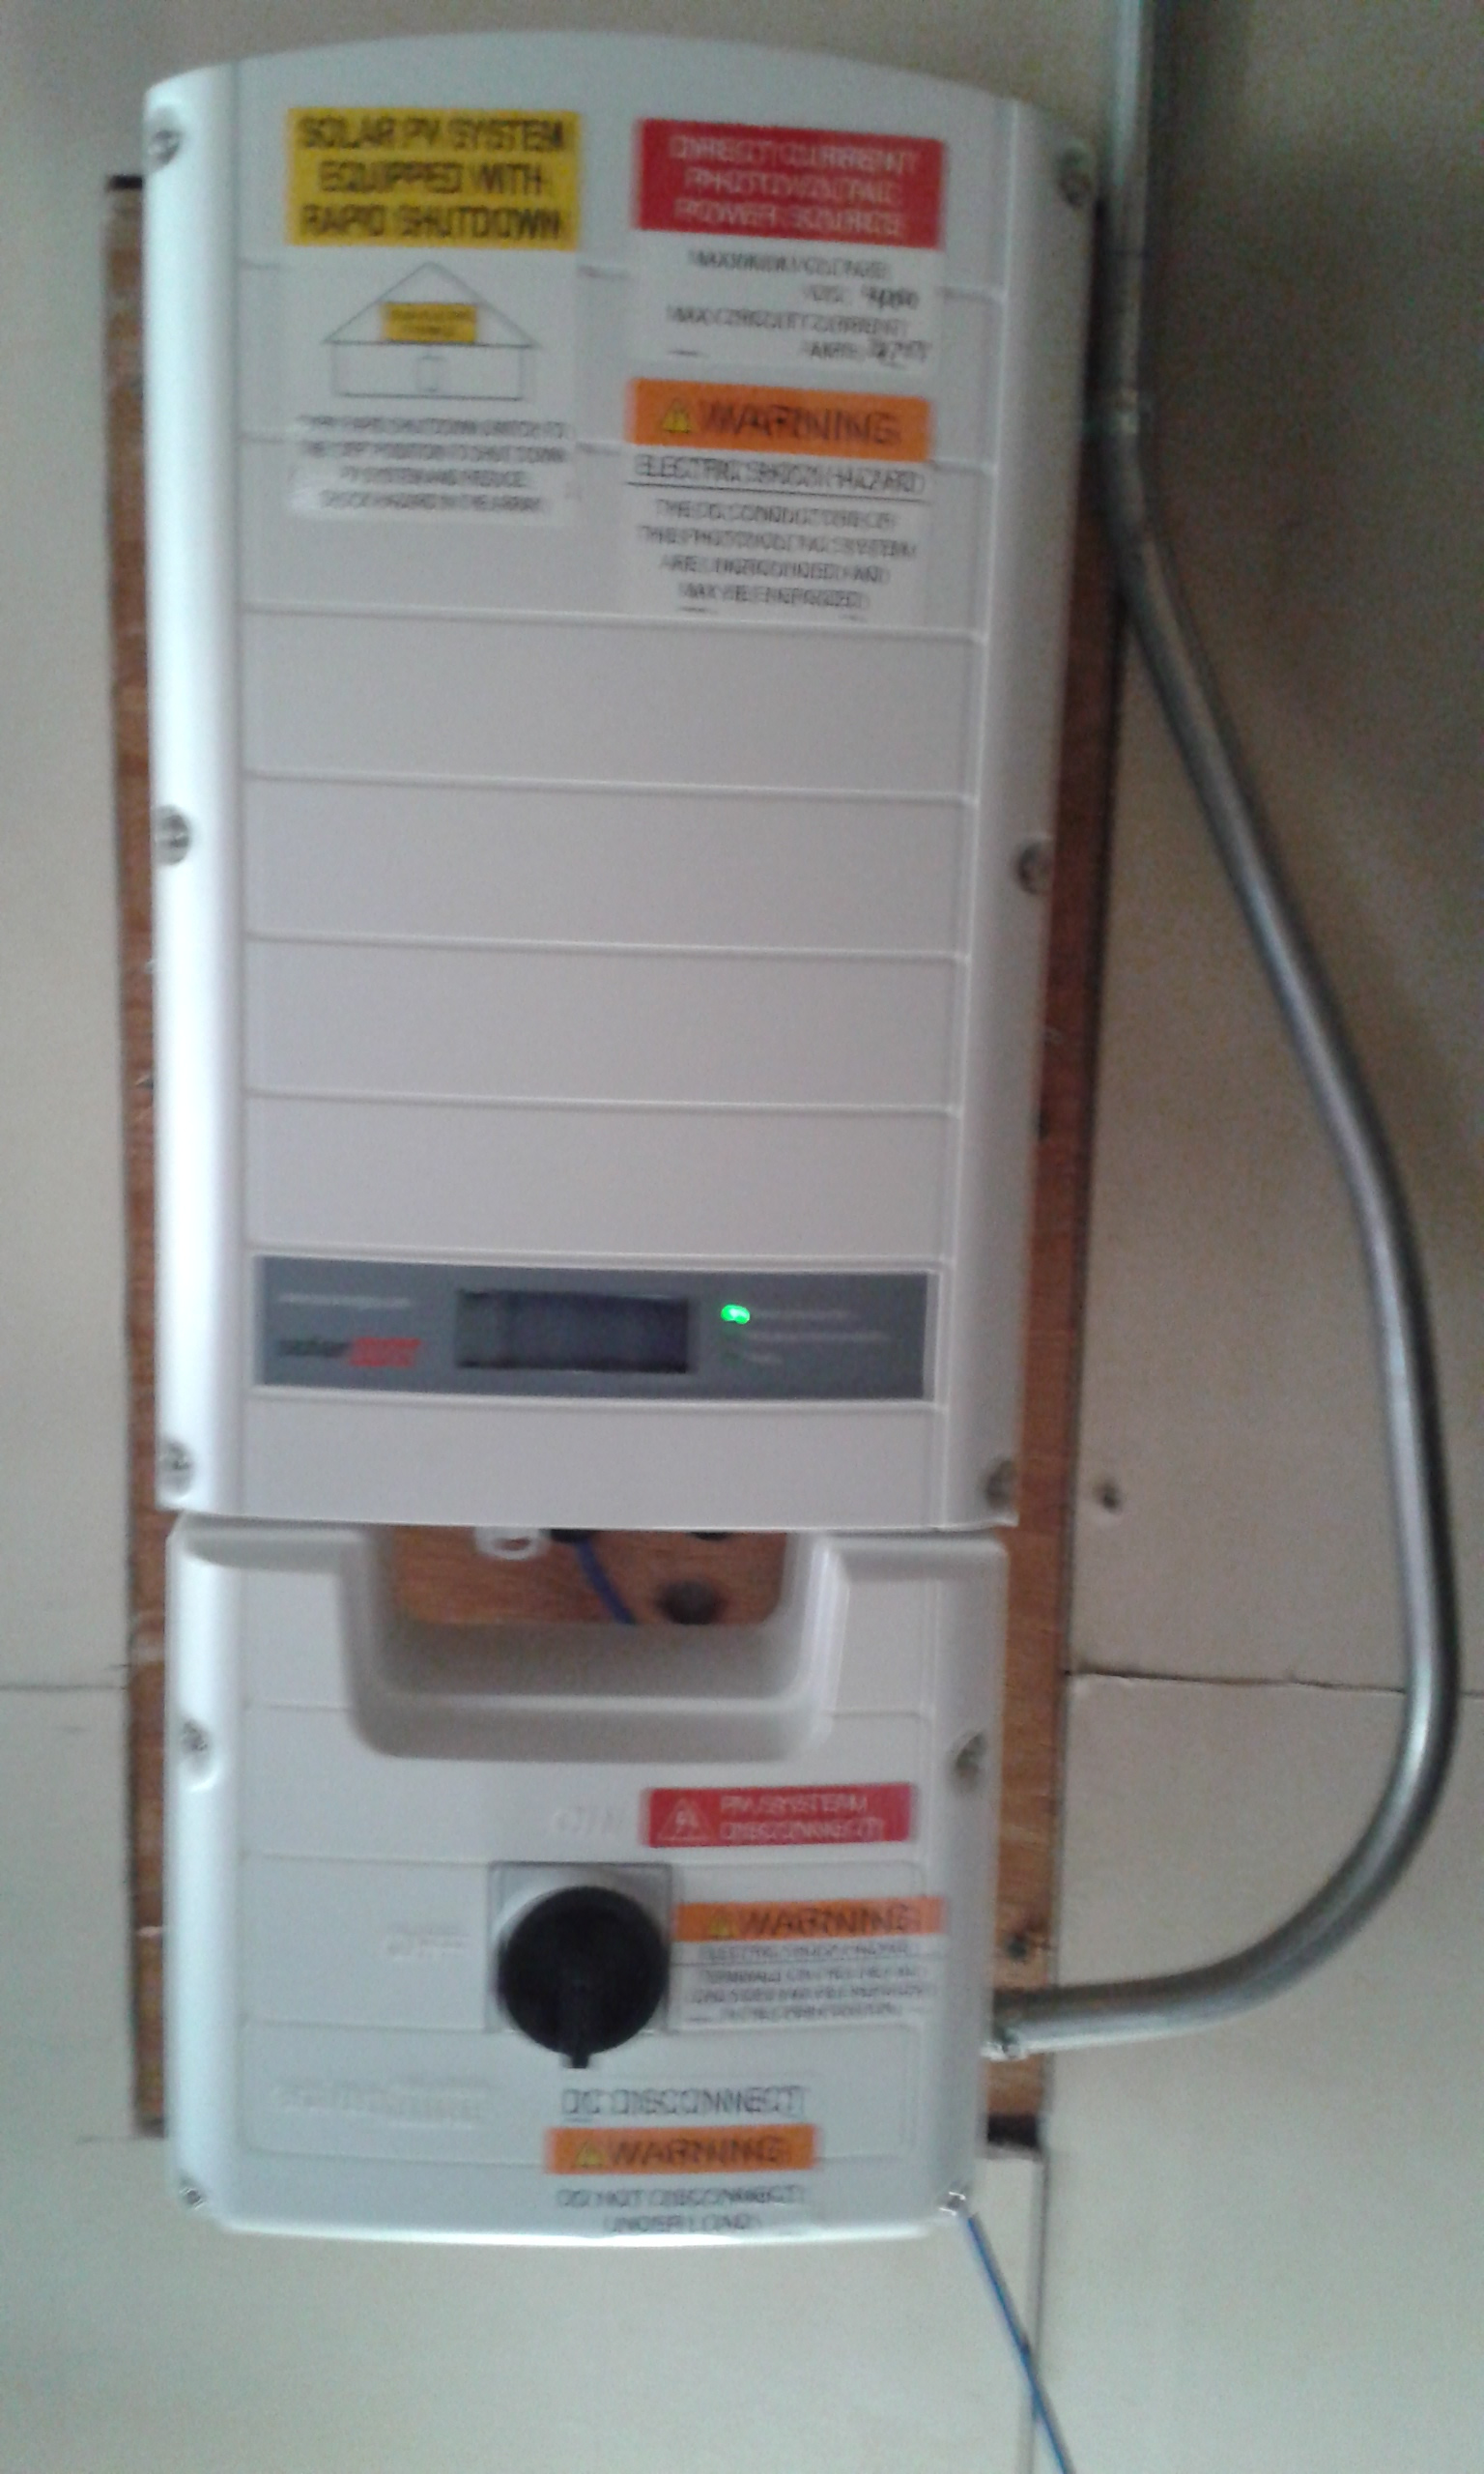 This shows the back of the inverter where the AC is going towards the AC disconnect switch. There are many punch out holes in the inverter, so there could be other locations for the AC. This is a very short piece (couple inches) of conduit that just goes into the wall. Then the AC electrical (line side) goes from the main meter box to the AC switch.
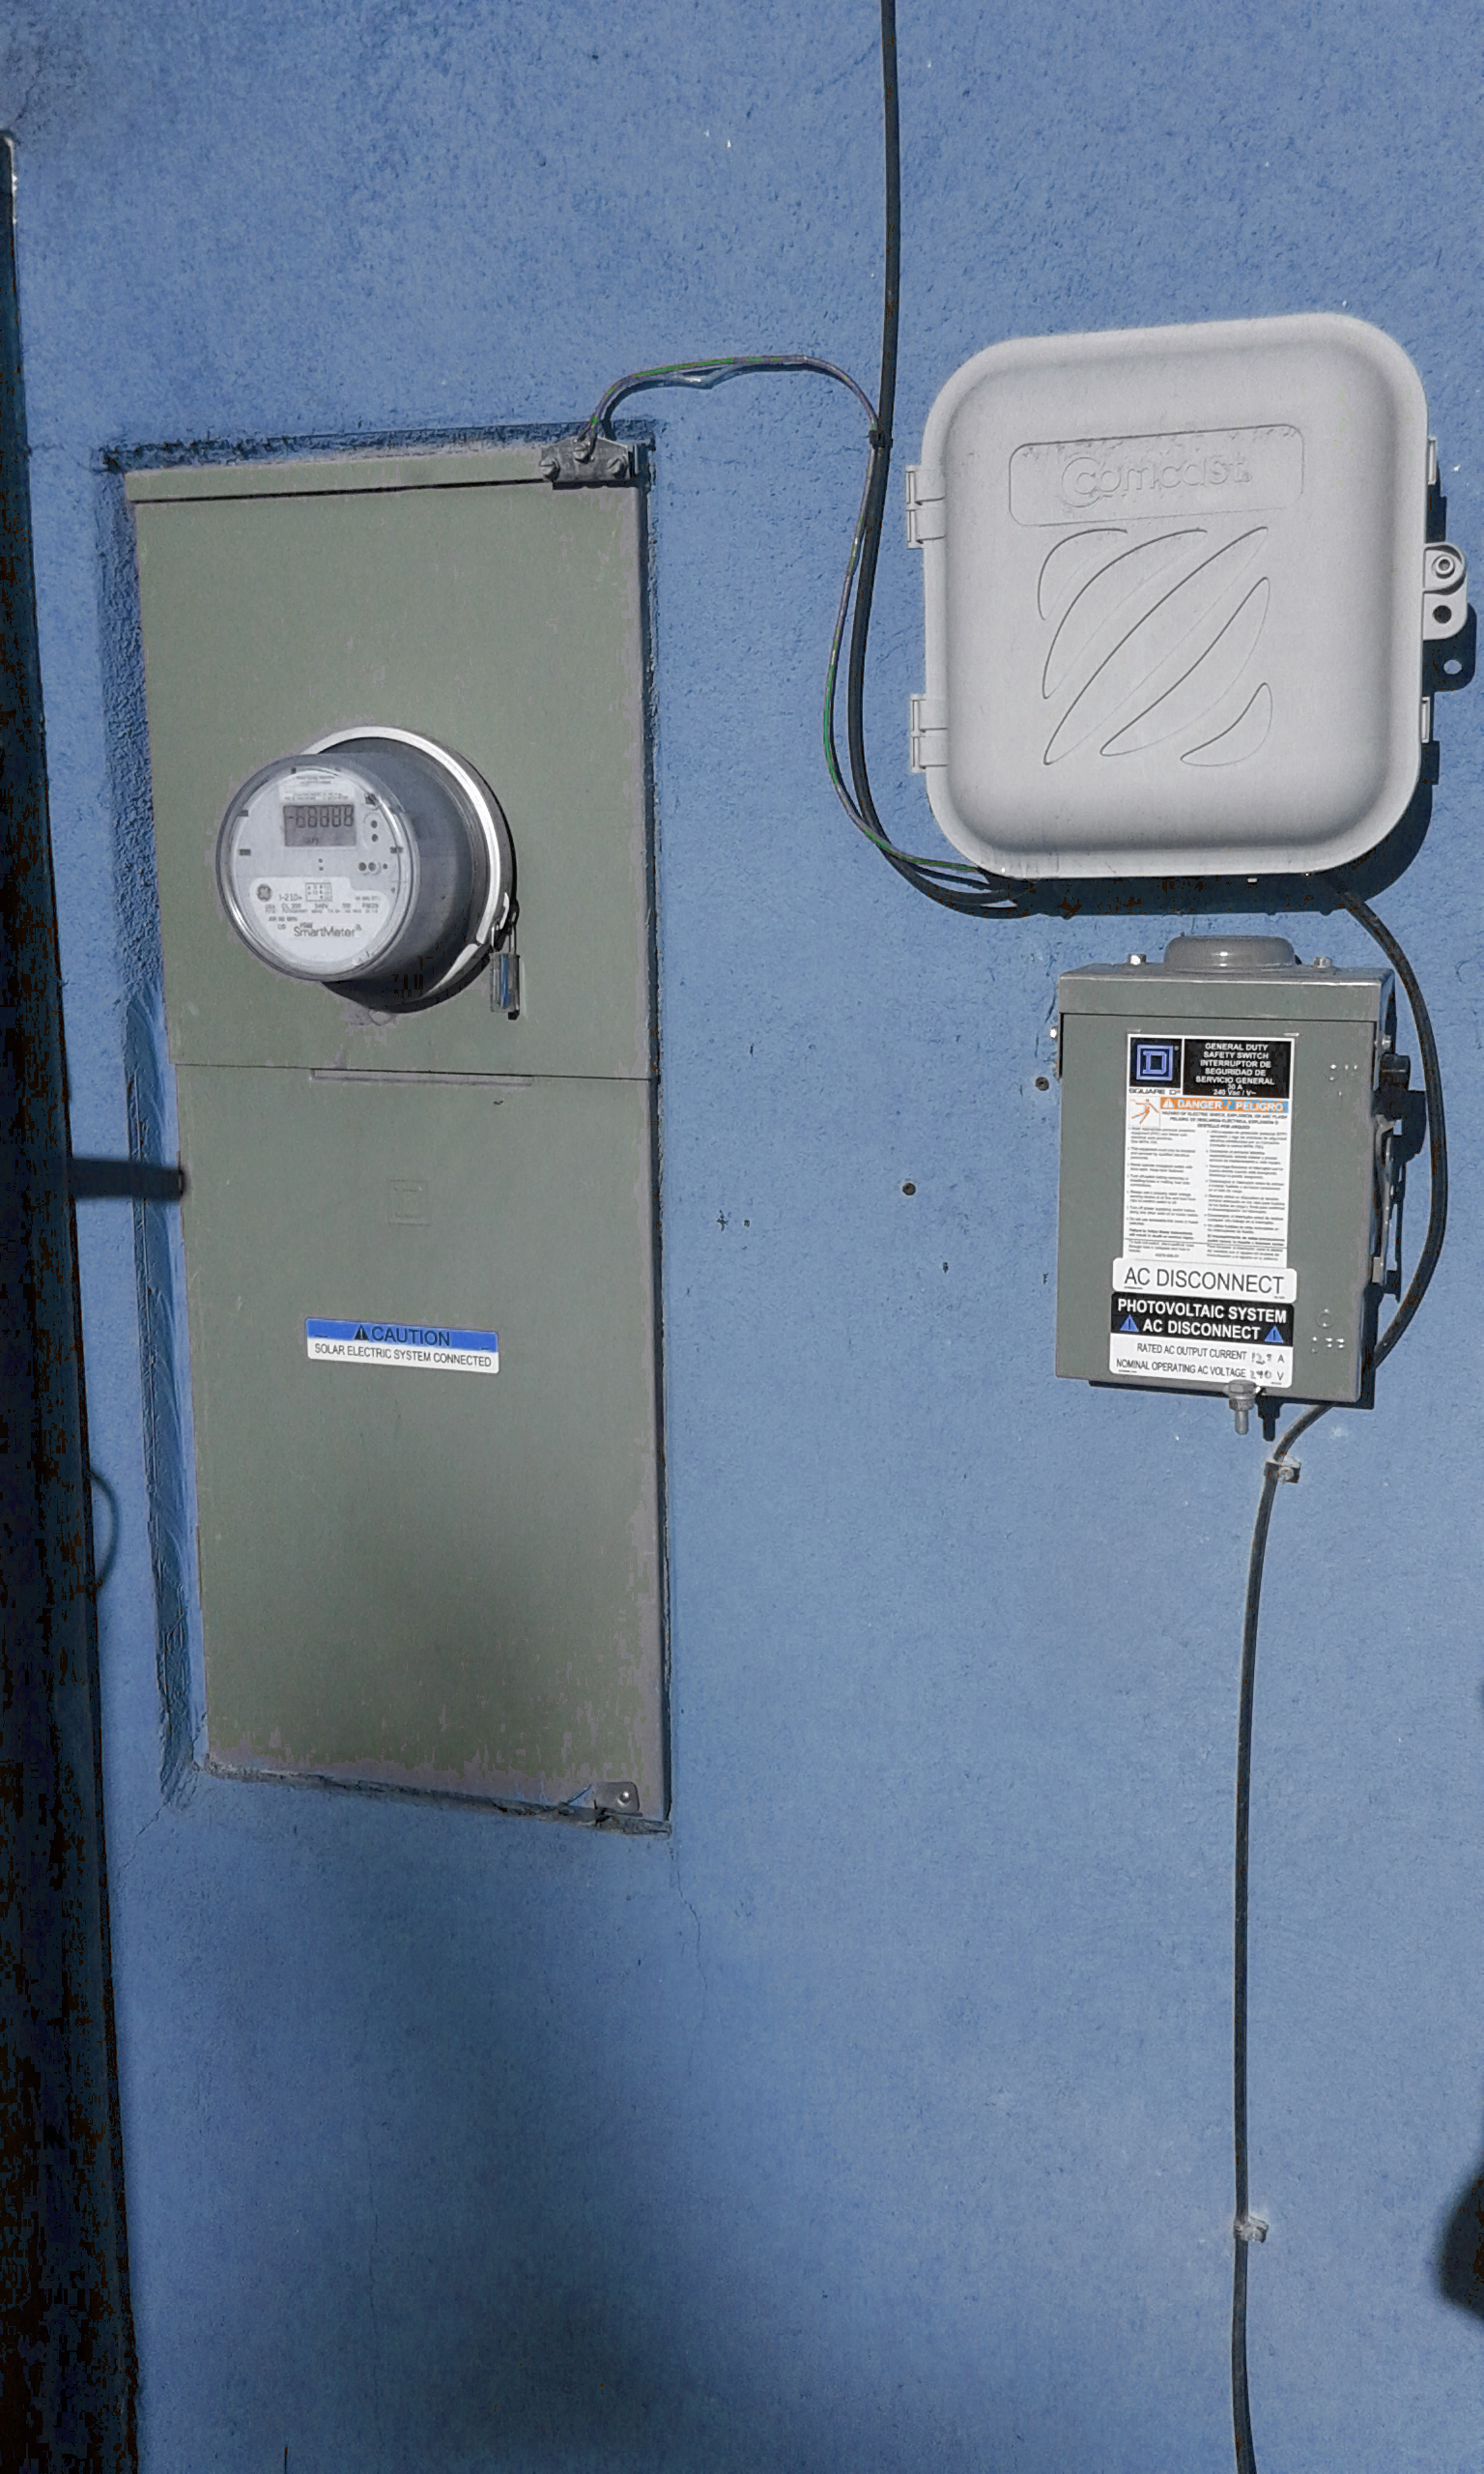
 The AC disconnect to the solar must be on the outside of the house. I had to move the cable box and I basically moved it without changing the wires much. I had some difficulty finding two breakers that are required for this system. There was one that was empty, and eventually I discovered another that we were not using. At first I was thinking that two were not available, which would have required running a subpanel.
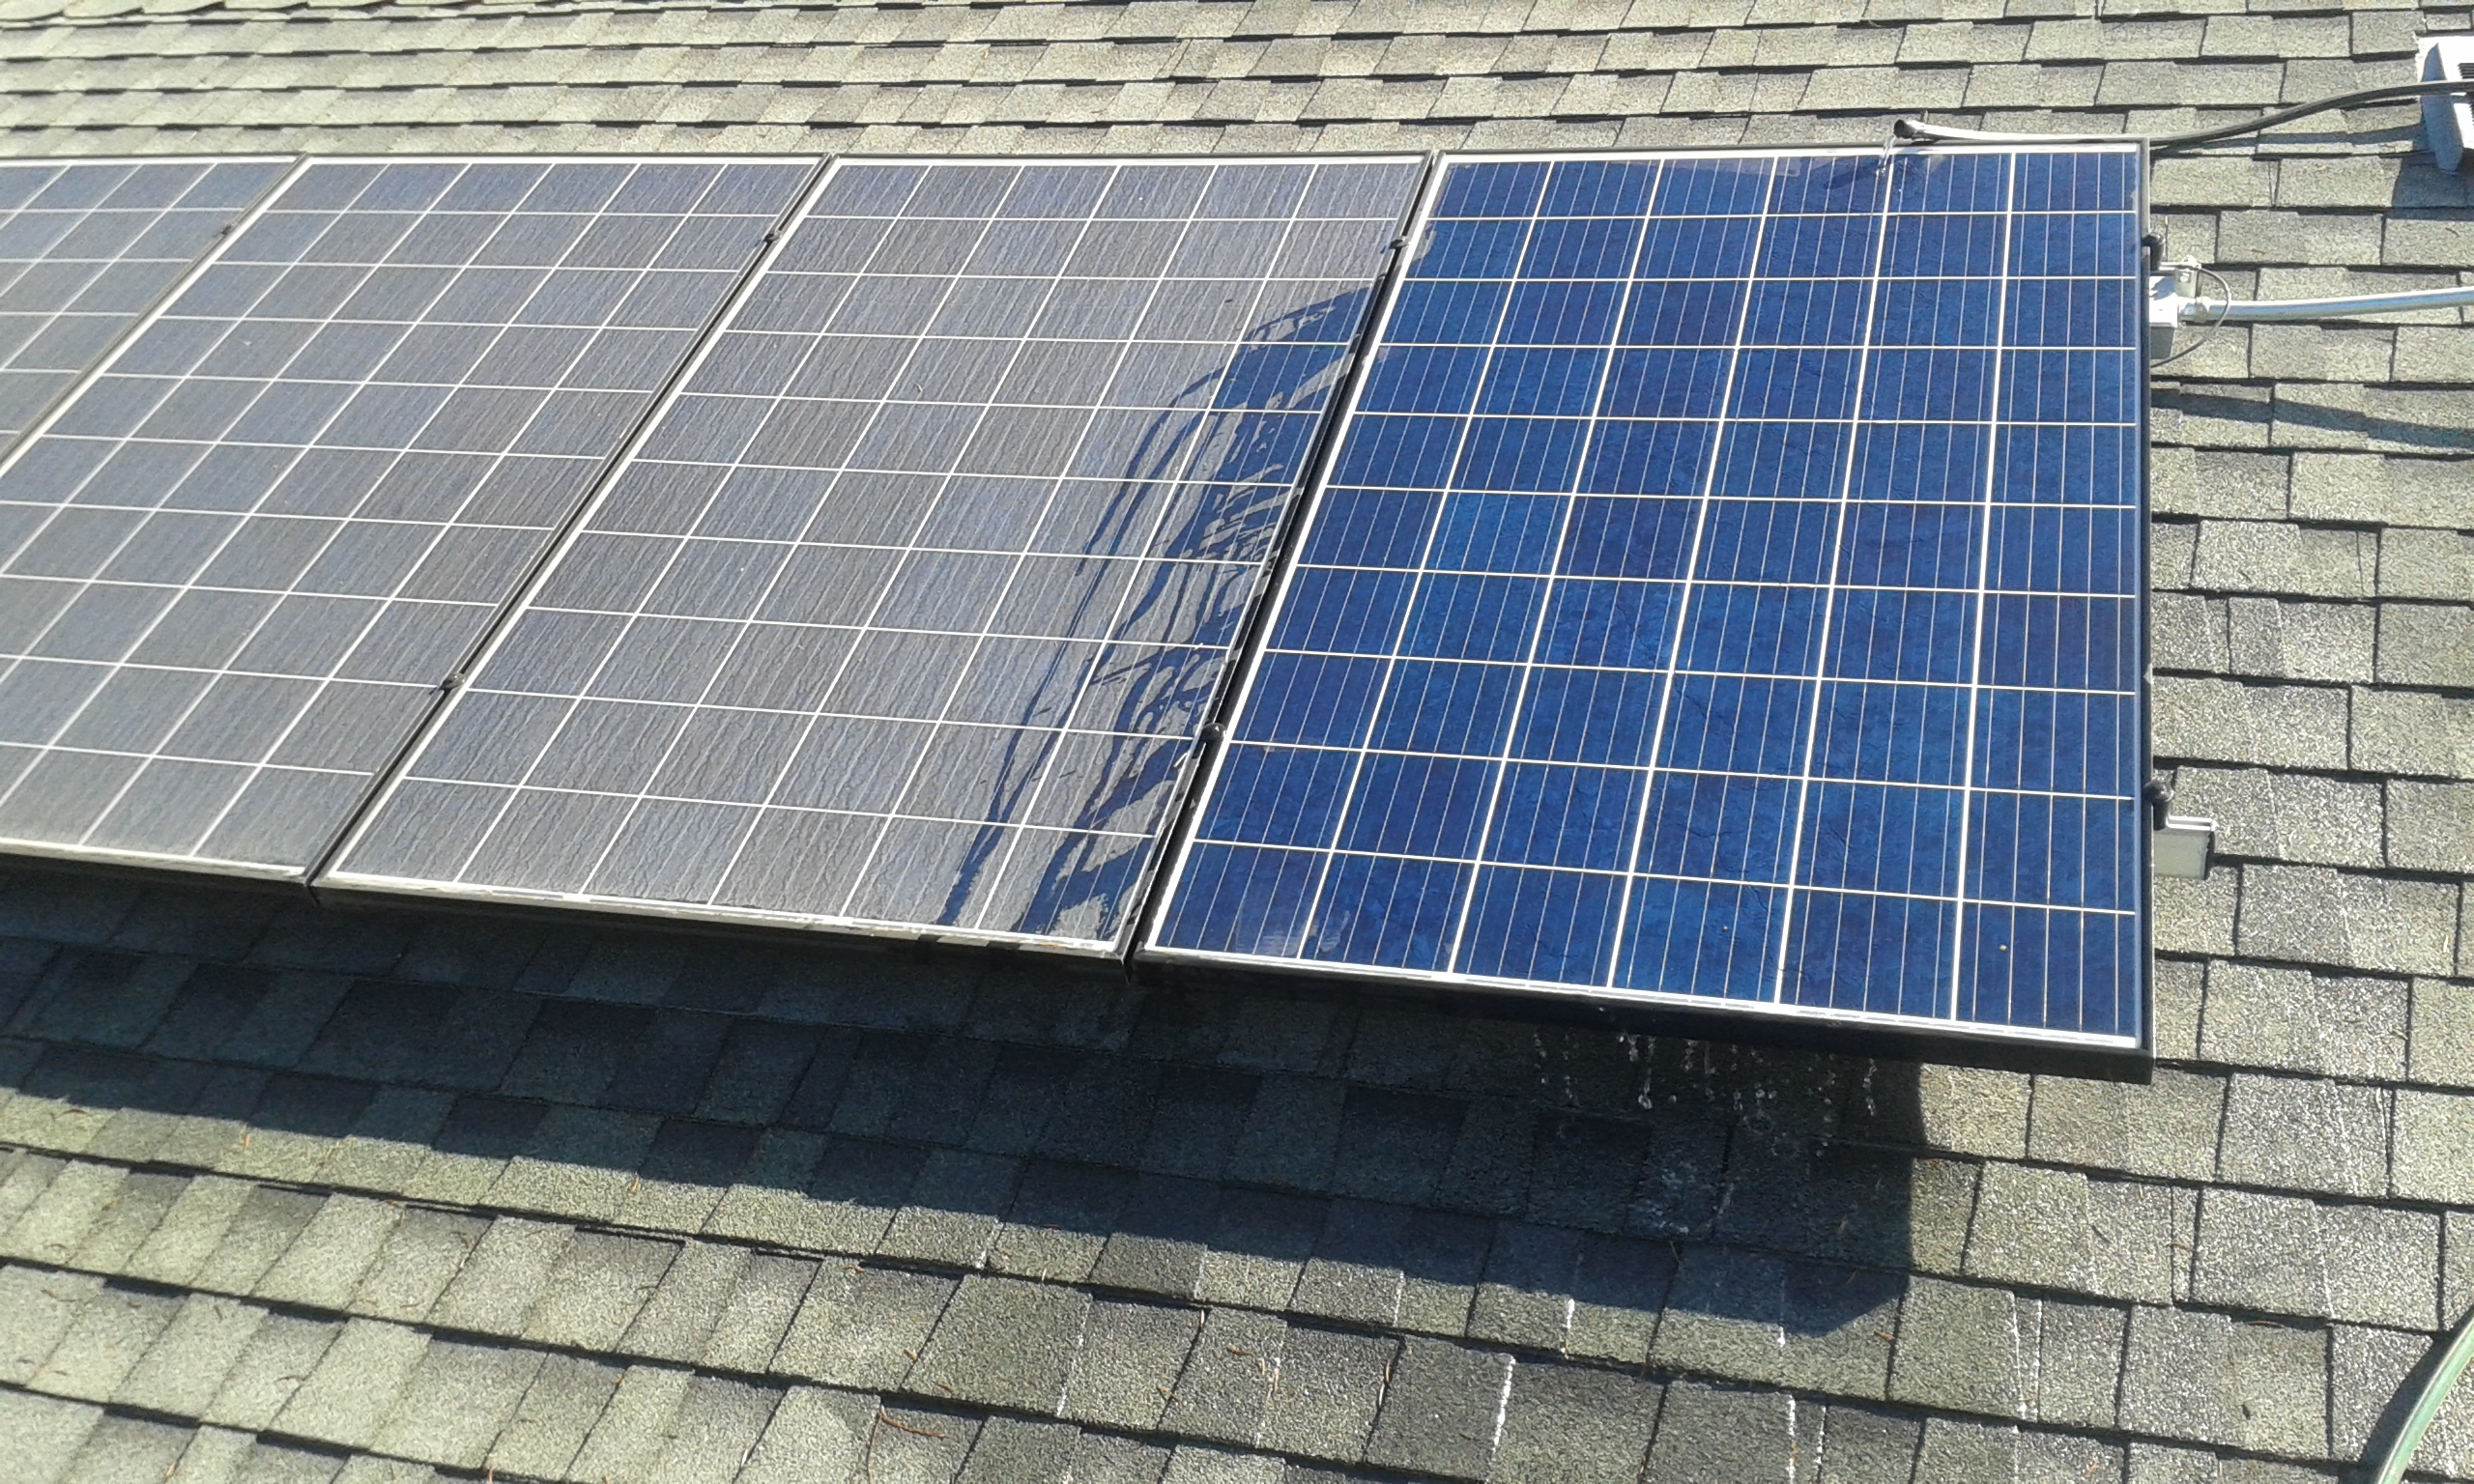
The second year was interesting since I cleaned the panels in August, but
there were forest fires causing smog between August 18 and reducing in September causing reduced generation.
If you have any questions or comments, please let me know.
A good summary may take some time because the system has been used such a short amount of time. Wait till next time.
