Kubernetes deployment strategies
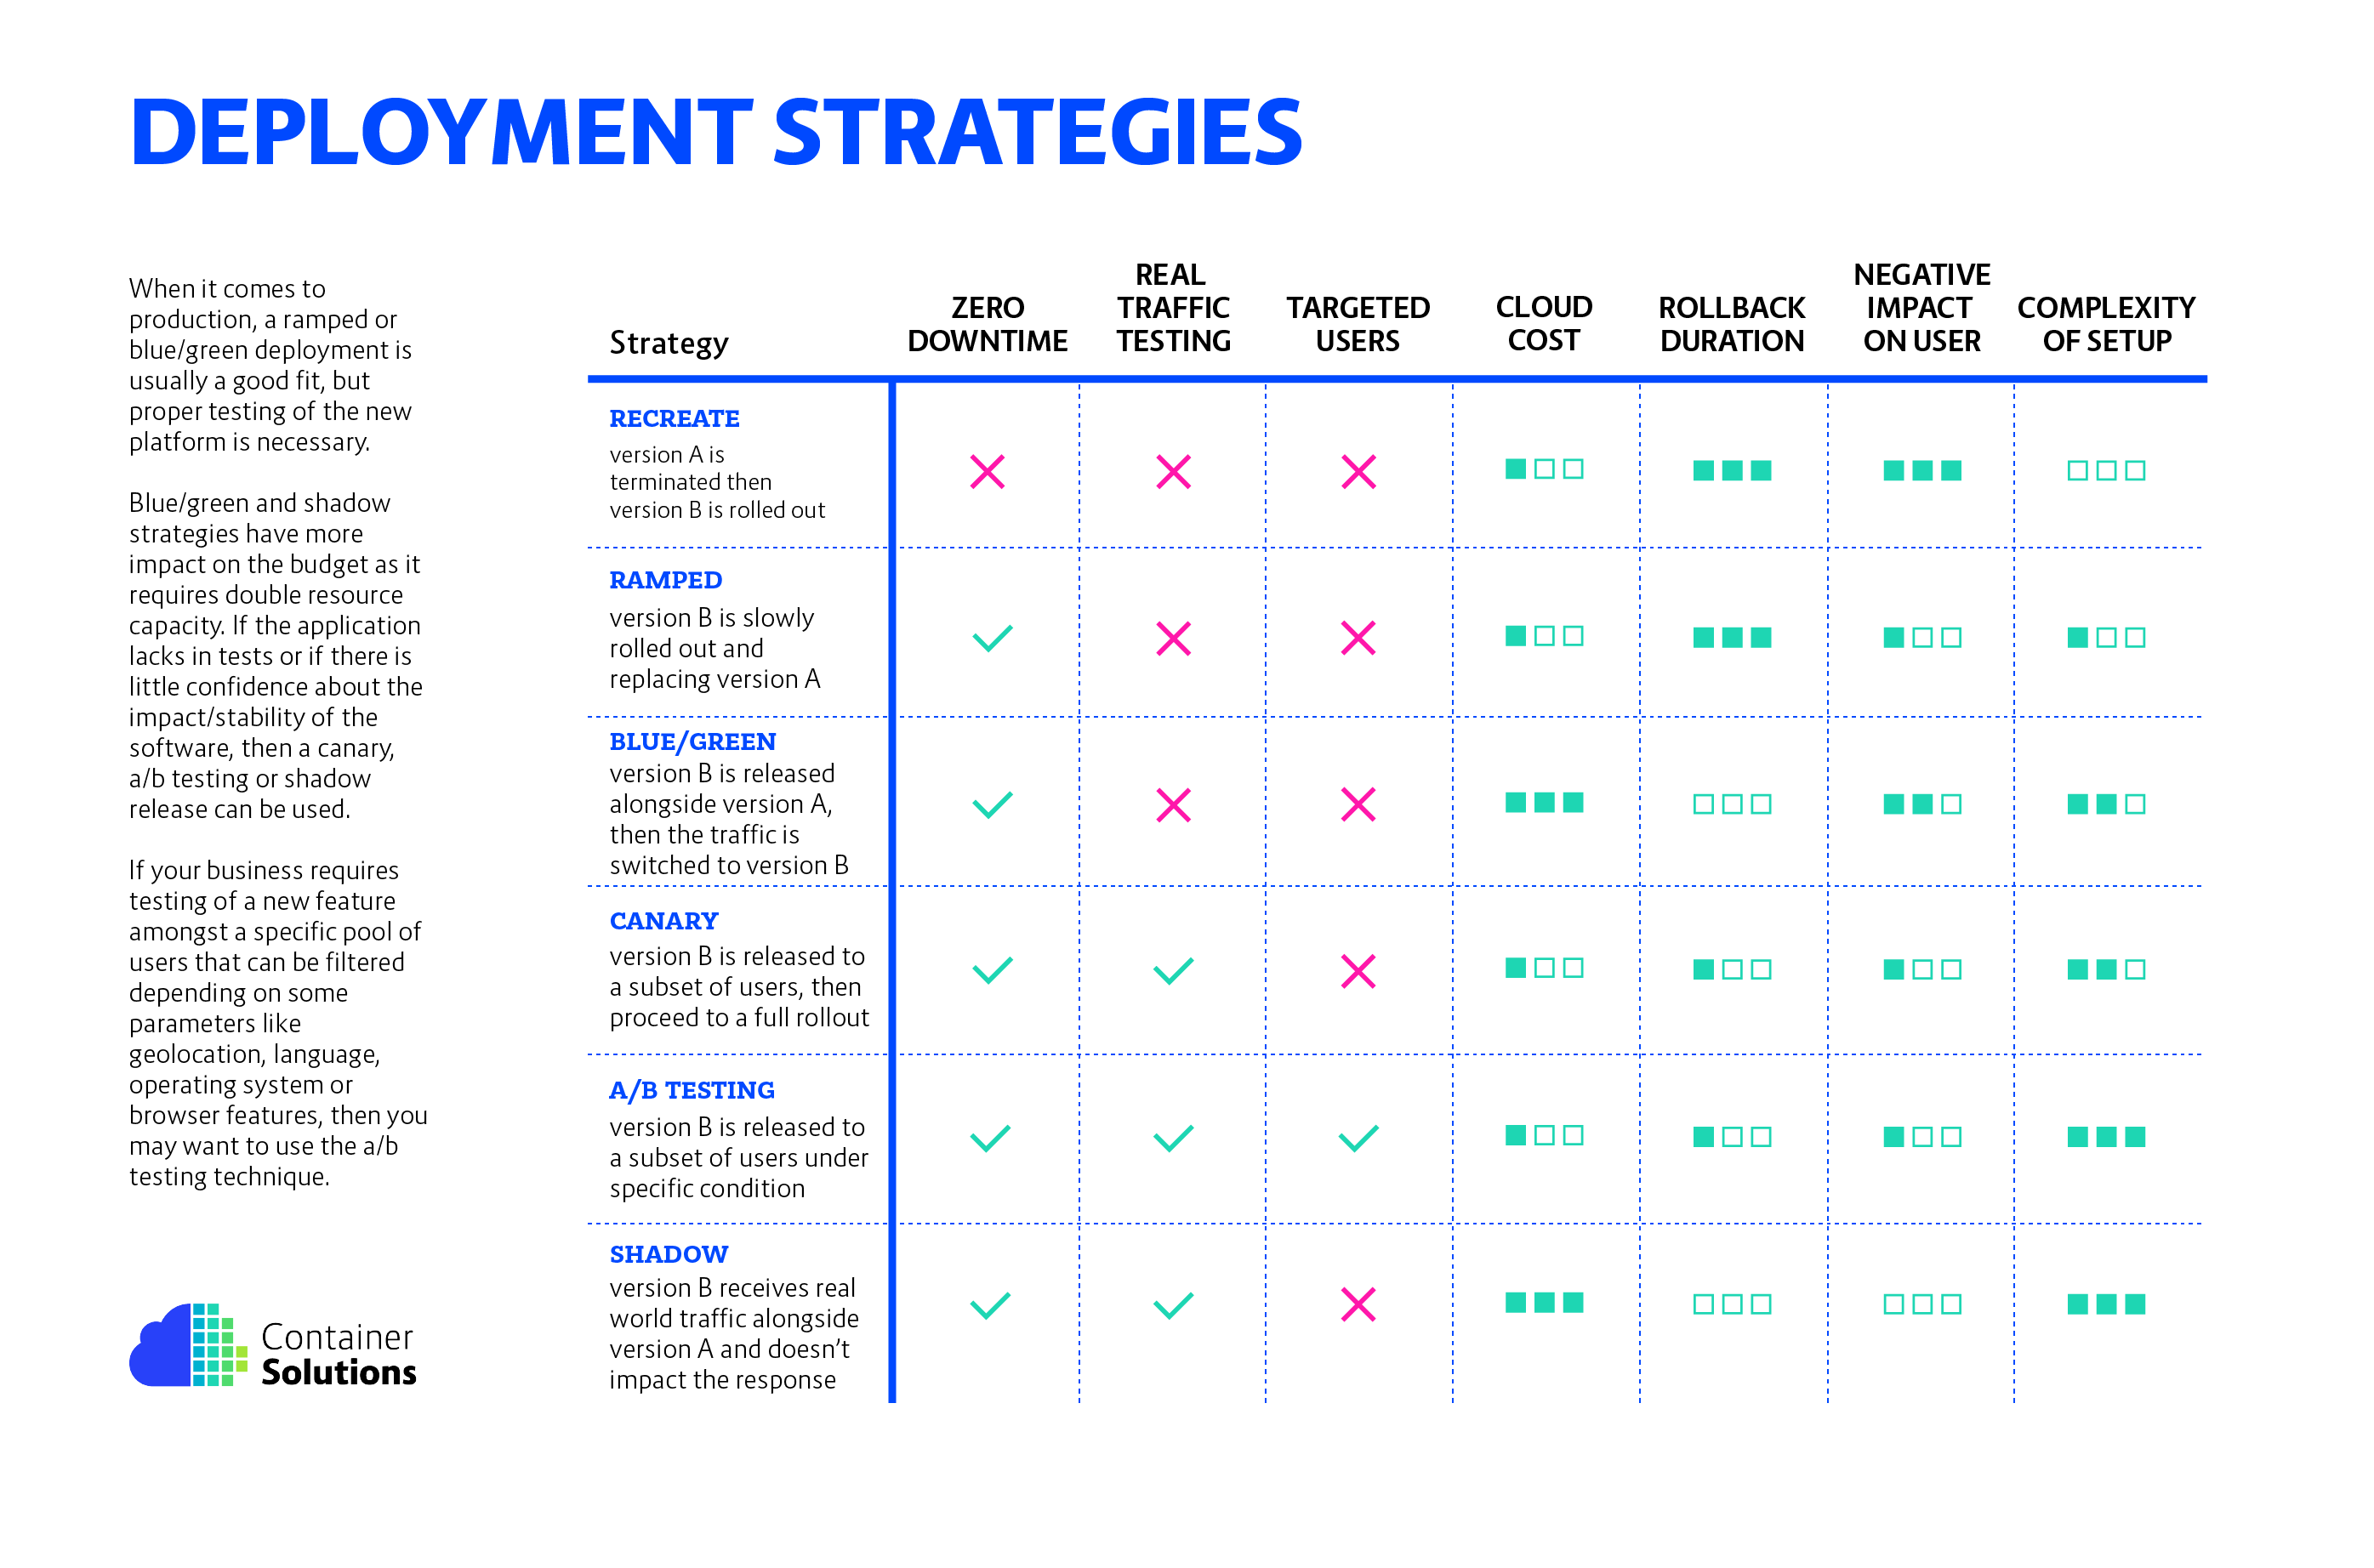
In Kubernetes there is few different way to release an application, you have to carefully choose the right strategy to make your infrastructure resilient.
- recreate: terminate the old version and release the new one
- ramped: release a new version on a rolling update fashion, one after the other
- blue/green: release a new version alongside the old version then switch traffic
- canary: release a new version to a subset of users, then proceed to a full rollout
- a/b testing: release a new version to a subset of users in a precise way (HTTP headers, cookie, weight, etc.). This doesn’t come out of the box with Kubernetes, it imply extra work to setup a smarter loadbalancing system (Istio, Linkerd, Traeffik, custom nginx/haproxy, etc).
- shadow: release a new version alongside the old version. Incoming traffic is mirrored to the new version and doesn't impact the response.
Before experimenting, checkout the following resources:
- CNCF prensentation
- CNCF prensentation slides
- Kubernetes deployment strategies
- Six Strategies for Application Deployment.
- Canary deployment using Istio and Helm
- Automated rollback of Helm releases based on logs or metrics
Getting started
These examples were created and tested on Minikube running with Kubernetes v1.10.0.
$ minikube start --kubernetes-version v1.10.0 --memory 8192 --cpus 2
Visualizing using Prometheus and Grafana
The following steps describe how to setup Prometheus and Grafana to visualize the progress and performance of a deployment.
Install Helm
To install Helm, follow the instructions provided on their website.
$ helm init
Install Prometheus
$ helm install \
    --namespace=monitoring \
    --name=prometheus \
    --version=7.0.0 \
    stable/prometheus
Install Grafana
$ helm install \
    --namespace=monitoring \
    --name=grafana \
    --version=1.12.0 \
    --set=adminUser=admin \
    --set=adminPassword=admin \
    --set=service.type=NodePort \
    stable/grafana
Setup Grafana
Now that Prometheus and Grafana are up and running, you can access Grafana:
$ minikube service grafana
To login, username: admin, password: admin.
Then you need to connect Grafana to Prometheus, to do so, add a DataSource:
Name: prometheus
Type: Prometheus
Url: http://prometheus-server
Access: Server
Create a dashboard with a Graph. Use the following query:
sum(rate(http_requests_total{app="my-app"}[5m])) by (version)
To have a better overview of the version, add {{version}} in the legend field.
Example graph
Recreate:
Ramped:
Blue/Green:
Canary:
A/B testing:
Shadow:


