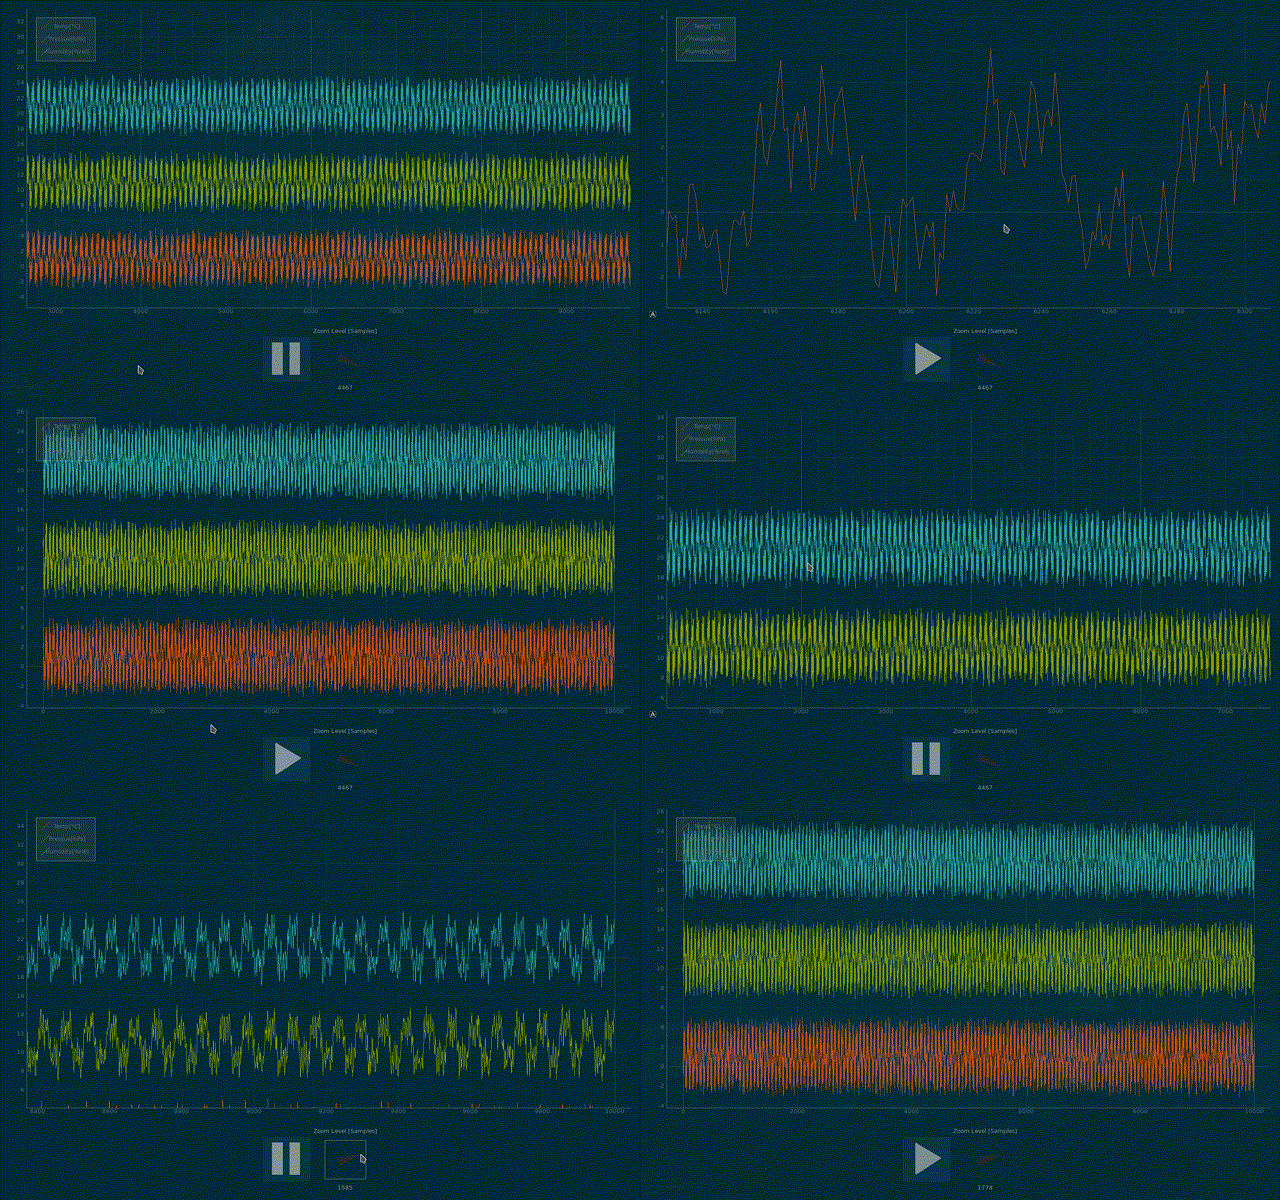
- Ever wanted to inspect some sensor data captured by your arduino or other embedded system in realtime?
- Ever wanted to fine-tune a PID controller but couldn't understand why it keeps oscillating?
- Ever wanted to have a look at some recored .csv data but $YOUR_SPREADSHEET_APP can't zoom in using your mouse?
plotty might just be what you've been looking for.
To have a quick look at plotty, just clone the repo and make sure you've installed the dependencies listed below. Then start plotty in simulation mode:
$ cd plotty
$ python main.py
- Move the plott area with your left mouse button.
- Zoom into details with your mouse wheel.
- Fancy X- and Y-axis zooming with your right mouse button - try it and get addicted!
- Reset to normal by clicking on the small "A" at the bottom left if you got lost in your data ;)
To make plotty plot real life data generated by your dev-board, just dump the data continuously as space-separated float values through your serial debug shell using some code on the embedded side like this:
printf("%f %f %f\n", valueA, valueB, valueC);In the plotty directory, edit config.json to suit your needs:
{
    "inputStream": "simulation",
    "baud": 921600,
    "sampleRate": 1000,
    "bufferSize": 10000,
    "theme": "solarizedDark",
    "channels":
    [
        {"legend": "Temp[°C]",       "color": "orange"},
        {"legend": "Pressue[hPa]",   "color": "green"},
        {"legend": "Humidity[%rel]", "color": "cyan"}
    ]
}- Replace
"simulation"with your actual serial data source for example"/dev/ttyUSB0"on Linux or"COM3"on Windows. - The
"baud"-rate has only to be specified correcly on Windows. "sampleRate"is the number of lines you transmit per second."bufferSize"is the depth of data buffer of each channel. Reduce this, if your PC is to slow..."theme"specifies the theme. CurrentlysolarizedDarkandsolarizedLightare available out of the box.- In the
"channels"section, you specifiy the"legend"-string to be printed in your plot and the"color"of the plotted line (for each channel).
You can add or remove channels to suite your needs by adding or removing lines from the "channels" list.
Currently, the following colors are supported: yellow, orange, red, magenta, violet, blue, cyan, green.
Creating own themes is easy as well: Just duplicate one of the theme.json files within the /themes folder
and change the RGB values to your wishes.
Then add the name of the new theme to the config.json like this
(just add the name of the theme without the .json extension):
...
    "theme": "myTheme"
...
If you just want to have a look at a huge set of static data like an exported .csv file, just point to the file:
...
    "inputStream": "./testdata.csv"
...
NOTE: To plot files, the data has to be space separated floating point values. Make sure to not have more values per line than channels configured in your config.json.
- python3
- pyqtgraph
- pyqt4
- numpy
- pyserial (required on Windows only)
- Ethan Schoonover for creating the famous solarized color pallete
- Luke Campagnola for pyqtgraph
