This repo is implemented according to the methodology described in paper Stock Embeddings Acquired from News Articles and Price History, and an Application to Portfolio Optimization.
The goal is to construct embeddings for a set of selected US stocks, which represents a given ticker by a numeric vector. The concept of embedding is popular in Natural Language Processing (NLP) and is the fundamental building block for any Large. Language Model (LLM).
Once a set of vector representations is learnt for selected stocks, we can use the learnt embeddings for any downstream task. Follow the paper, a quartratic programming portfolio optimization is implemented using the stock covariance matrix based on the embeddings.
If you find this repo useful, please star it to help others find it! It is also the only way I can tell how useful it is to the open source community.
There are two types of data used in this repo.
-
News data from Reuters and Bloomberg from 2006 to 2013. The data from original repo is no longer available, but you can email the author for the dataset for your own research.
However, if you have a request about it, send it to me at premy.enseirb@gmail.com and put the words "bloomberg dataset" in your email body.
Note that the Reuters data shared above only has title, so I only used the Bloomberg data.
-
For complete Reuters data, you can find here.
-
Stock price data is fetched based on the popular Python package
yfinance.
The paper used a dual-vector representation of news article texts, namely, the TFIDF-weighted word embedding and BERT encoder for news title. In this repo, I used Fasttext to train word embeddings based on entire news article collections f or TFIDF-weighted embedding and used sentence_transformers package instead to encode the article title.
The target variable the daily stock price movement. The daily log return > 0.0068 is labeled as 1 and daily log return < -0.0059 is labeled as 0.
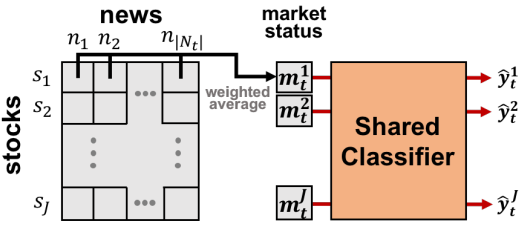
The stock price movement prediction is considered a very difficult problem, if we only include news article strictly before the price date. However, if we include the news for the same price date, this problem is more reasonable as the goal is to learn the embedding vector rather than making a good stock price movement preditive model. Therefore, the news of same price date and 4 days prior (total 5 days of news) are included to 'predict' the stock movement.
Motivated by the attention mechanism, for day
Finally, the market vector for stock
To predict the stock movement, we need the most re
cent 5 days market vectror collection
The optional temporal re-weighting method is also implemented.
I followed the backtest method proposed in the paper, i.e., randomly partition the data into training and validation set. However, instead having training, validation, and test set, I only partitioned the data into training and test set because I didn't need to tune the model.
Following plot summarizes the model out-of-sample prediction accuracy. The y label is the training data period, and the out-of-sample period is 1 year right after the training period. The results are highly comparable to the results in the paper.
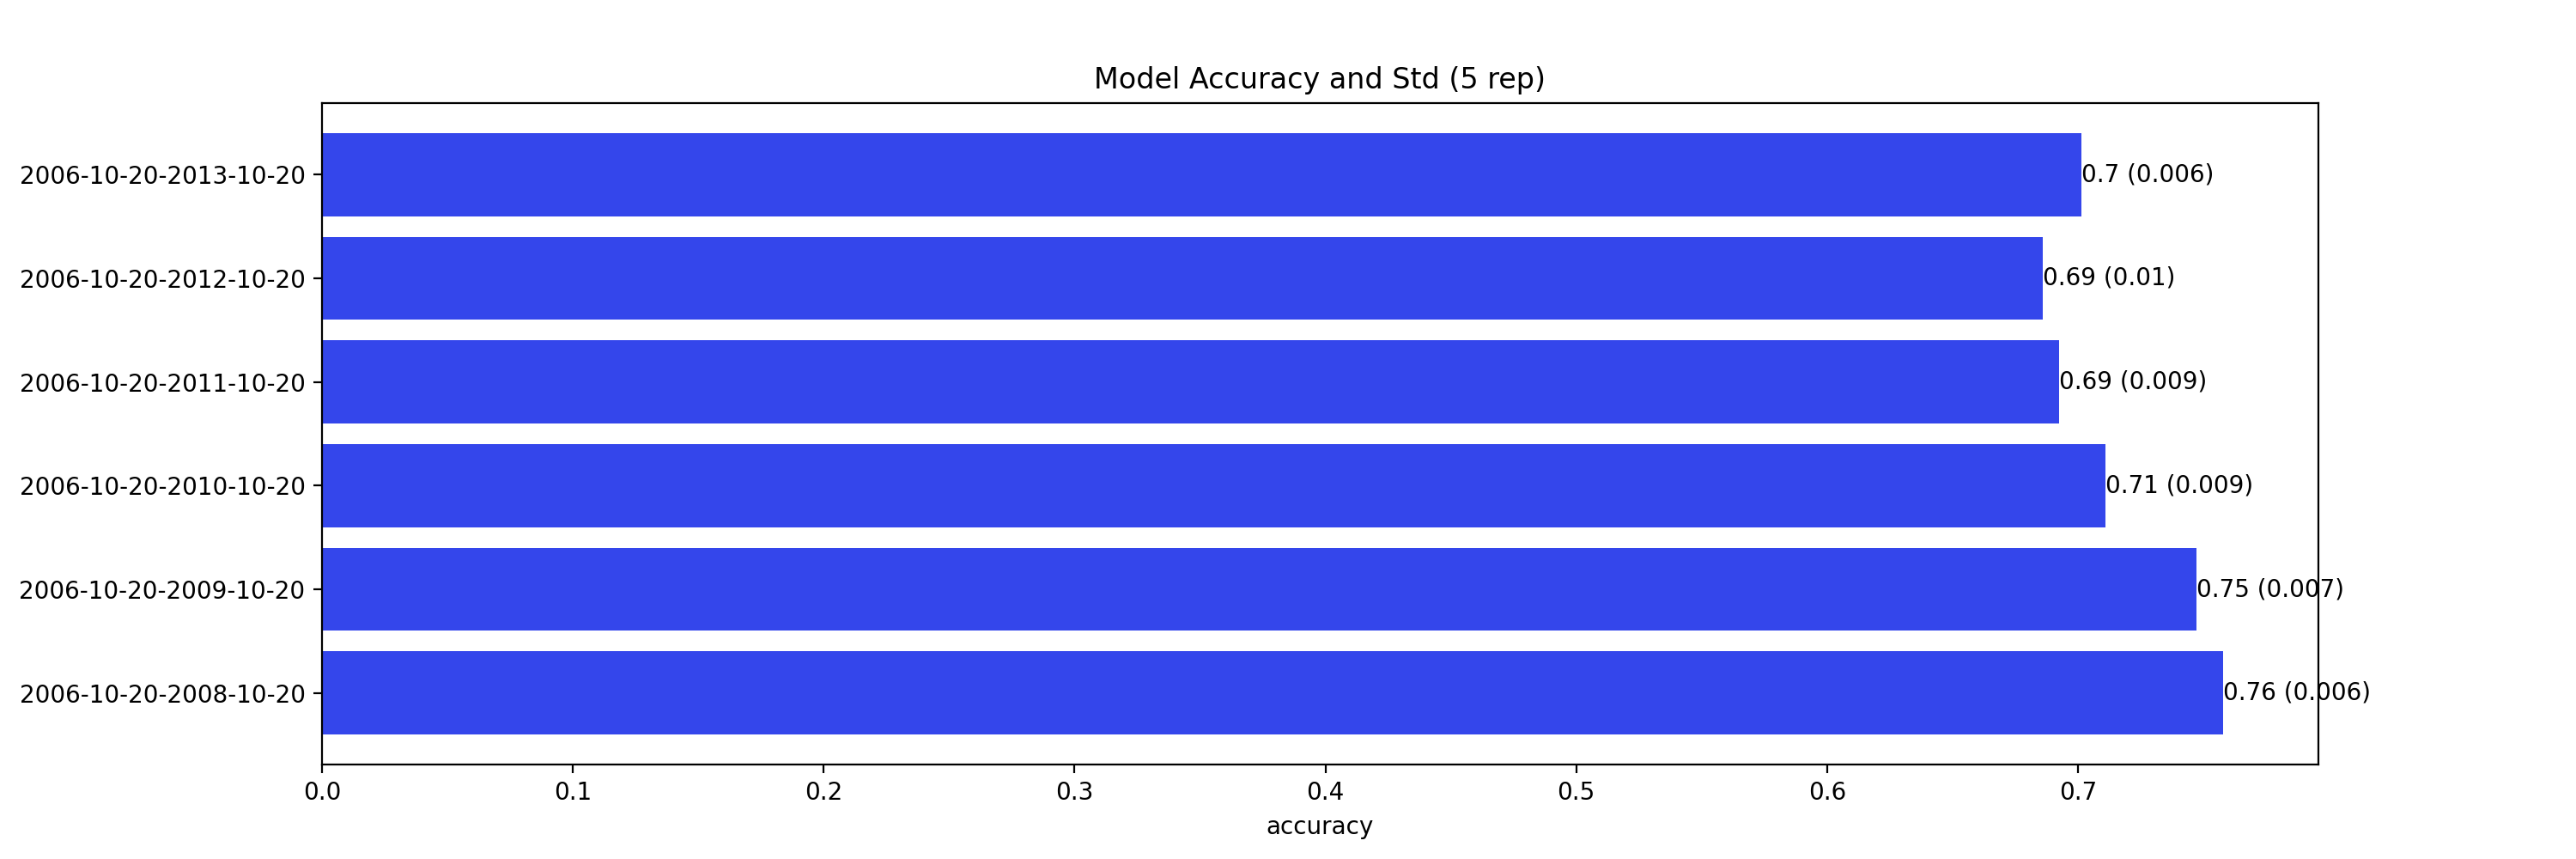
Note that this is a predition problem involving time series. Therefore, the random partition is NOT the proper approach (70% prediction accuracy is too good to be true for stock prediction) if our main focus is the prediction accuracy. A partition by time is more suitable to avoid look ahead bias if we want to test the true prediction accuracy. However, we care about stock embedding and the only use the out-of-sample accuracy to ensure we have a reasonably good model performance so we know the embeddings are trustworthy.
The paper used the embedding for portfolio construction. The idea is to use cosine similarity as an approxy of covariance, so we can plug in the cosine similarity matrix as a covariance matrix (technically a correlation matrix) for portfolio construction.
More specifically, we want to minimize
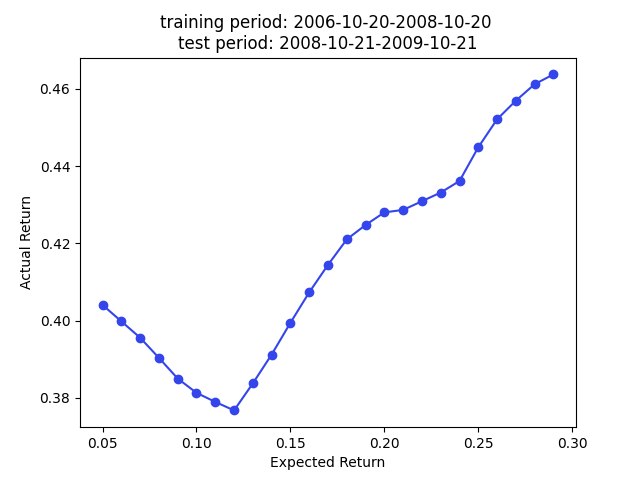
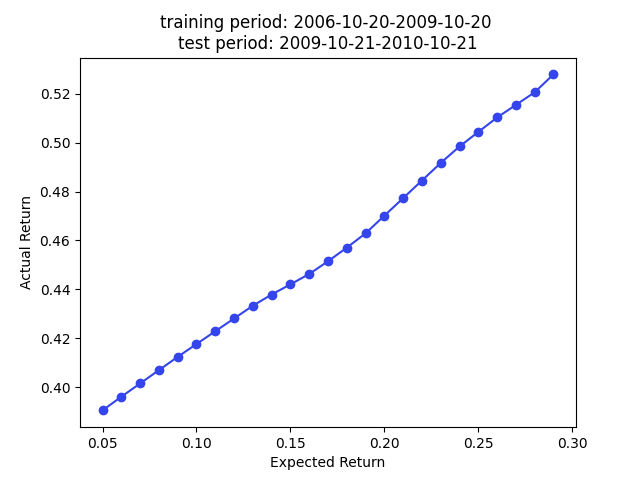
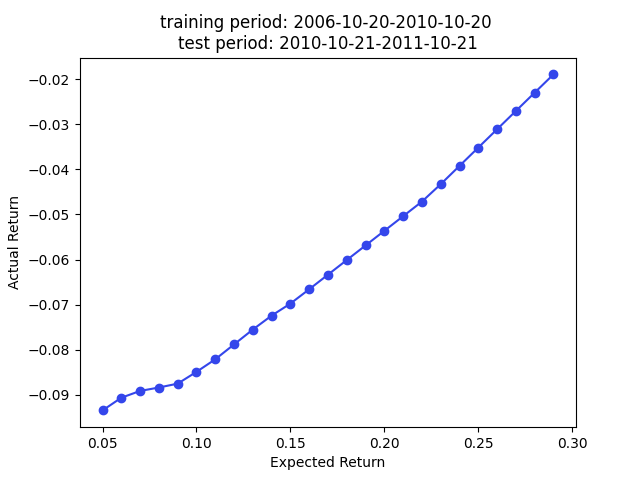
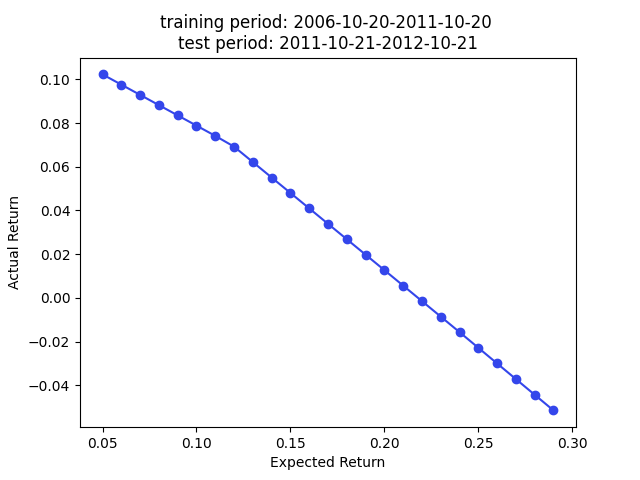
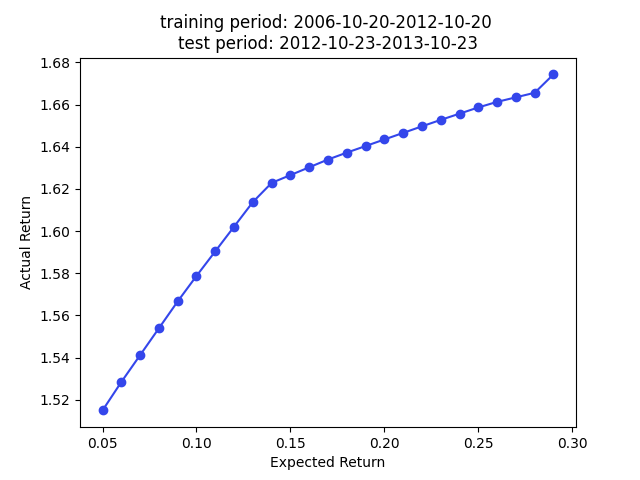
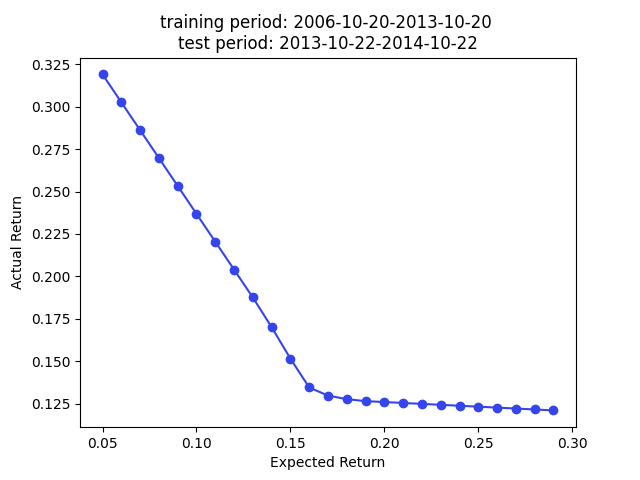
We have superior returns against s&p 500 across all expected returns in 2009, 2010, and 2013. The returns in 2014 are very good for smaller
Note that we use the cosine similarity as
The code is tested under Linux 22.04 with i9-13900kf and Nvidia 4090. It is a computation-intensive project, as it took over 30 hours to finish all the steps.
- The first step is to fetch the Ruters and Bloomberg historical news data according to the data section.
- To configure the Python environment, run
setup.sh. - Then, you should update the env vars and other parameters according to your hardware in
run.sh. - Run
run.sh.
