BeatWise is a data visualization platform that uses machine learning to ‘guess’ what a user was doing during the day, based only on a users continuous heartbeat from a Fitbit device.
Here is a breakdown of the algorithm above.
We pull heartbeat rate data from the Fitbit API using the ‘Heart Rate Intraday Time Series’. This endpoint is by whitelist only, so we had to ask permission for BeatWise to use the endpoint; and answer some questions on what the data would be used for. The endpoint output a JSON object filled with heart rate points at every minute the user was wearing their Fitbit device. Example output below;
“activities-heart-intraday”: {
        “dataset”: [
            {
                “time”: “00:00:00”,
                “value”: 64
            },
            {
                “time”: “00:00:10”,
                “value”: 63
            },
            {
                “time”: “00:00:20”,
                “value”: 64
            }
        ],
        “datasetInterval”: 1,
        “datasetType”: “second”
    }
We store these values into our database to use later.
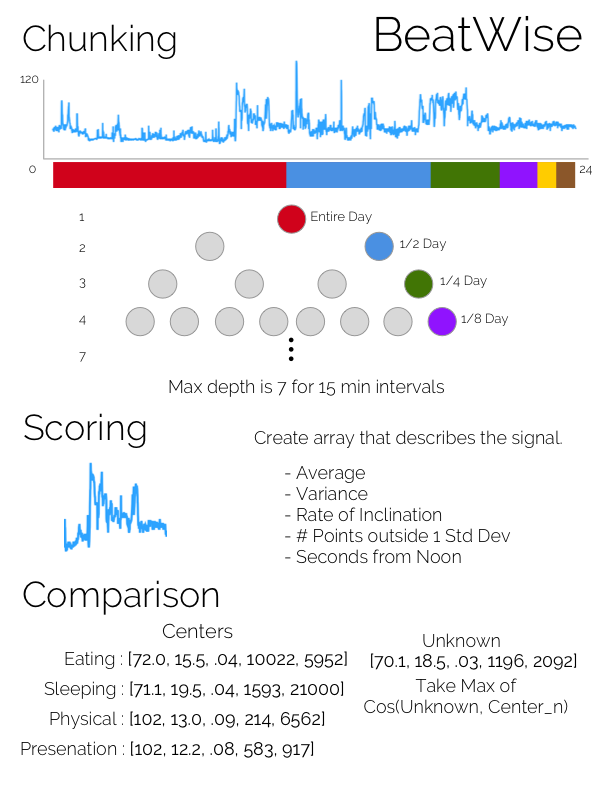
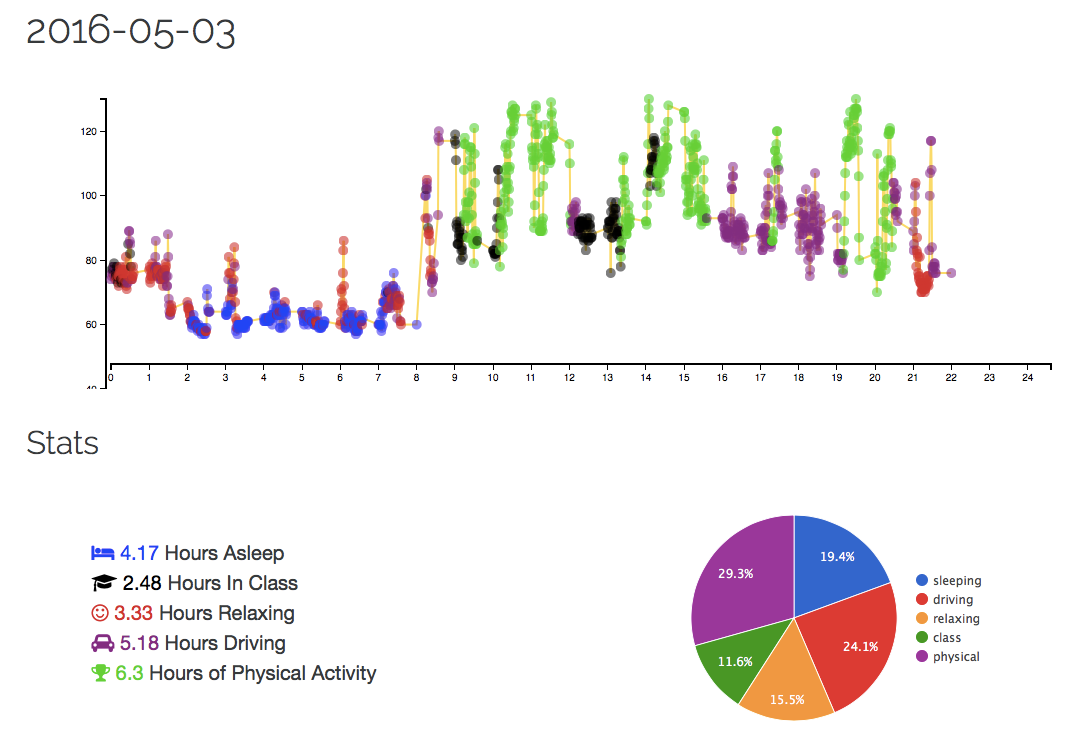
I ended up training 30,000 points, representing about a month of heartbeat data. I took notes of what I did during the day then manually assigned the Fitbit data to the events recorded. This took many hours to do, but good training data is essential when building a classifier “Crap in crap out”. After tagging the points, we looked at how much training data there was for each unique tag. We took the top 5 most frequent tags and used them as a basis for the rest of our program; Asleep, Class, Relaxing, Driving and Physical. The training process is all done offline, and the output is the array of centers.
In order to properly guess what you were doing in a time; we have to know what period of time to look at! This is not a trivial problem… The team spent a fair amount of time figuring out the best way to take an entire day and split it up into smaller chunks to compare them to the training data. At first, we were just taking really small chunks, comparing and moving on- however, as the chunks got really small (less than 5 points in a chunk) the comparison was very inaccurate. So rather than starting with really small points, we started by comparing the entire day to our centers; then splitting then splitting the day into half, rerun the comparisons on the two halves and repeat over and over. Only stop if the window gets to some really small number, OR if the next iteration’s comparison score is worse than the parents score. This gets complicated to imagine, but this creates a tree that can be used to find the node with the highest comparison score.
In order to actually do anything with this information we need a way to represent the raw data points in a way that can be compared quickly. In order to do this, we convert the series of points as an array that represents this series. We currently take 5 key scores; Average, Variance, Rate of Inclination, # Points Outside 1 Std. Dev. & Seconds from Noon. The scoring function is one of the key proponents to the algorithm. The more ways we can represent the signal, the more ways the signals can be differentiated from each other. In the future we would love to add a Fast Fourier transform function, a geolocation, and many others!
Finally, once you have two ‘chunks’, convert them into a vector space model, we have to compare these vectors. The simple ways of doing so are either; cosine or euclidean. We started with cosine, but found weighted euclidean produced better results.