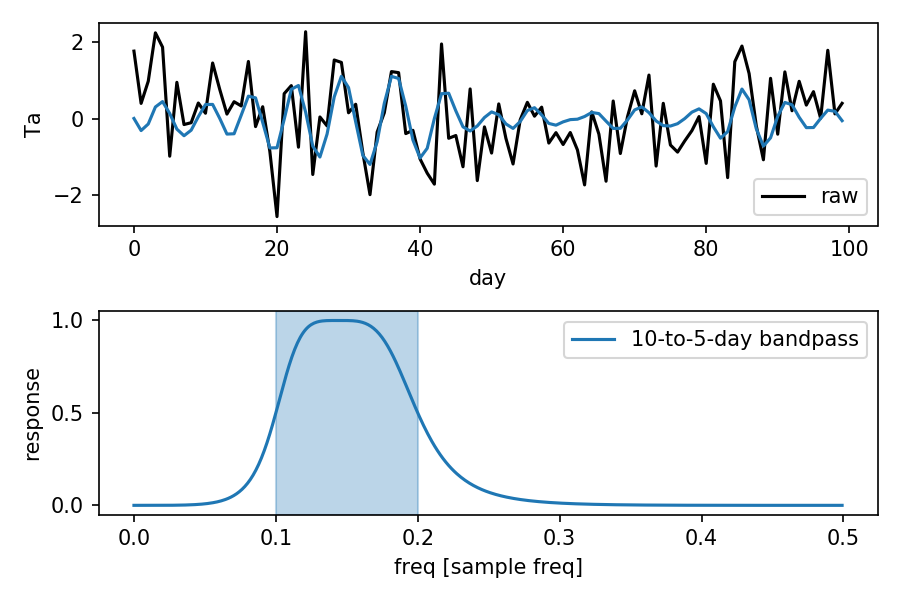
Wrap the forward-backward Butterworth filter from the scipy package so that it can be easily used by xarray.DataArray.
	import xarray as xr
	import numpy as np
	import matplotlib.pyplot as plt
	import xfilter

	np.random.seed(0)
	da = xr.DataArray(np.random.randn(100), dims='day', name='Ta', attrs={'units': 'degC'})

	fig, axes = plt.subplots(2, 1)
	ax = axes[0]
	da.plot(label='raw', color='k', ax=ax)
	da.filter.bandpass([1/10, 1/5], dim='day').plot(ax=ax)
	ax.legend(loc='lower right')

	ax = axes[1]
	xfilter.bandpass_response([1/10, 1/5]).plot(label='10-to-5-day bandpass', ax=ax)
	ax.axvspan(1/10, 1/5, alpha=0.3, color='C0')
	ax.legend()
