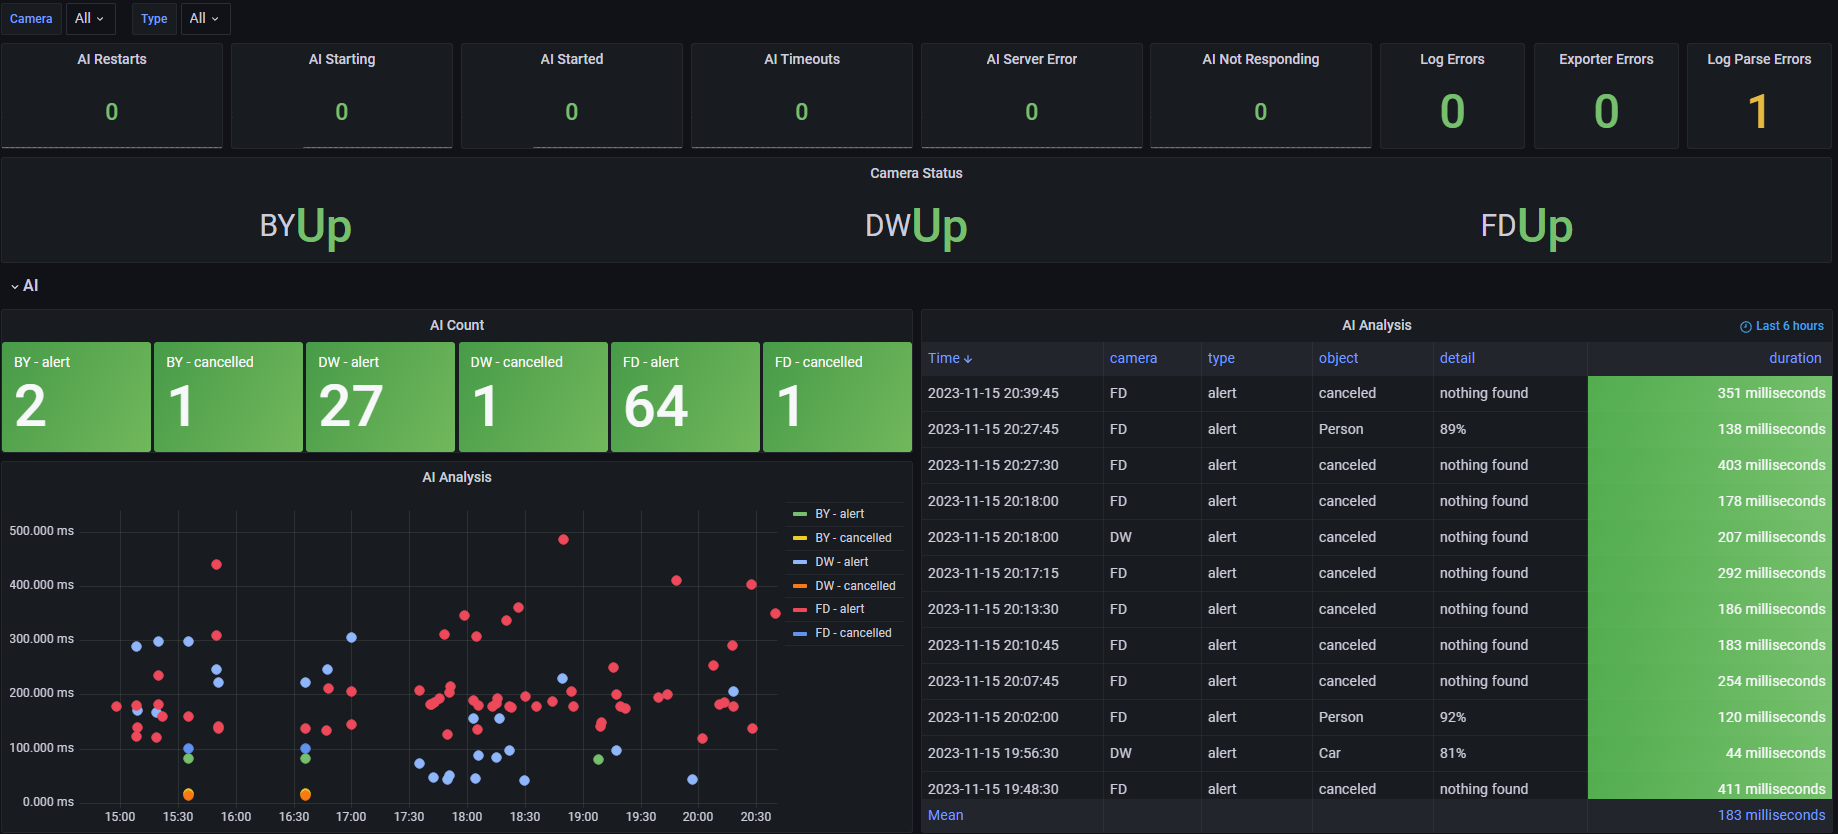
Prometheus exporter for Blue Iris. Confirmed working on Blue Iris version's 5.5.0.12 to 5.9.2.2
If you increment parse_errors metrics, please send me the details and I will work on adding support for it. Blue Iris has changed it's log format for AI a few times and I'm working on adding support for all of it. Also, if you have any ideas for different metrics, let me know!
Tests
| Flag | Description | Default value | Required |
|---|---|---|---|
--telemetry.addr |
addresses on which to expose metrics | :2112 |
No |
--logpath |
Directory path to the Blue Iris Logs | C:\BlueIris\log\ |
No |
--telemetry.path |
URL path for surfacing collected metrics | /metrics |
No |
--service.install |
Install blueiris_exporter as a Windows service | None | No |
--service.uninstall |
Uninstall blueiris_exporter Windows service | None | No |
--service.start |
Start blueris_exporter Windows service | None | No |
--service.stop |
Stop blueris_exporter Windows service | None | No |
--service.pause |
Pause blueris_exporter Windows service | None | No |
--service.continue |
Continue blueris_exporter Windows service | None | No |
blueiris_exporter listens on HTTP port 2112 by default. See the --help output for more options.
You need to make sure that Blue Iris is saving the log to a file.
- Click the Status Button at the top left of Blue Iris
- Select the
Logtab - Check the box
Save to file
By Default, Blue Iris will break out your log files by month. This means the counter metrics will reset at the beginning of each month. If you don't want this to happen, concider changing the name of your log files.
The latest release can be downloaded from the releases page. Save blueiris_exporter-amd64.exe to a safe place, it will be required to stay on your system to use blueiris_exporter.
Open a command prompt and change directory to the directory you saved the executiable.
To run the exporter (example):
blueiris_exporter-amd64.exe --logpath=C:\BlueIris\log
You can also run blueiris_exporter as a Windows service in the background.
Open command prompt as Administrator (Start ->CMD->right click->Run as administrator) and change directory to the directory you saved the executiable.
IMPORTANT: You may need to run the exporter once via command line shown above. A firewall allow window will pop up that you must click allow!
blueiris_exporter-amd64.exe --service.install --logpath=C:\BlueIris\log --telemetry.addr=:1234
blueiris_exporter-amd64.exe --service.start
If you need to update the config for the service, (Update path of the log dir etc) You can do so by uninstalling the service and installing with the new config
blueiris_exporter-amd64.exe --service.stop
blueiris_exporter-amd64.exe --service.uninstall
blueiris_exporter-amd64.exe --service.install --logpath=C:\BI\log --telemetry.addr=:5678
blueiris_exporter-amd64.exe --service.start
Download the latest release from the releases page
wget -O /usr/bin/blueiris_exporter https://github.com/wymangr/blueiris_exporter/releases/download/<release>/blueiris_exporter-amd64-linux
chmod +x /usr/bin/blueiris_exporter
blueiris_exporter --camers=C1,C2,C3 --logpath=/mnt/blueiris/logs
To install as a systemd service, edit and create /etc/systemd/system/blueiris_exporter.service with the following content:
[Unit]
Description=Blue Iris Exporter
After=multi-user.target
Conflicts=getty@tty1.service

[Service]
Type=simple
ExecStart=/usr/bin/blueiris_exporter --logpath=/blue_iris/log --telemetry.addr=:9876
StandardInput=tty-force
StandardOutput=syslog
StandardError=syslog
SyslogIdentifier=blueiris_exporter
Restart=always
RestartSec=5s

[Install]
WantedBy=multi-user.target
Then run systemctl start blueiris_exporter
The Docker image is not hosted yet on Docker Hub, so you will need to build the image.
docker build -t <image_name>:<tag> .
You can then start up the container, passing in the Blue Iris log directory.
docker run -d \
  -p 2112:2112 \
  -v "/path/to/blueiris/log:/path/to/blueiris/log" \
  <image_name>:<tag> \
  --logpath=/path/to/blueiris/log
For Docker compose, see example below.
---
version: '3.8'
services:

  blueiris_exporter:
    restart: unless-stopped
    build:
      context: .
      dockerfile: Dockerfile
    command: ["--logpath=/path/to/blueiris/log"]
    ports:
      - 2112:2112
    volumes:
      - /path/to/blueiris/log:/path/to/blueiris/log
| Name | Description |
|---|---|
| ai_duration | Duration (ms) of the last Blue Iris alert for each camera. This metric will continue to expose the last duration each time it's scraped |
| ai_duration_distinct | Duration (ms) of the last Blue Iris alert for each camera. This metric will only show new alerts and will disapear the next scrpe |
| ai_count | Count of the number of times IA analyzed and image |
| ai_restarted | Number of times Blue Iris restarted the AI in the current logfile |
| ai_timeout | Number of AI timeouts in the current logfile |
| ai_servererror | Count of Deepstack server not responding errors in the current logfile |
| ai_notresponding | Count of AI not responding errors in the current logfile |
| ai_starting | Count of AI is being started log lines |
| ai_started | Count of AI has been started log lines |
| logerror | Count of unique errors in the current logfile |
| logerror_total | Count of total errors in the logs |
| camera_status | Status of each camera. 0=up, 1=down |
| triggers | Count of camera triggers |
| push_notifications | Count of push notifications sent |
| logwarning | Count of unique warnings in the current logfile |
| logwarning_total | Count all warnings in the current logfile |
| folder_disk_free | Free space of the disk the folder is using in bytes |
| folder_used | Size percentage of the limit a folder is using |
| hours_used | Hour percentage of the limit a folder is using |
| parse_errors | Lines in the Blue Iris log that this exporter was unable to parse. Open an issue to add support |
| parse_errors_total | Total number of lines in the Blue Iris log that this exporter was unable to parse |
| profile | Count of activation of profiles |
| ai_error | Count of AI error log lines |
