DashboardAC2 is package that allows you to monitor AC2 applications via a web interface
- Download the git repository
- Launch the command line:
./build.ps1
- Launch the command line:
.\grafana-5.2.2\bin\grafana-server.exe -homepath .\grafana-5.2.2\ - Open browser on http://localhost:3000
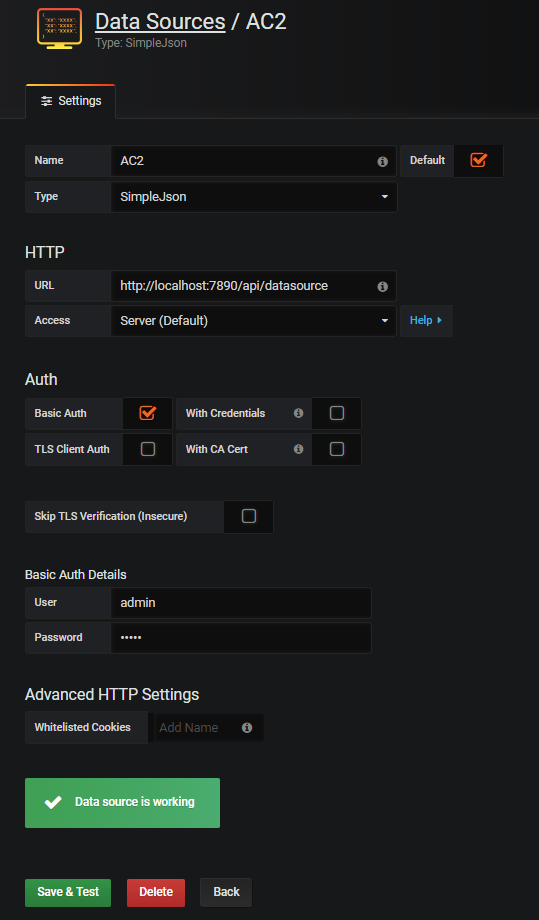
Before getting the dashboard to be displayed correctly, data sources configuration is required. Configure the datasource as following:
- Name: The name of the datasource
- Type: SimpleJson, install the plugin "grafana-simple-json-datasource" is required to view it on the list
- URL: "The URL of AC2 web application" concatenate with "/api/datasource"
- Auth: Check "Basic Auth" and login with AC2 credentials in "Basic Auth Details"
- Finally, click "Save & Test" button to check out that everything is working fine
- To create a dashboard click on "Create your first dashboard"
- Click on "Add panel" to view the available panels for the dashboard
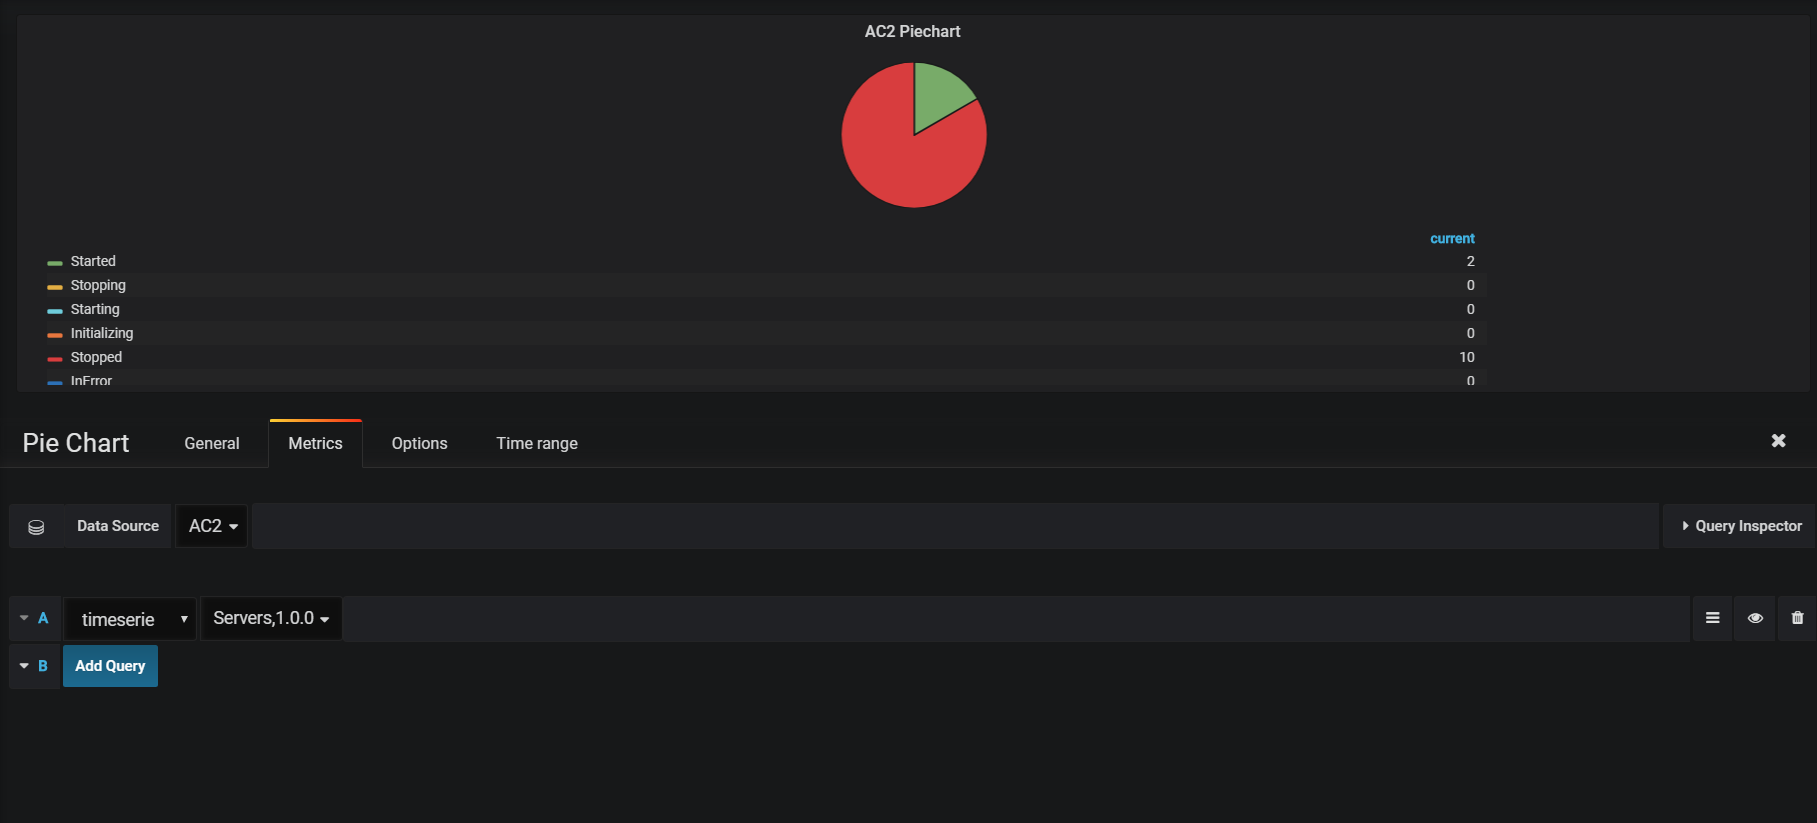
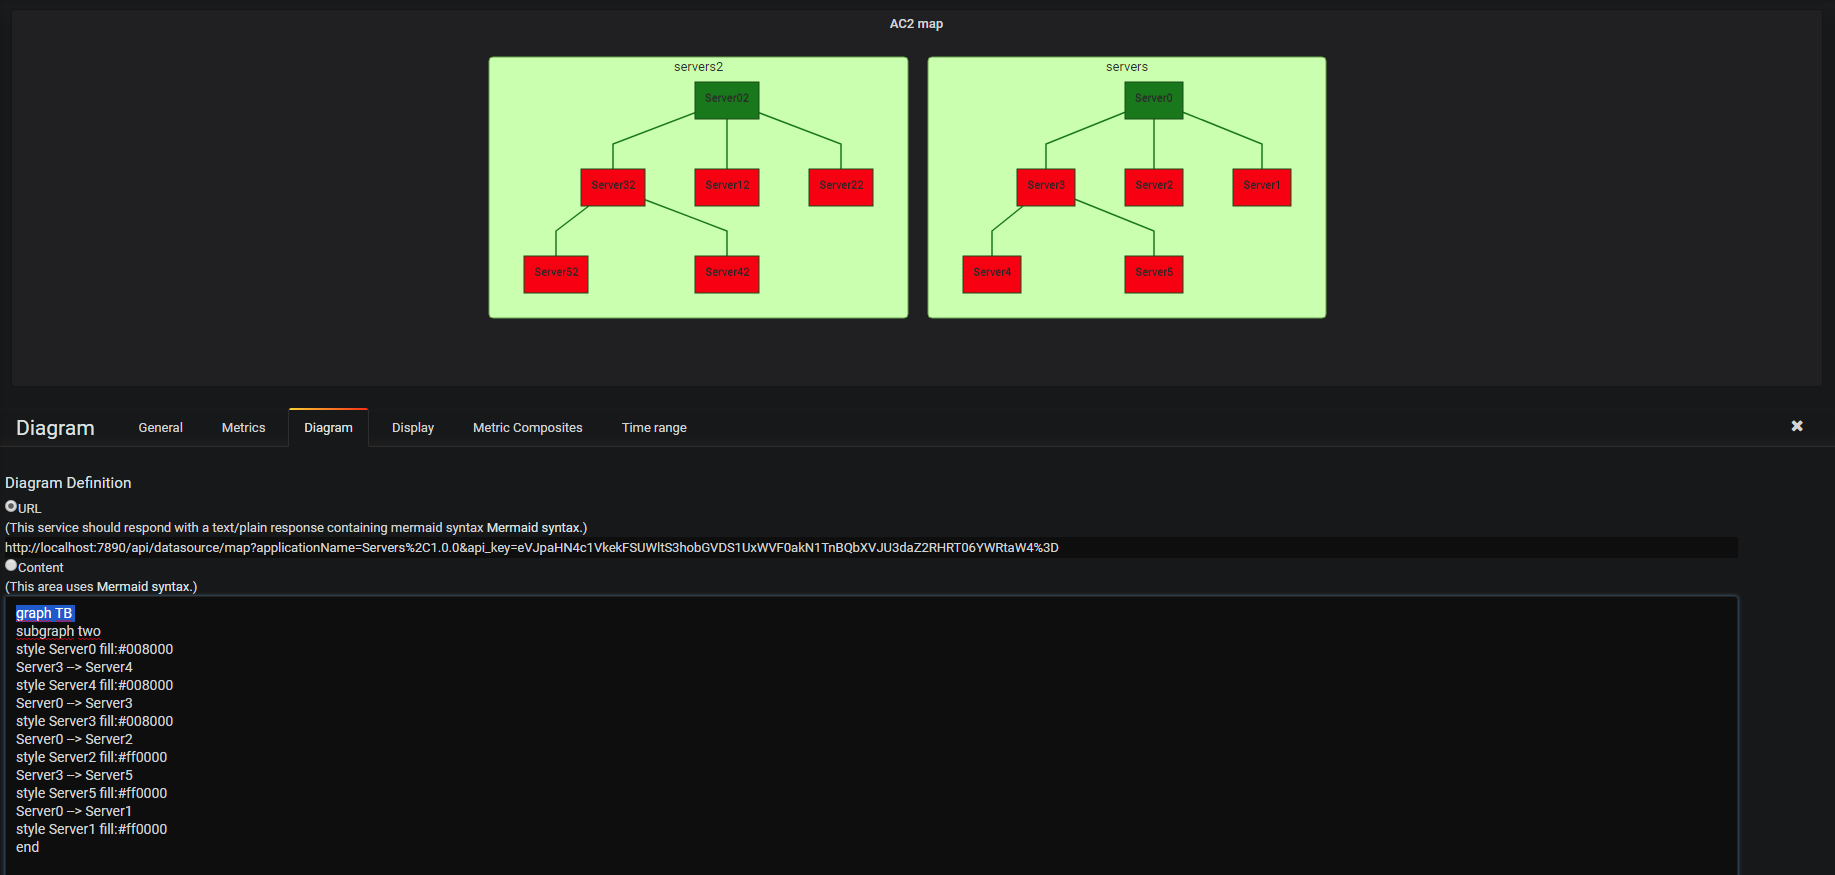
- Then AC2 can be monitored using Pie Chart or Diagram panels
- Select the appropriate data source
- Select the AC2 application
In Diagram section, create the URL to target as following:
- "address of the data source" + "/map/" + "?applicationName=xxx" + "&api_key=xxx" where applicationName is application to display and api_key is a token generated with swagger using the AC2 credentials. For example, URL could be like: http://localhost:7890/api/datasource/map?applicationName=Server&api_key=xxx


