Our manuscript published at Cancer Letters can be found here.
Lei Y, Meng Q, Hong F, Zhao M, Gao X. Pan-cancer survey of lncRNA rewiring and functional alternation in tumor-infiltrating T cell by scLNC. Cancer Lett. 2023 Aug 10;569:216319. doi: 10.1016/j.canlet.2023.216319. Epub 2023 Jul 17. PMID: 37468058.
You can install the package as follows:
# install.packages("devtools")
devtools::install_github("xgaoo/scLNC")
library(scLNC)An example data can be downloaded from GEO with the commands:
wget https://ftp.ncbi.nlm.nih.gov/geo/series/GSE98nnn/GSE98638/suppl/GSE98638_HCC.TCell.S5063.count.txt.gz
wget https://ftp.ncbi.nlm.nih.gov/geo/series/GSE98nnn/GSE98638/miniml/GSE98638_family.xml.tgz
You can get a gene expression matrix and cellular metadata.
For this tutorial, we will analyze a dataset of T cells from hepatocellular carcinoma (HCC) patients, which was profiled by Smart-seq2. The dataset consists of 4,070 T cells derived from peripheral blood (Blood), tumor tissues (Tumor), and adjacent normal liver tissues (Normal) from 5 patients.
To proceed, we will utilize the count matrix and cell annotation information to create a scLNC object. This object acts as a container that encompasses both the data (like the count matrix and cell annotation information) and the analysis results (like co-expressional pairs and unit activity) for a single-cell dataset. Throughout the following study, we recommend that users familiarize themselves with the structure of the scLNC object.
LNCobject <- createLRAT(count_table=HCC_rawcount, cell_info=HCC_cellinfo, min.cells=15, min.genes=200)Additionally, it is possible to convert the gene symbols and gene IDs in the matrix to Ensembl gene IDs, which facilitates subsequent analysis.
rownames(HCC_rawcount) <- id_convert_fromgtf(genelist=rownames(HCC_rawcount), gtf.info=scLNCgencode)The ‘splitLRAT’ function divides an object based on a single attribute into a list of subsetted objects, where each object represents a specific level of the attribute. This functionality is particularly useful when dealing with datasets that contain cells from multiple tissues, as it allows for the creation of tissue-specific objects by subdividing the original object.
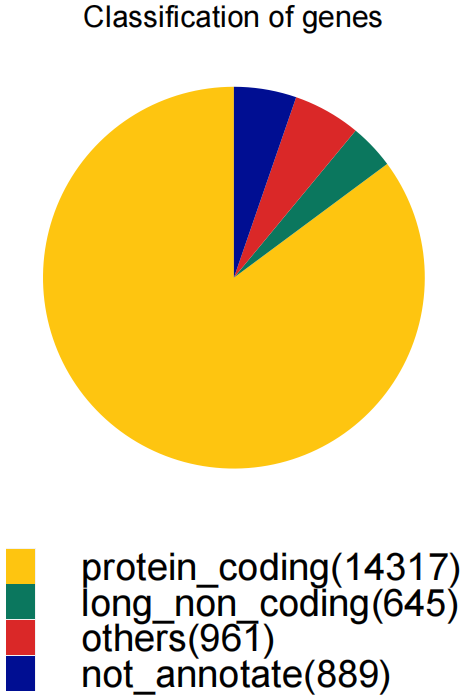
LNCobject.list <- splitLRAT(LNCobject, split.item='Tissue')Based on the annotation from the GENCODE database, the gene types were classified and counted.
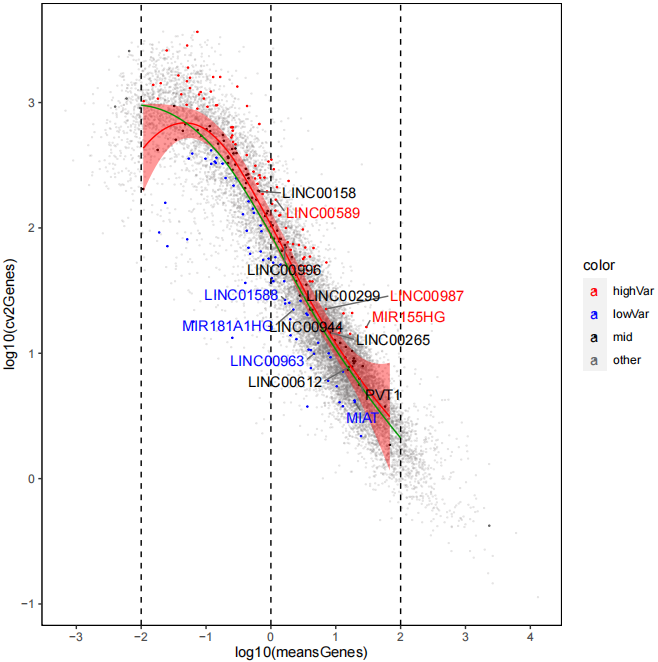
classification(object=LNCobject, genetype_range="all")The expression variance of lncRNAs and mRNAs. The lines denote smoothed fit to the mean expression for lncRNAs (red) and mRNAs (green). Points exceed confidence interval of the fit regression are highlighted in red (high variability) and blue (low variability), respectively. Black indicates points within the confidence interval (middle variability). Grey indicates mRNAs. Example genes are labeled.
scCV2(object=LNCobject, limx=c(-2, 2), labelgene=c('PVT1','LINC00963','LINC00265','LINC00299','MIR155HG','TRG-AAS1','MIAT',
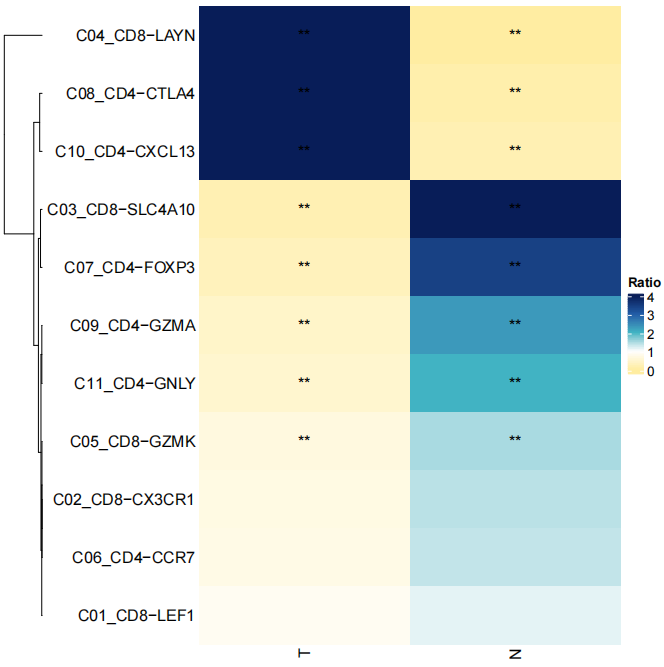
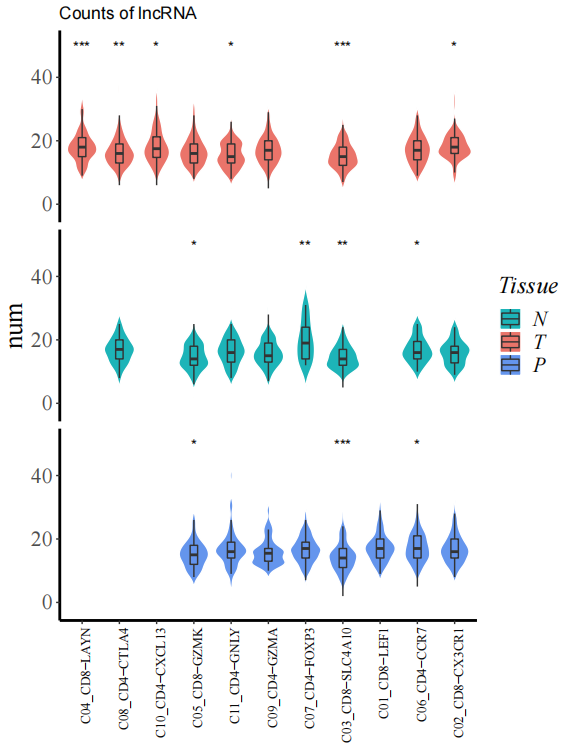
'LINC00944','LINC00612','LINC00987','LINC01588','MIR181A1HG','LINC00996','LINC00158','LINC00589','MSD2','LINC00158'))Identify the enrichment of cell types under different experimental conditions (like Tissues). According to the enrichment of cell types in different tissues, the number of lncRNAs in different cell types in each tissue was compared.
celltype_enrich(object=LNCobject)
StatGeneNum(object=LNCobject, genetype='lncRNA', item='Tissue', item.level=c('T','N','P'), split.by='majorCluster',
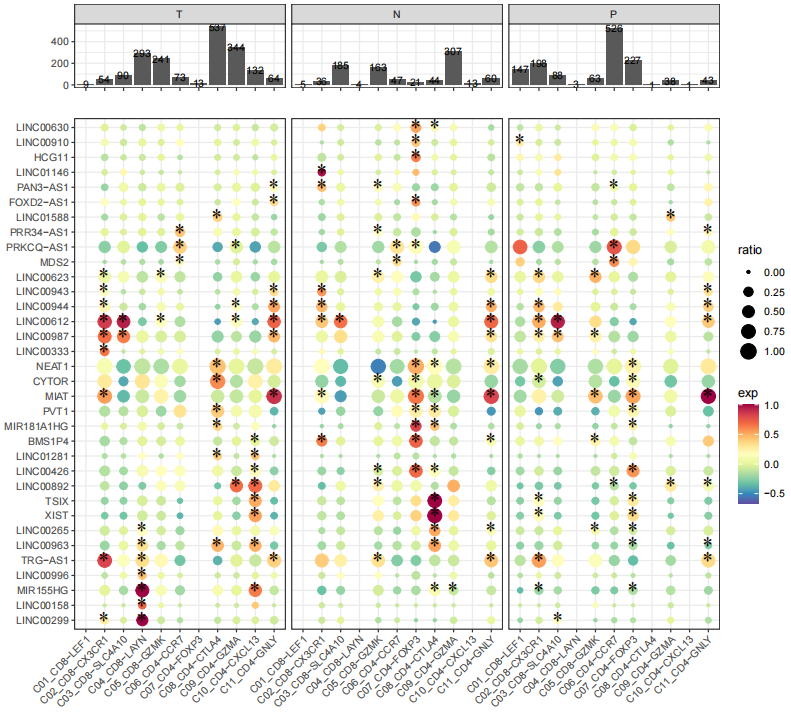
disorder=c('C04_CD8-LAYN','C08_CD4-CTLA4','C10_CD4-CXCL13','C05_CD8-GZMK','C11_CD4-GNLY',"C09_CD4-GZMA",'C07_CD4-FOXP3','C03_CD8-SLC4A10','C01_CD8-LEF1','C06_CD4-CCR7','C02_CD8-CX3CR1'))We identified marker lncRNA genes across cell types in different tissues by Seurat, and then demonstrated conserved and tissue-specific marker lncRNAs by scLNC.
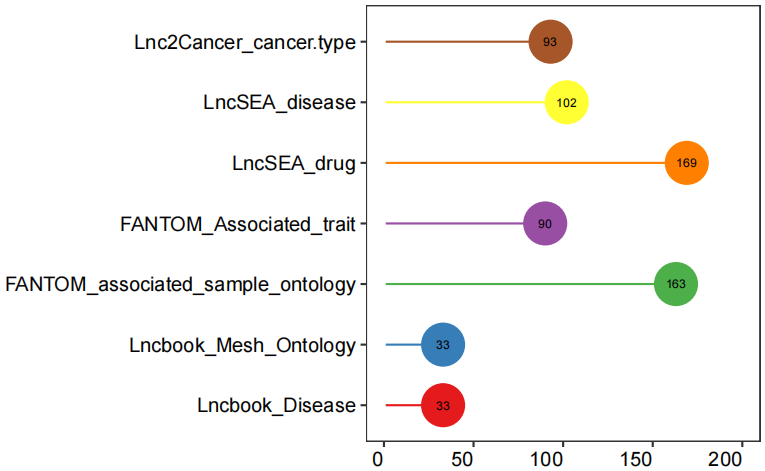
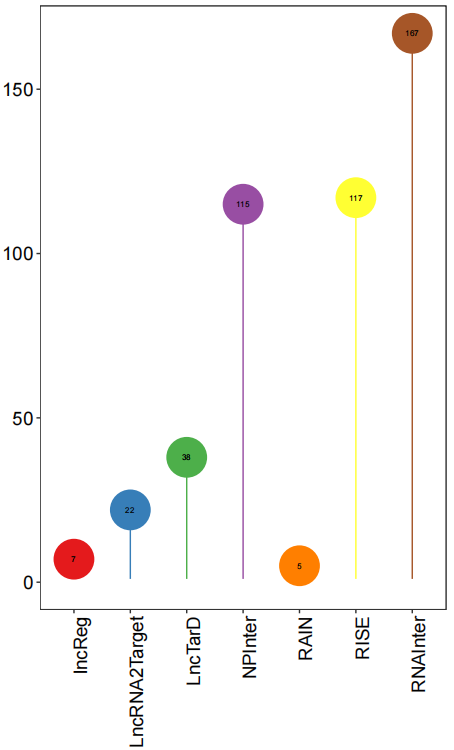
DotFeatures(object=LNCobject, features=unique(DE_l$gene), item="majorCluster", mytitle=NULL, split.by='Tissue', mincell.peritem=15)To imply potential functions of lncRNAs, scLNC provides annotations of associated cell type, disease and drug of lncRNAs from multiple databases. And lncRNA-mRNA interaction databases can infer lncRNA functions by related mRNAs.
lncRNADatabase(features=LNCobject@ gene.list$lncRNA)
lncRNA_mRNADatabase(features=LNCobject@ gene.list$lncRNA)
The count matrix slot is now ready for the co-expression analysis. The process also includes annotation of information on gene types, co-expression relationship pair types, cis and trans, and distances on lncRNA and mRNA genomes.
In this tutorial, we performed gene coexpression calculations for each tissue data.
LNCobject.list <- splitLRAT(LNCobject, split.item='Tissue')
rdata_T <- CaculateCorelation(object=LNCobject.list[['T']], fileName='T')
rdata_N <- CaculateCorelation(object=LNCobject.list[['N']], fileName='N')
rdata_P <- CaculateCorelation(object=LNCobject.list[['P']], fileName='P')
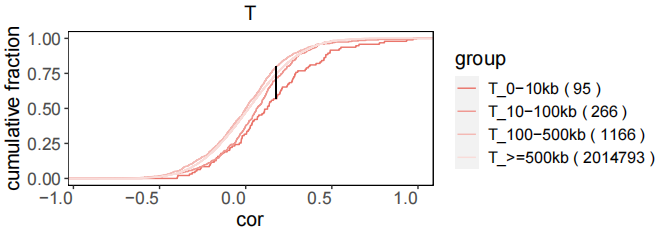
The output results of the above coexpression calculation were read in, and the distribution map of correlation coefficient distribution was displayed through scLNC. Pairs were divided into four groups based on the genomic distance between lncRNA and mRNA (titrated colors).
CoexpPairs_cis_cor <- read.csv("new_T_lm.csv", head=TRUE, stringsAsFactors=FALSE)
CoexpPairs <- CoexpPairs_cis_cor[,c('cor','locus_distance_range')]
CorDensity(CoexpPairs)Users can filter the lncRNA-mRNA pairs with high correlation coefficients as co-expression pairs according to the data.
LNCobject_T <- LNCobject.list[['T']]
LNCobject_N <- LNCobject.list[['N']]
T <- read.csv("new_T_lm.csv", head=TRUE, stringsAsFactors=FALSE)
N <- read.csv("new_N_lm.csv", head=TRUE, stringsAsFactors=FALSE)
LNCobject_T <- FilterPairs(data=rdata_T, object=LNCobject_T, corcut=mean(T$cor)+3*sd(T$cor), RPSL=FALSE, targetcut=0)
LNCobject_N <- FilterPairs(data=rdata_N, object=LNCobject_N, corcut=mean(N$cor)+3*sd(N$cor), RPSL=FALSE, targetcut=0)
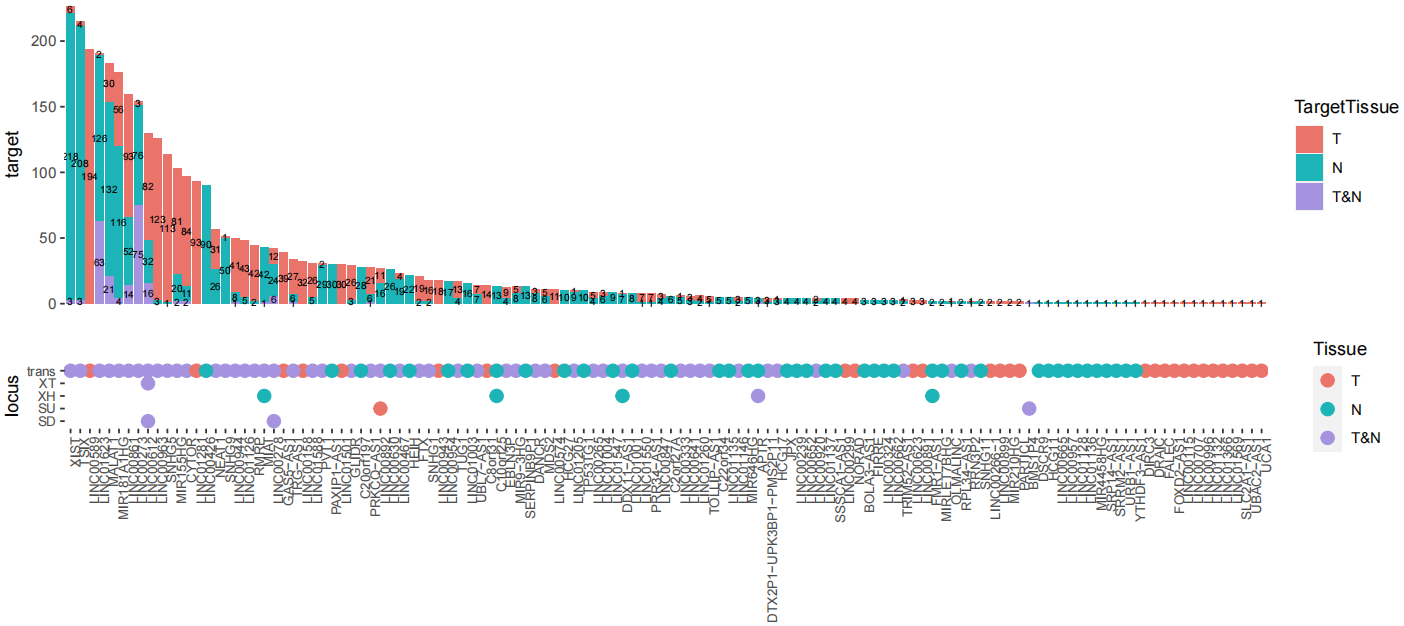
LncRNA and its paired mRNAs were defined as a functional unit. Bar plot shows the number of the mRNAs in each lncRNA unit in tumor and normal tissue.
bar_stat_units(object.list=LNCobject.list[c('T', 'N')])Relevant annotation of lncRNA-mRNA co-expression pairs(like sequence interaction support, triple helix interactions with DNA, known database study information), and TF and cytokine annotation of genes.
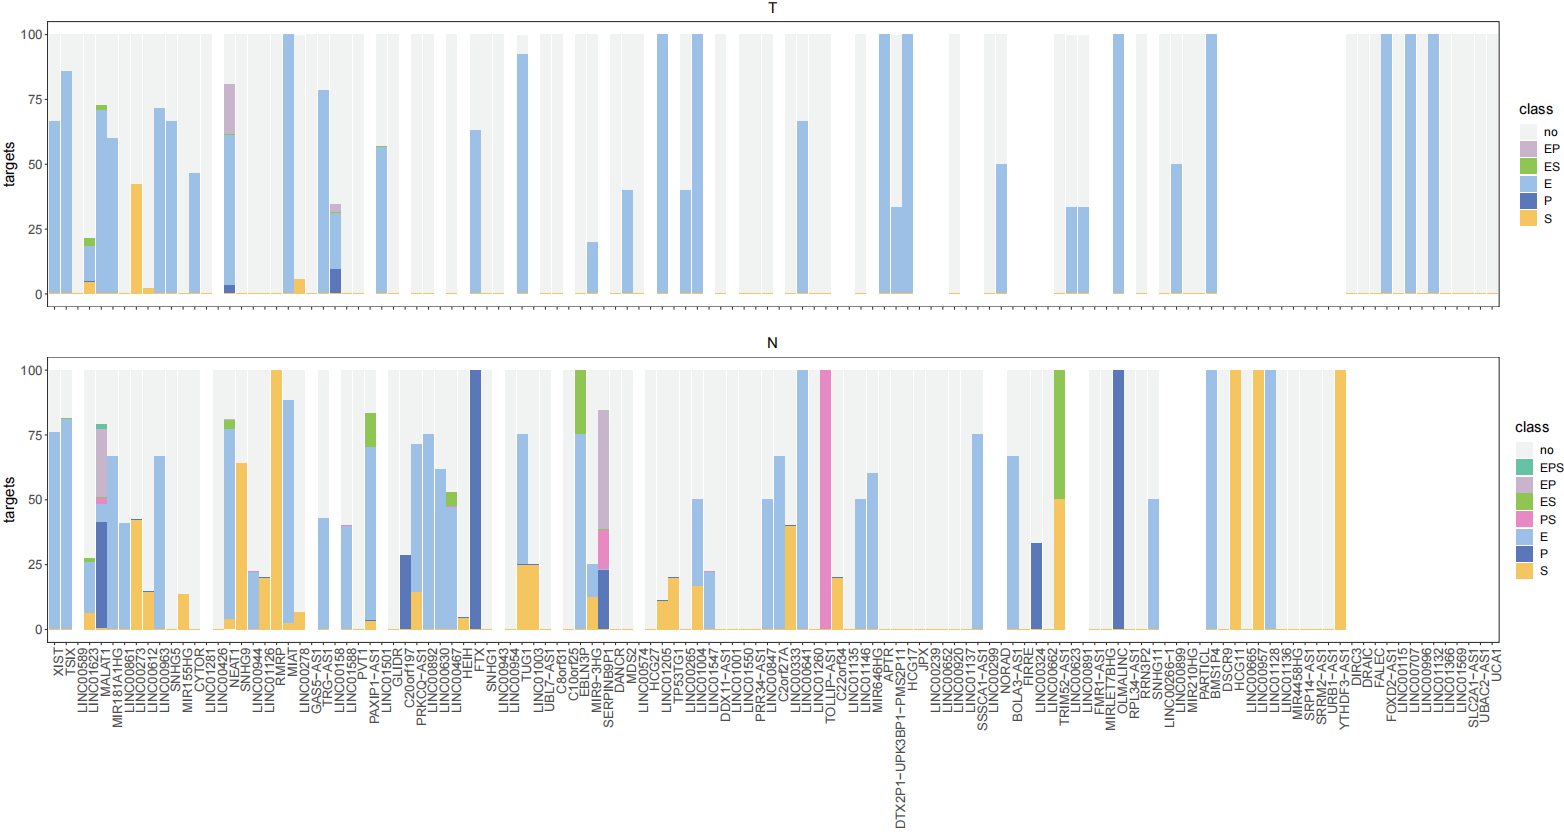
LNCobject_T <- PairsAnnotation(object=LNCobject_T, Seq=TRUE, Enhancer=TRUE, Promoter=TRUE, TF=TRUE, cytokine=TRUE, LMpairs=TRUE)Statistics on the percentage of Enhancer, Promoter and sequence-based identification of lncRNAs-mRNAs in tumor and normal tissue.
sta_target33(LNCobject_T@ link.data$ pairs)+ labs( title="T")
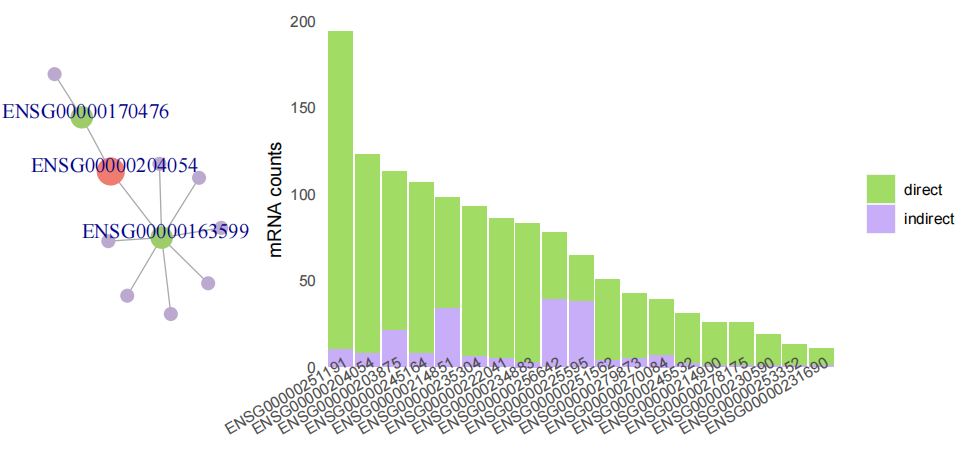
sta_target33(LNCobject_N@ link.data$ pairs)+ labs( title="N")Within a lncRNA unit, the correlation between lncRNA and its paired mRNA can be direct or indirect. To further examine the relationship of the pairs, we applied shortest path algorithm of graph to identify whether the correlation of lncRNA and mRNA was direct or mediated by other mRNAs。
end <- unique((CoexpPairs %>% dplyr::filter(simple_type.x == 'lncRNA', simple_type.y == 'mRNA', row == lncID))$column)
corrlist_shortPath <- getShortPath(lncID='ENSG00000268066', endpoints=end, corrlist=CoexpPairs)
draw_shortPath(corrlist_shortPath)
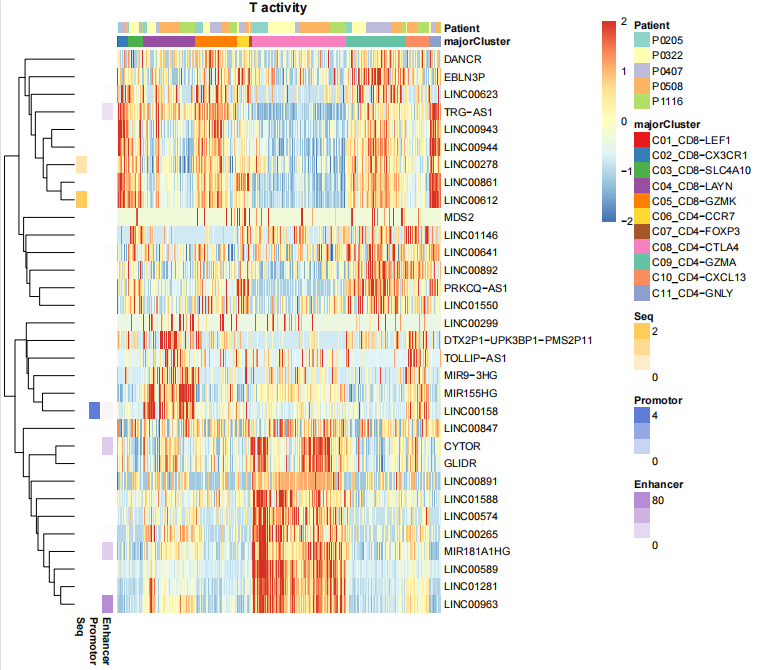
stats_indirect_pairs(corrlist=CoexpPairs)We defined a lncRNA and its co-expressed mRNAs as a lncRNA unit. To determine in which cells each unit is active, we used AUCell.
LNCobject_T <- AUCell_score(object=LNCobject_T, lnclist=NULL)To determine in which cell types each cell was active, we performed an analysis of differences between cell types using the mean AUC score.
LNCobject_T <- DeActivity(object=LNCobject_T, item='majorCluster', FC=0.1, pvalue=0.05, min.pct=0.3, padj=1)
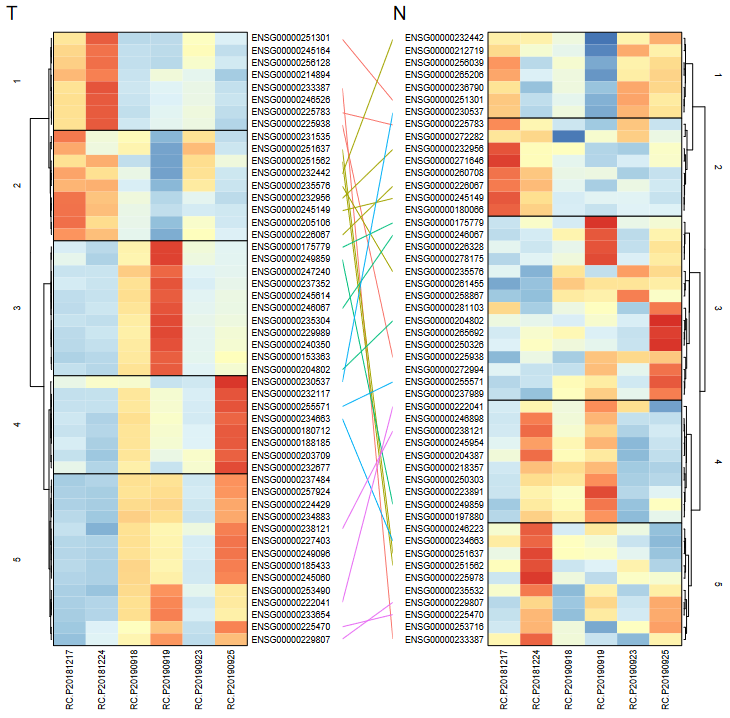
HeatmapPlot(object=LNCobject_T, items=c("majorCluster","Patient"), features=gtfid2genename(unique(LNCobject_T@ gene.list$DEAUC$gene),gtf.info=scLNCgencode), mytitle="T activity")Compares lncRNA units in terms of attribute change( like between tumor and normal tissue).
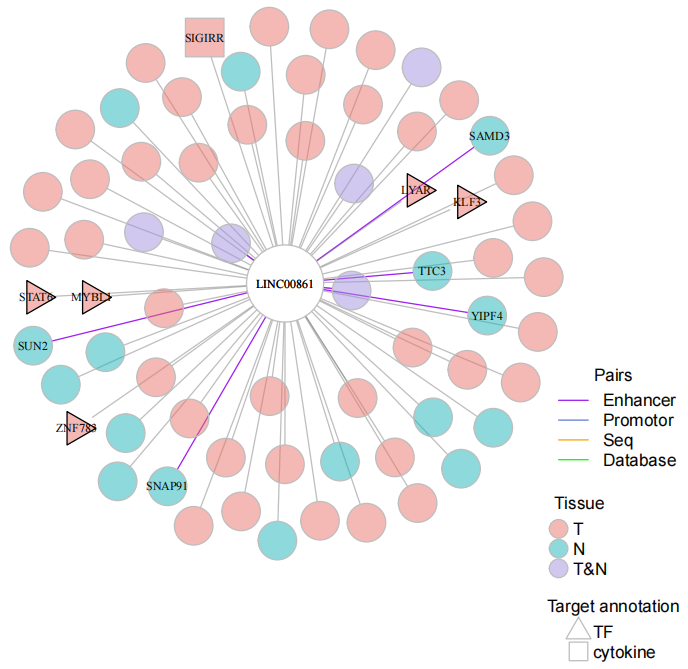
The sames and differences of mRNAs coexpressed with lncRNA in an unit between tumor and normal tissue.
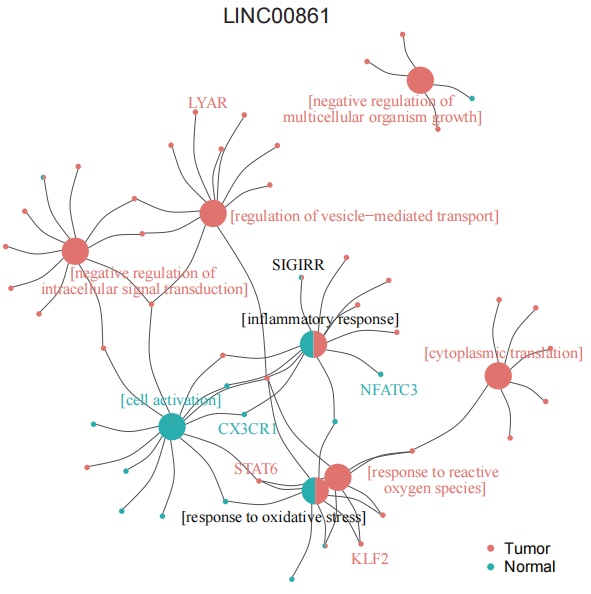
display_unit(object.list=LNCobject.list[c('T','N')], myunit='LINC00861', corcut1=0.6, corcut2=0.78)Differences in functional enrichment between the two groups of units. Input the list of mRNAs co-expressed with LINC00861 in different tissues (Gene2Group_LINC00861) and the results of functional enrichment in metascape based on this list (Go2Group_LINC00861).
lnc_network(GO_file=Go2Group_LINC00861, genelist=Gene2Group_LINC00861, lncRNA='LINC00861')The difference in AUC between the two experimental conditions in pan-cancer.
DEAUC_2item(object.list=pancancer.list[c('T','N')])