A single pane of glass to easily view and monitor the performance of your MySQL, MongoDB, PostgreSQL, and MariaDB databases.
Percona Monitoring and Management (PMM) is a best-of-breed open source database monitoring solution. It helps you reduce complexity, optimize performance, and improve the security of your business-critical database environments, no matter where they are located or deployed. PMM helps users to:
- Reduce Complexity
- Optimize Database Performance
- Improve Data Security
See the PMM Documentation for more information.
- Monitor your database performance with customizable dashboards and real-time alerting.
- Spot critical performance issues faster, understand the root cause of incidents better and troubleshoot them more efficiently.
- Zoom-in, drill-down database performance from node to single query levels. Perform in-depth troubleshooting and performance optimization.
- Built-in Advisors run regular checks of the databases connected to PMM. The checks identify and alert you of potential security threats, performance degradation, data loss and data corruption.
- DBaaS: Create and configure database clusters no matter where the infrastructure is deployed.
- Backup and restore databases up to a specific moment with Point-in-Time-Recovery.
Please check our Documentation for the actual architecture.
There are numbers of installation methods, please check our Setting Up documentation page.
But in a nutshell:
- Download PMM server Docker image
$ docker pull percona/pmm-server:2- Create the data volume container
$ docker volume create pmm-data- Run PMM server container
$ docker run --detach --restart always \
--publish 443:443 \
--volume pmm-data:/srv \
--name pmm-server \
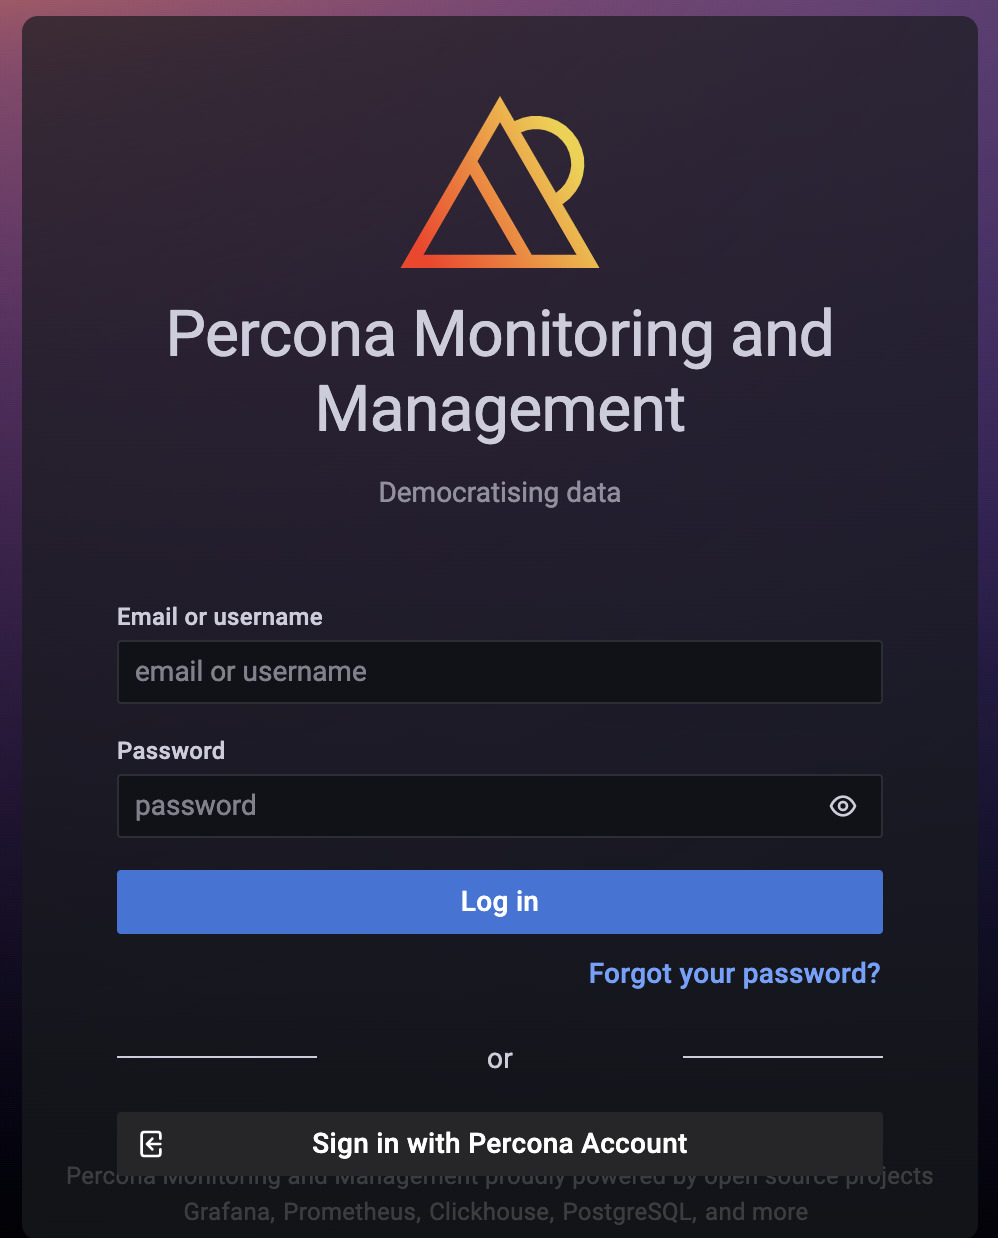
percona/pmm-server:2- Start a web browser and in the address bar enter the server name or IP address of the PMM server host.
Enter the username and password. The defaults are username: admin and password: admin
We encourage contributions and are always looking for new members that are as dedicated to serving the community as we are.
If you’re looking for information about how you can contribute, we have contribution guidelines across all our repositories in CONTRIBUTING.md files. Some of them may just link to the main project’s repository’s contribution guidelines.
We're looking forward to your contributions and hope to hear from you soon on our Forums and Discord.
If you find a bug in Percona Monitoring and Management or one of the related projects, you should submit a report to that project's JIRA issue tracker. Some of related project also have GitHub Issues enabled, so you also could submit there.
Your first step should be to search the existing set of open tickets for a similar report. If you find that someone else has already reported your problem, then you can upvote that report to increase its visibility.
If there is no existing report, submit a report following these steps:
- Sign in to Percona JIRA. You will need to create an account if you do not have one.
- Go to the Create Issue screen and select the relevant project.
- Fill in the fields of Summary, Description, Steps To Reproduce, and Affects Version to the best you can. If the bug corresponds to a crash, attach the stack trace from the logs.
An excellent resource is Elika Etemad's article on filing good bug reports..
As a general rule of thumb, please try to create bug reports that are:
- Reproducible. Include steps to reproduce the problem.
- Specific. Include as much detail as possible: which version, what environment, etc.
- Unique. Do not duplicate existing tickets.
Percona is dedicated to keeping open source open. Wherever possible, we strive to include permissive licensing for both our software and documentation. For this project, we are using the GNU AGPLv3 license.


