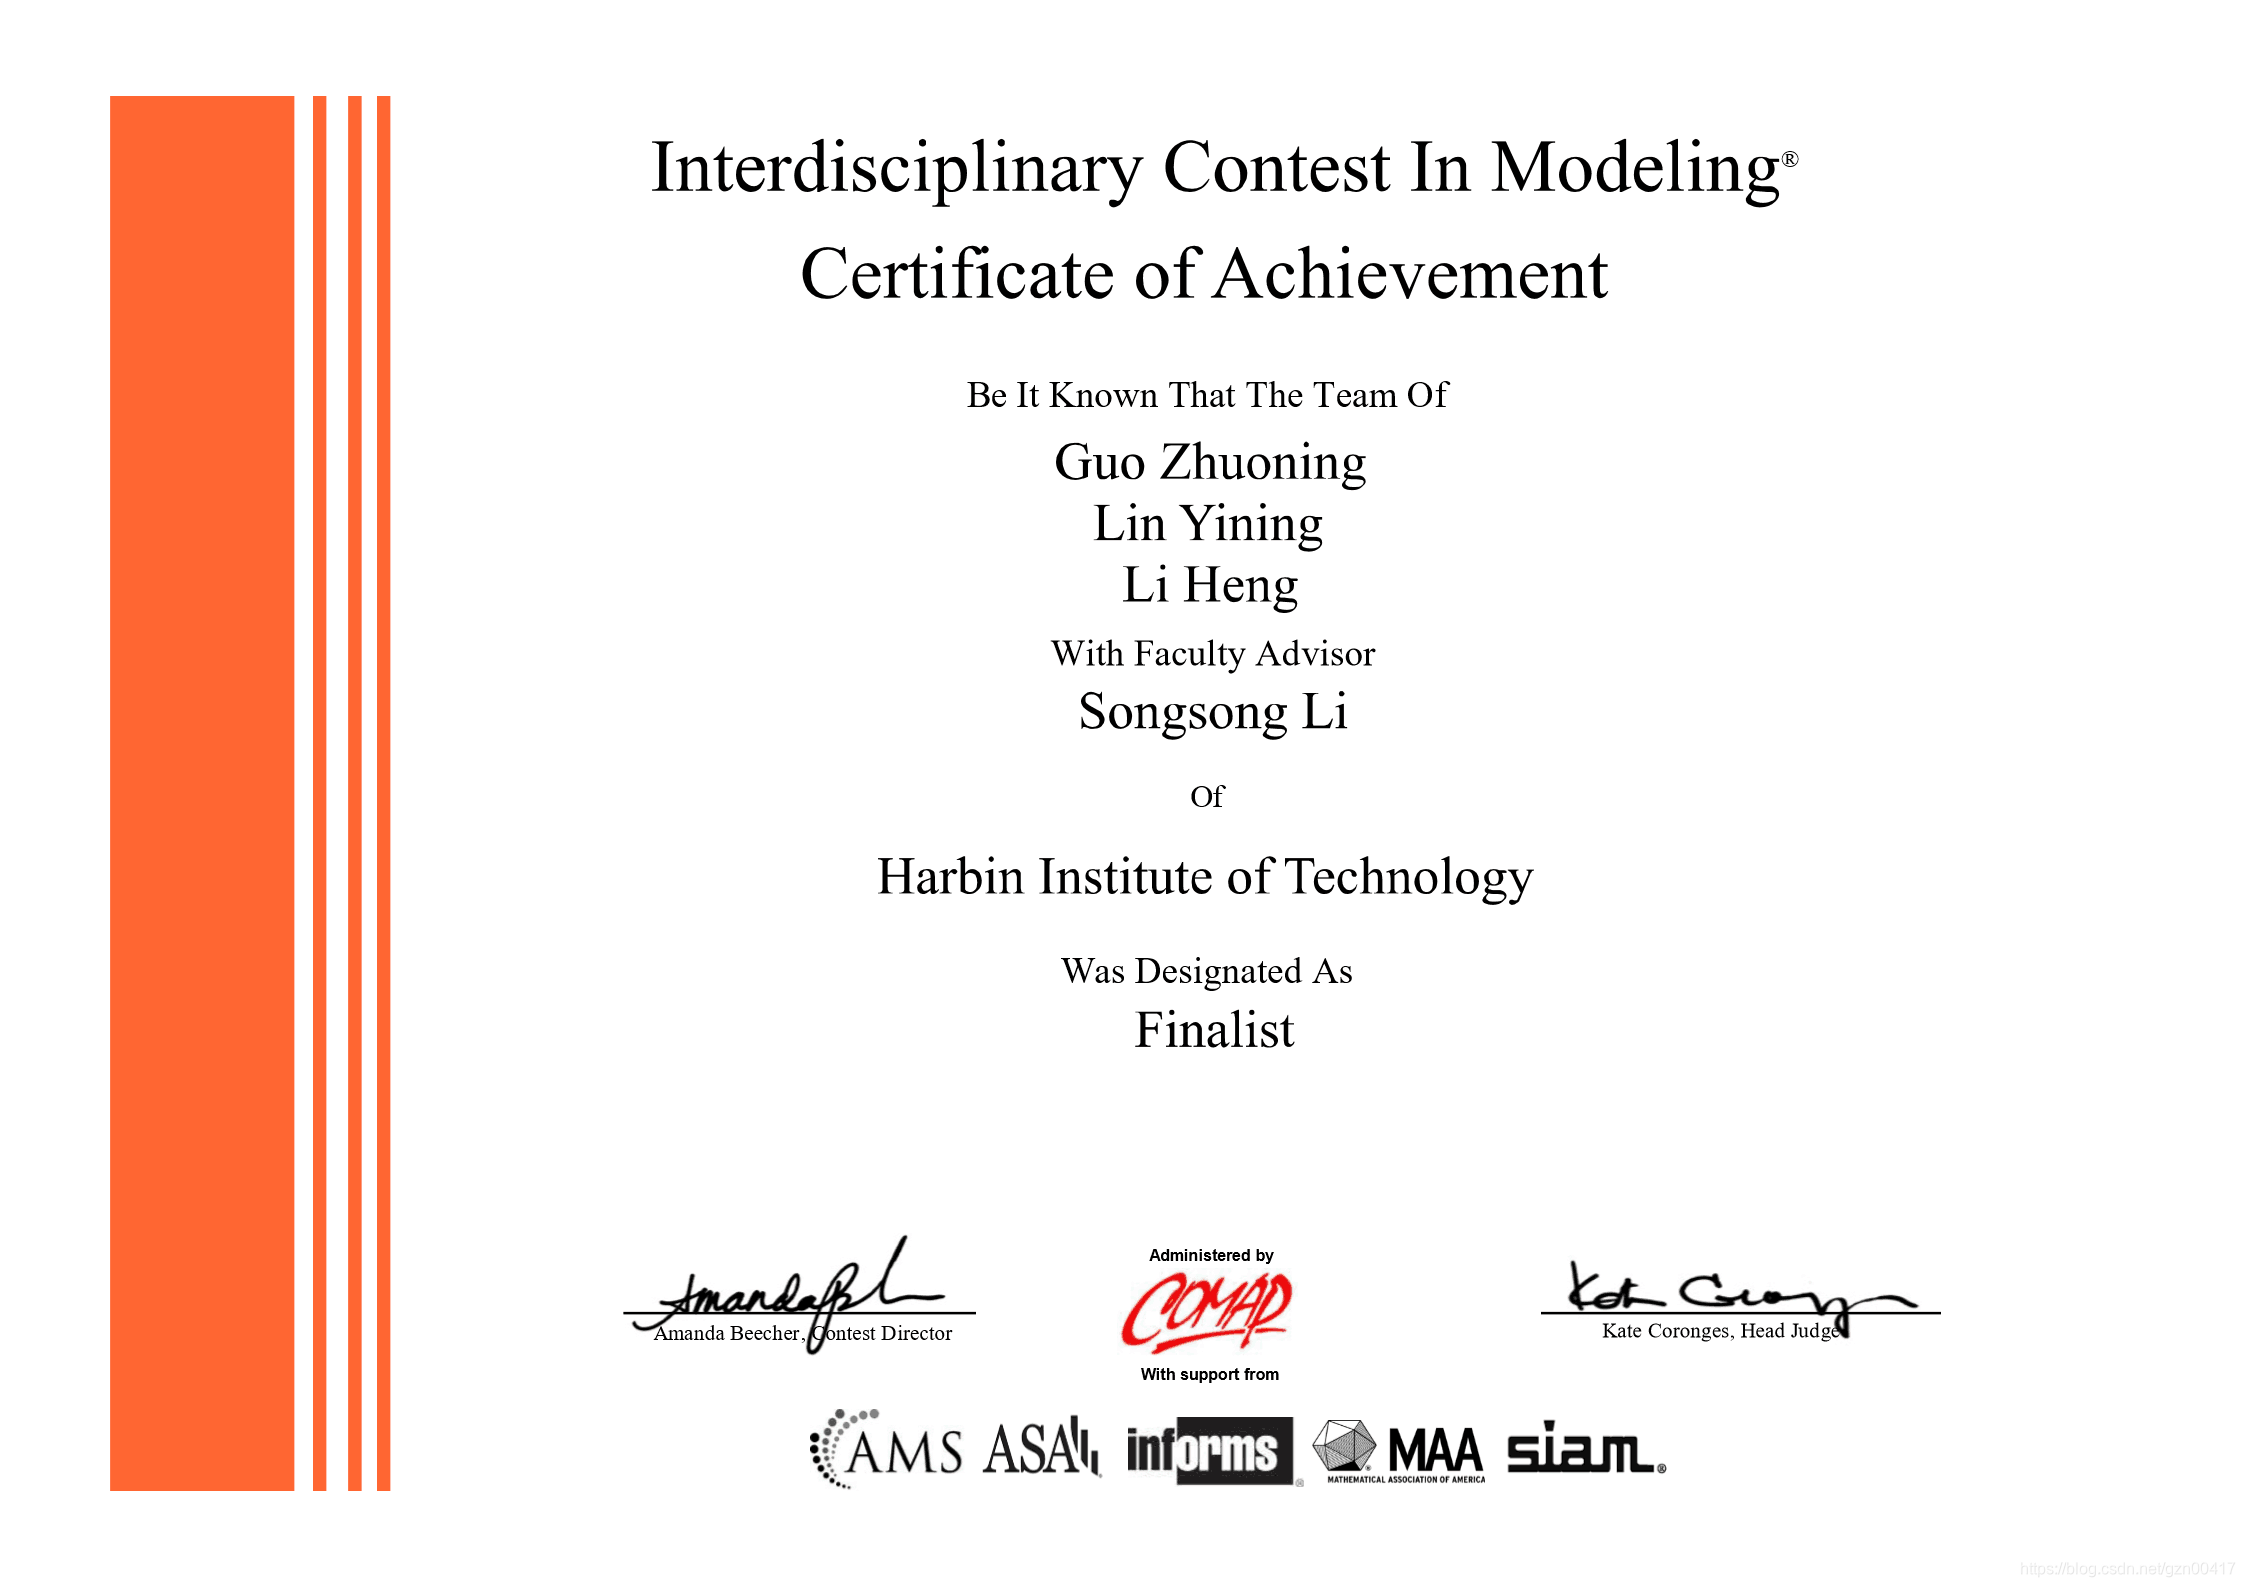
- 2020MCM-ICM ProblemD
- Finalist 方案
2020年美国大学生数学建模竞赛ICM-D题 特等奖提名
- This paper proposes a method, with graph theory, probability theory and calculus, to build machine learning models based on data analysis, which aims at providing strategies for soccer coach's lineup arrangement and players' training.
本文利用图论,概率论和微积分的方法,利用数据分析和建立机器学习模型,为足球教练的阵容安排和球员训练提供策略。
- Firstly, the Pass Network Model can be established according to the graph theory, whose edge-weights are evaluation of coordination degree of each dyadic configurations. Pass Evaluate Index is designed for evaluate a single pass, and the summation of each pass can be defined as the edge-weights of PNM. For analysis, the adjacency matrix of N participating players within a period. Several outstanding M configurations can be found by the sort of M-element combination with the key of the sum of the sub-complete graph edge weights. What’s more, investigation of the influence of time on pass density depends on the constructed and approximate function of time and pass.
Firstly,根据图论,在球员之间建立传球网络,并建立单次传球的价值评价模型,用于评价两两球员间传球的配合程度,即传球网络的边权。建立在一定时间范围内所有参与比赛的N个球员的邻接矩阵,通过以M个点的子完全图边权之和为排序关键字找出若干组优秀的M元组合。同时建立基于时间尺度的价值模型,用于评价时间对传球效率的影响。
- Secondly, performance indicators that reflect successful teamwork can be divided into dynamic indicators and static indicators. Static indicators include player position arrangement and line-up with which player season heatmap models and player position models can be established while the dynamic indicators include opponents’ strength, side, coach, passes, defense, attack and fail. etc. After visualized analysis of the correlation between the dynamic indicators extracted after data cleaning, and with the setting label by the goal difference, the random forest classifier, a machine learning model, is used as a evaluation model of dynamic indicators. After the Grid Search used for tuning parameters, and cross-validation, the accuracy of the model achieving 80% approximately.
Secondly,我们将反映成功团队合作的绩效指标划分为静态指标和动态指标。静态指标包括球员位置安排和球队阵型(line-up),我们建立球员赛季热点模型和球员分布模型。动态指标包括opponents,side,coach,passes,defence,attack and fail等。对经过数据清洗动态指标之间通过可视化进行相关性分析后,以净胜球分类作为比赛样本标签,以随机森林分类器作为机器学习的模型,用网格搜索调优参数,建立动态指标评价模型,进行交叉验证,达到了80%的准确率。
- Thirdly, the study focuses on the role of static indicators in the performance of the team and establishes different players' value evaluation models in different positions which comprehensively consider the player’s positions and technical statistical data evaluation. To optimize the value of 11-person permutation, we choose simulated annealing (SA) algorithm which searches the global optimal solution in cousin points in the same minimized search tree after the local optimal solution has attained. The model finally gave the best starting lineup formation. In addition, we also consider the following three secondary factors: tacit understanding between players, home and away influence, and coaching arrangements. All analysis above can be concluded as comprehensive suggestion to the coach.
Thirdly,通过上述中建立的模型进行观察分析,我们着重研究静态指标对球队的胜利起到的关键作用,综合考虑球员位置和技术数据评价模型,建立不同球员在不同位置价值评价模型。通过模拟退火算法,优化11人排列组合的考虑,在局部最优解的父级搜索树进行搜索全局最优解,最终给出价值最优的首发阵容阵型图。此外我们还考虑以下三个次要影响因素:球员间默契度,主客场影响和教练安排。给教练提出的综合建议。
- Finally, we use the case of the Huskies to explain group dynamics. And use the conclusions obtained by the Huskies to build a model to explain how to design a more effective team and supplement the team performance indicators.
Finally,我们用哈士奇球队的案例来解释群体动力学。并用哈士奇球队建立模型得到的结论来说明如何设计更有效的团队,并对团队绩效指标进行补充。
Key words: Network; Graph theory; Calculus; Machine learning; Random forest classifier; Simulated annealing; Heat map; Group dynamics
- 1.1 Background 3
- 1.2 Problem Restatement 3
- 2.1 Processing Tools 3
- 2.2 Data Cleaning 4
- 3.1 Pass Evaluation Index (PEI) 4
- 3.2 Pass Network Model (PNM) and Recognition of Network Pattern 6
- 3.3 Fluctuation of Passing State at The Time 6
- 4.1 Static Index (SI) 8
- 4.2 Dynamic Index (DI) 9
- 4.2.1 Data Cleaning and Feature Engineering 9
- 4.2.2 Visualization Analysis 9
- 4.2.3 RFC Establishment, Optimization, and Training 12
- 5.1 Position Evaluation Engineering (PEE) 13
- 5.2 Optimization of Permutation and Combination Based on SA Algorithm 14
- 5.3 Other Structural Strategy Factors 15
- 5.4 Structural Strategy Conclusion 16
- 6.1 Group and Soccer Team 17
- 6.1.1 Group Cohesiveness 17
- 6.1.2 Group Standard and Group Pressure 17
- 6.1.3 Individual Motivation and Group Goals 17
- 6.1.4 Leadership and Group Performance 18
- 6.1.5 Group Structure 18
- 6.2 Other influence factor of successful teamwork 18
- 7.1 Strength 18
- 7.2 Weakness 19
- 1.1 背景 3
- 1.2 问题重述 3
- 2.1 预处理工具 3
- 2.2 数据清洗 4
- 3.1 传球评价指标 (PEI) 4
- 3.2 传球网络模型(PNM)构建及识别网络模式 6
- 3.3 时间尺度上传球状态波动 6
- 4.1 静态指标 (SI) 8
- 4.2 动态指标 (DI) 9
- 4.2.1 数据清洗和特征工程 9
- 4.2.2 可视化分析 9
- 4.2.3 随机森立分类器模型的建立、参数调优和训练 12
- 5.1 位置评价工程(PEE) 13
- 5.2 基于SA算法优化排列组合 14
- 5.3 其他结构策略因素 15
- 5.4 结构性策略总结 16
- 6.1 团体动力学和足球队 17
- 6.1.1 群体内聚力 17
- 6.1.2 群体标准和群体压力 17
- 6.1.3 个人动机和群体目标 17
- 6.1.4 领导与群体性能 18
- 6.1.5 群体的结构性 18
- 6.2 成功团队合作其他影响因素 18
- 7.1 优势 18
- 7.2 缺陷 19
