Prometheus exporter for Huawei Dorado SAN
Collects metrics from Huawei storages' API
- All components
- running status
- health status
- Disk
- read_iops
- read_mbytes
- write_iops
- write_mbytes
- avg_read_latency
- avg_write_latency
- queue_length
- BBU
- remainlife
- Enclosure
- temperature
- Controller
- cpu usage
- ram size
- ram usage
- queue_length
- read_iops
- read_mbytes
- write_iops
- write_mbytes
- max_latency
- avg_read_latency
- avg_write_latency
- avg_cpu_usage
- avg_cache_usage
- read_cache_hits
- write_cache_hits
- read_cache_usage
- write_cache_usage
- cache_page_usage
- cache_chunk_usage
- max_read_kbytes
- max_write_kbytes
- Eth ports
- errors count
- usage
- queue_length
- read_iops
- read_mbytes
- write_iops
- write_mbytes
- max_latency
- avg_read_latency
- avg_write_latency
- SAS ports
- errors count
- read_iops
- read_mbytes
- write_iops
- write_mbytes
- max_latency
- max_read_latency
- max_write_latency
- avg_read_latency
- avg_write_latency
- LUNs
- capacity total
- capacity allocated
- queue_length
- read_iops
- read_mbytes
- write_iops
- write_mbytes
- max_latency
- avg_read_latency
- avg_write_latency
- read_cache_hits
- write_cache_hits
- Disk pool
- capacity total
- capacity allocated
- remainlife
- queue_length
- read_iops
- read_mbytes
- write_iops
- write_mbytes
- max_latency
- avg_read_latency
- avg_write_latency
- Storage pool
- capacity total
- capacity allocated
- queue_length
- read_iops
- read_mbytes
- write_iops
- write_mbytes
- max_latency
- avg_read_latency
- avg_write_latency
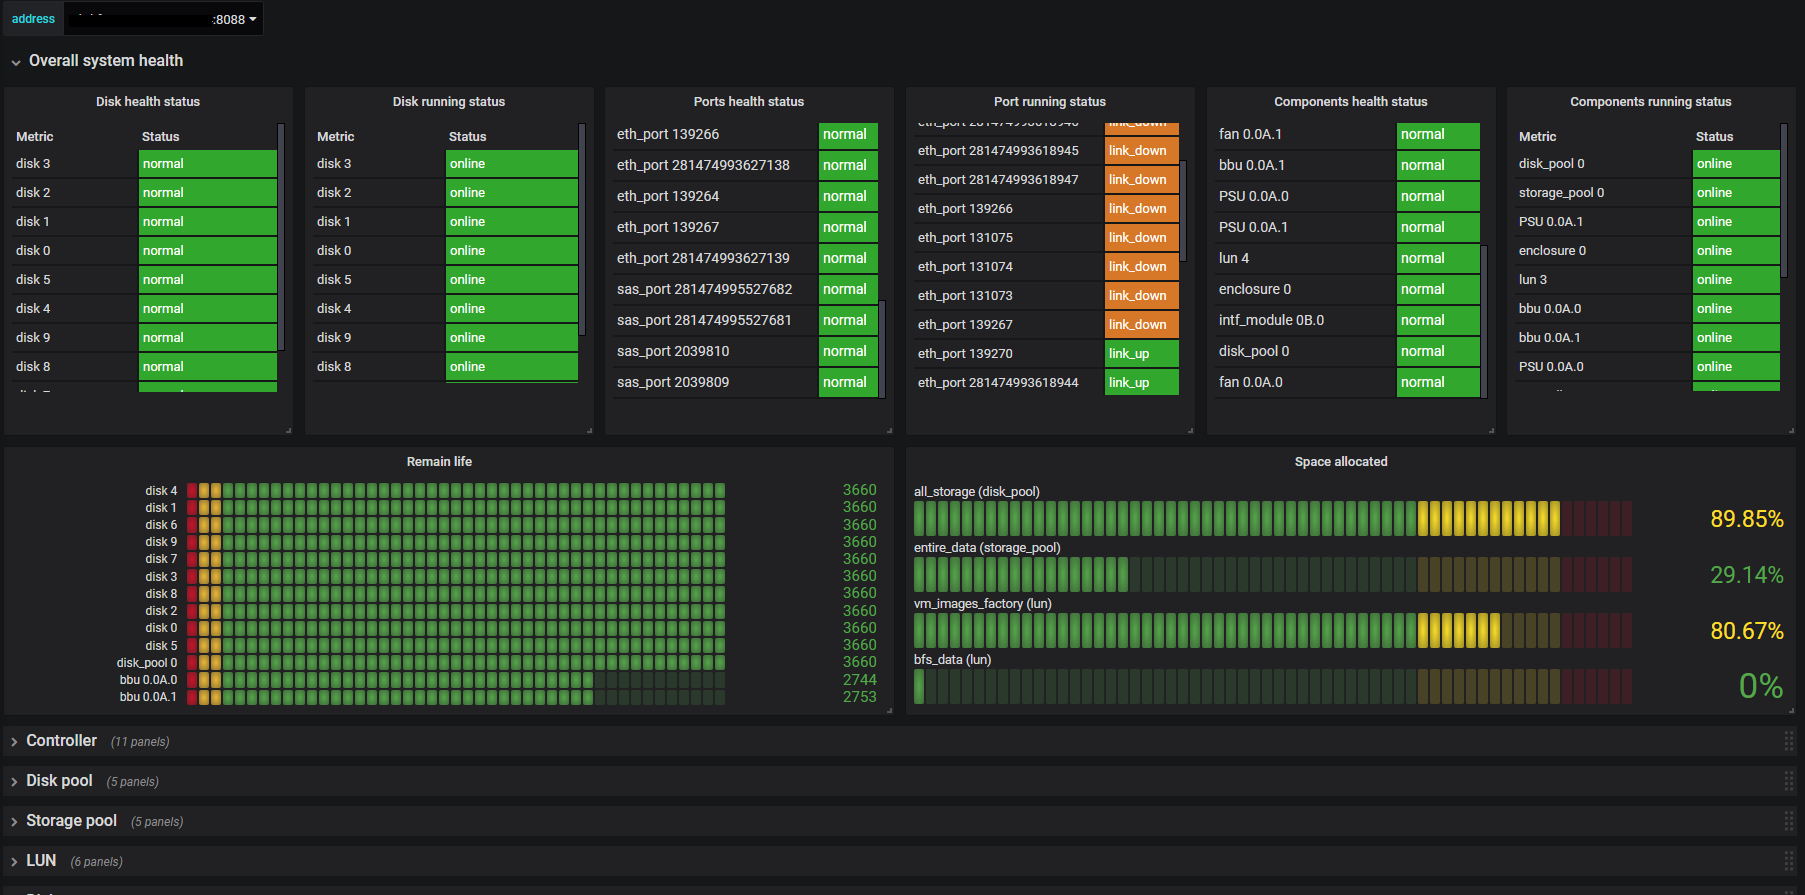
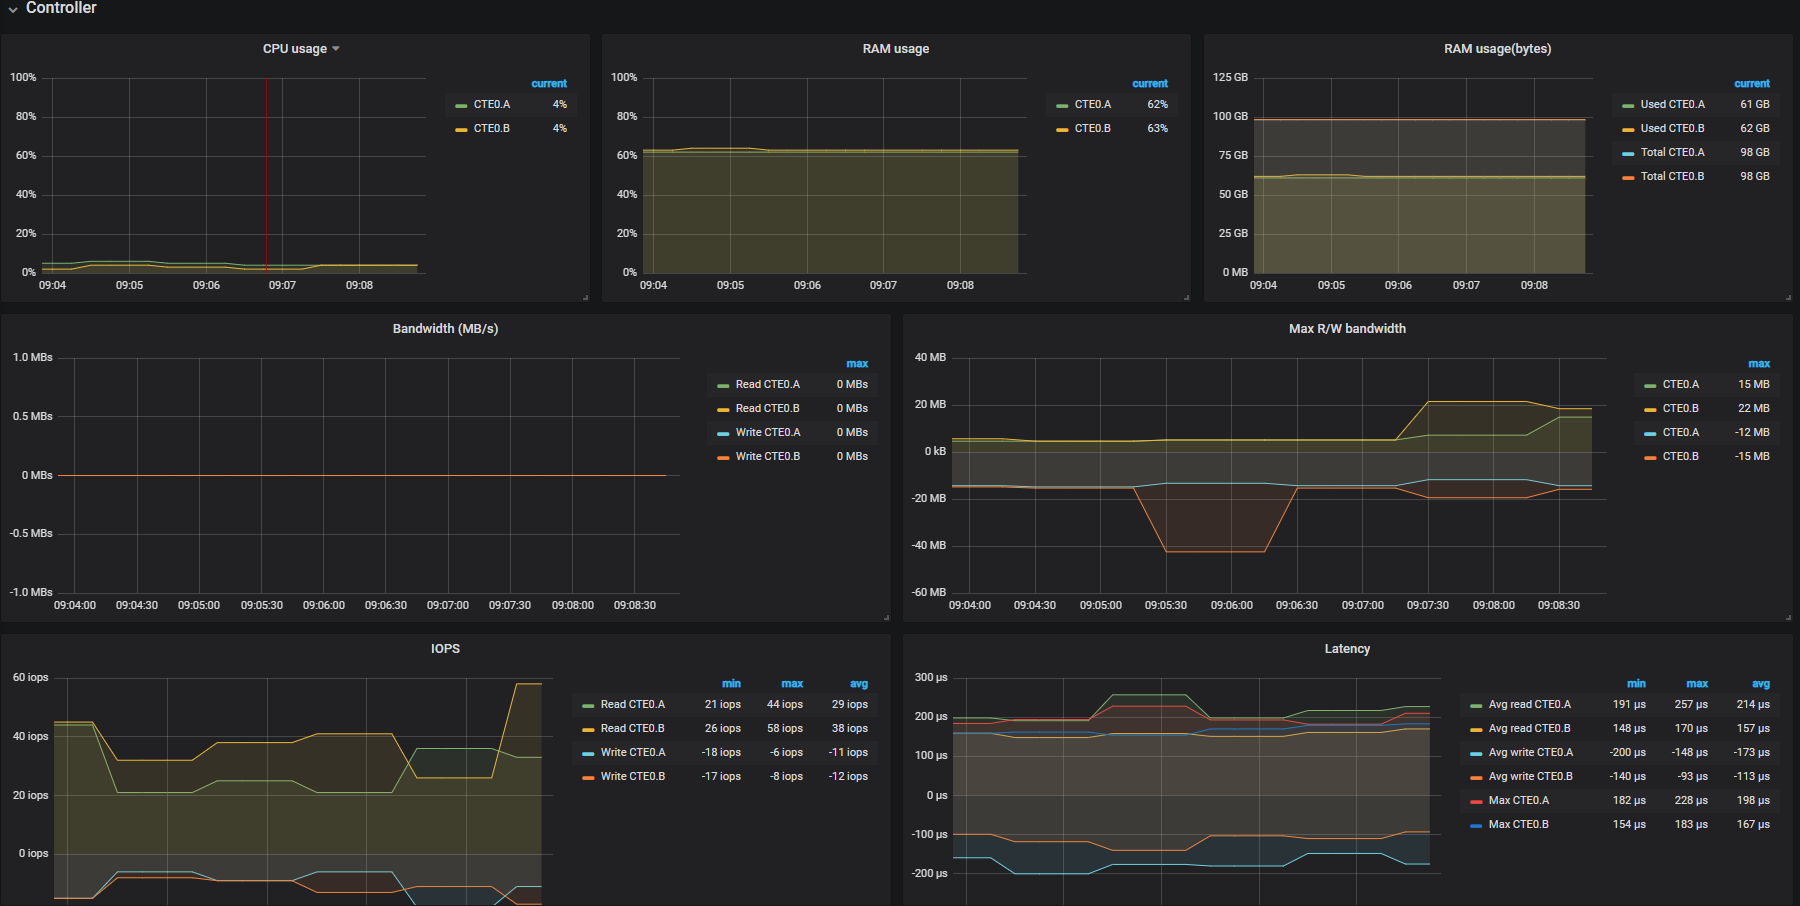
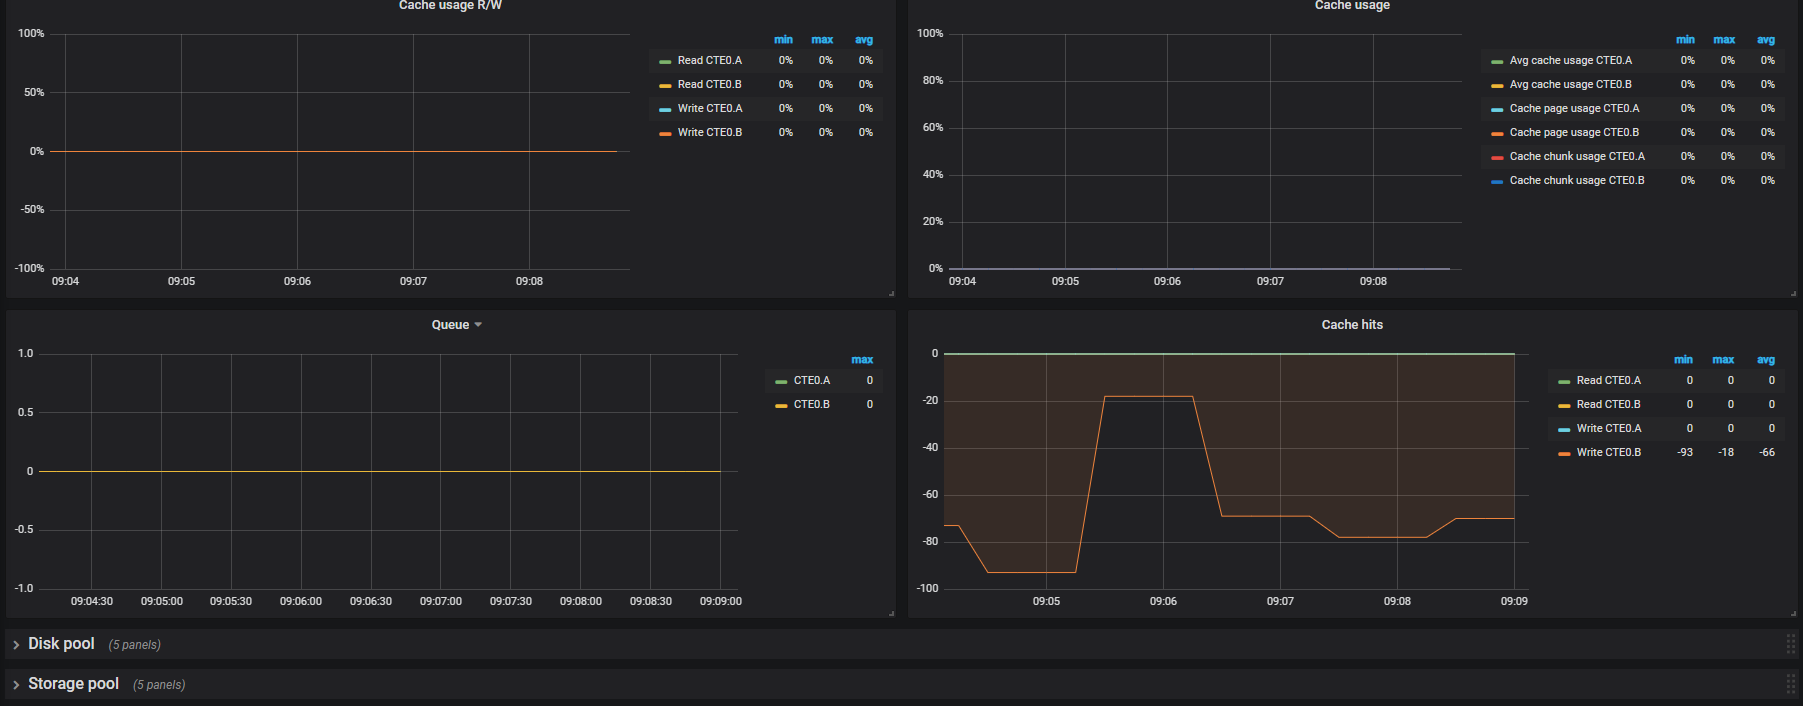
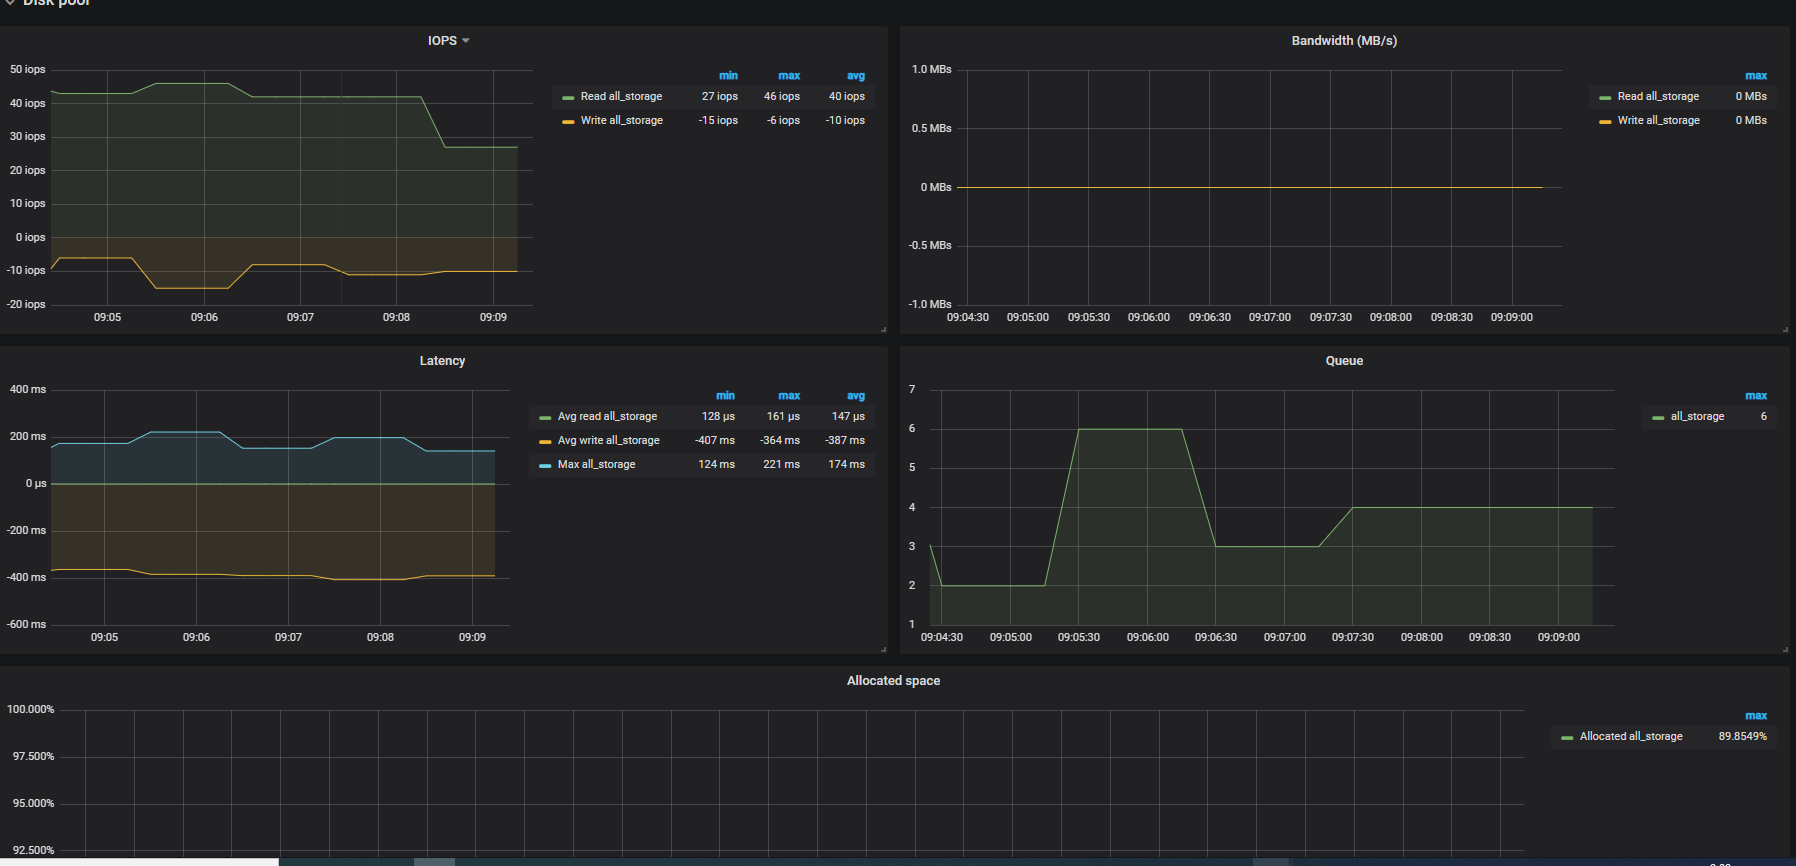
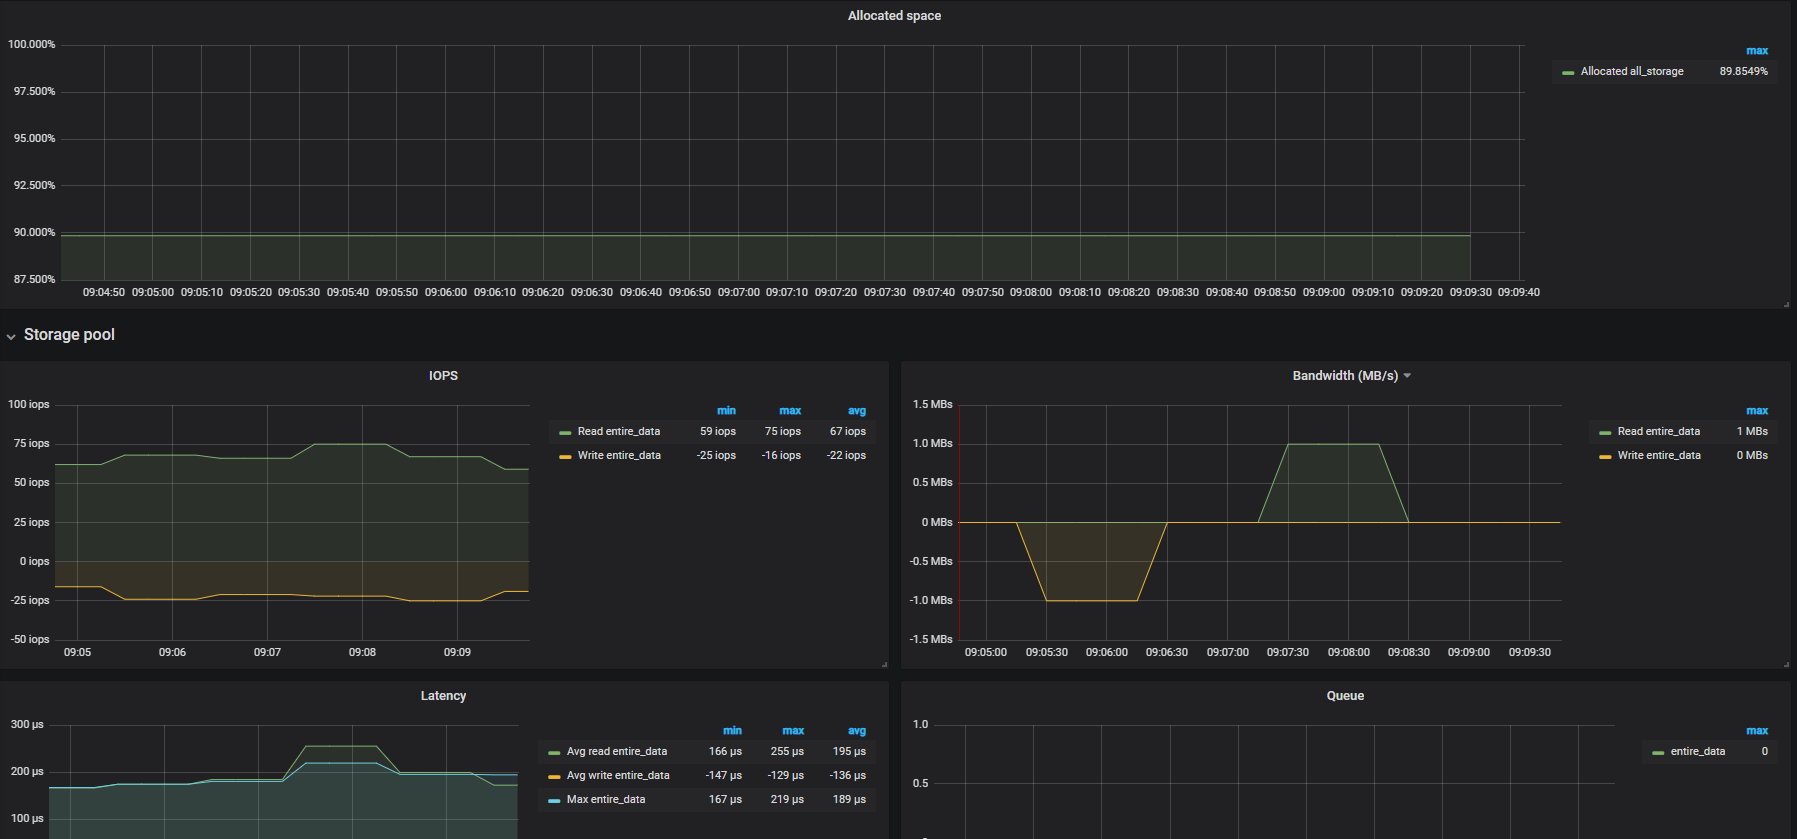
Dashboard displays almost all metrics listed
- Specify your Dorado superadmin credentials inside
dorado_exporter/config.ini. Admin is not able to collect metrics. So superadmin creds is the only option - Run
docker-compose build && docker-compose up - Configure prometheus to collect data from your_exporter_ip:9720. Note: you must pass your SAN address with "address" GET parameter (http://your_exporter_ip:9720?address=your_dorado_ip:port)
- Install Boomtable panel.
grafana-cli plugins install yesoreyeram-boomtable-panel - Import grafana/grafana_dashboard.json to your Grafana installation
- Enjoy =)
