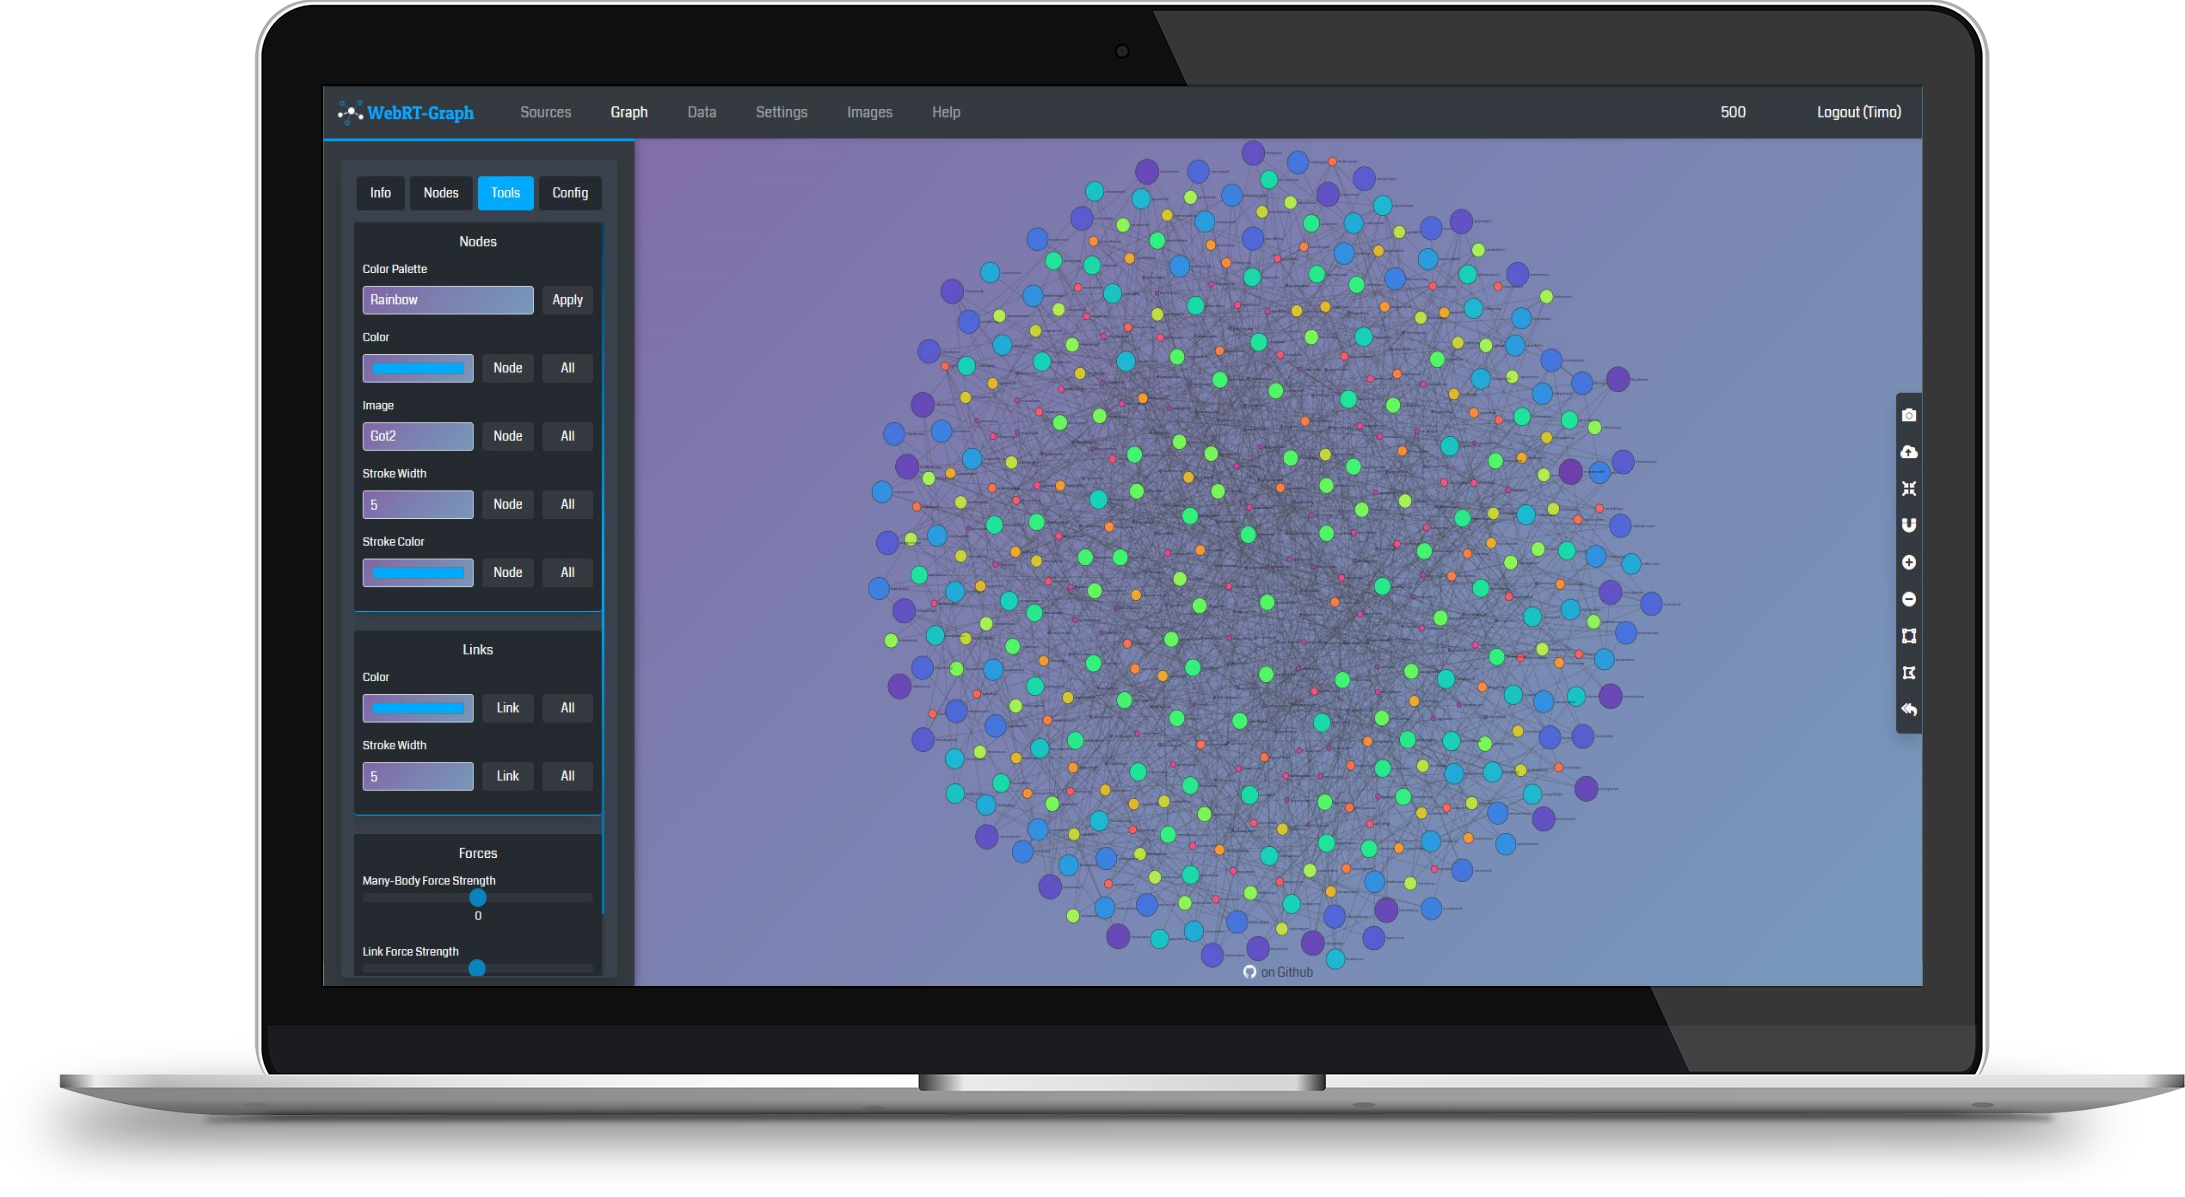
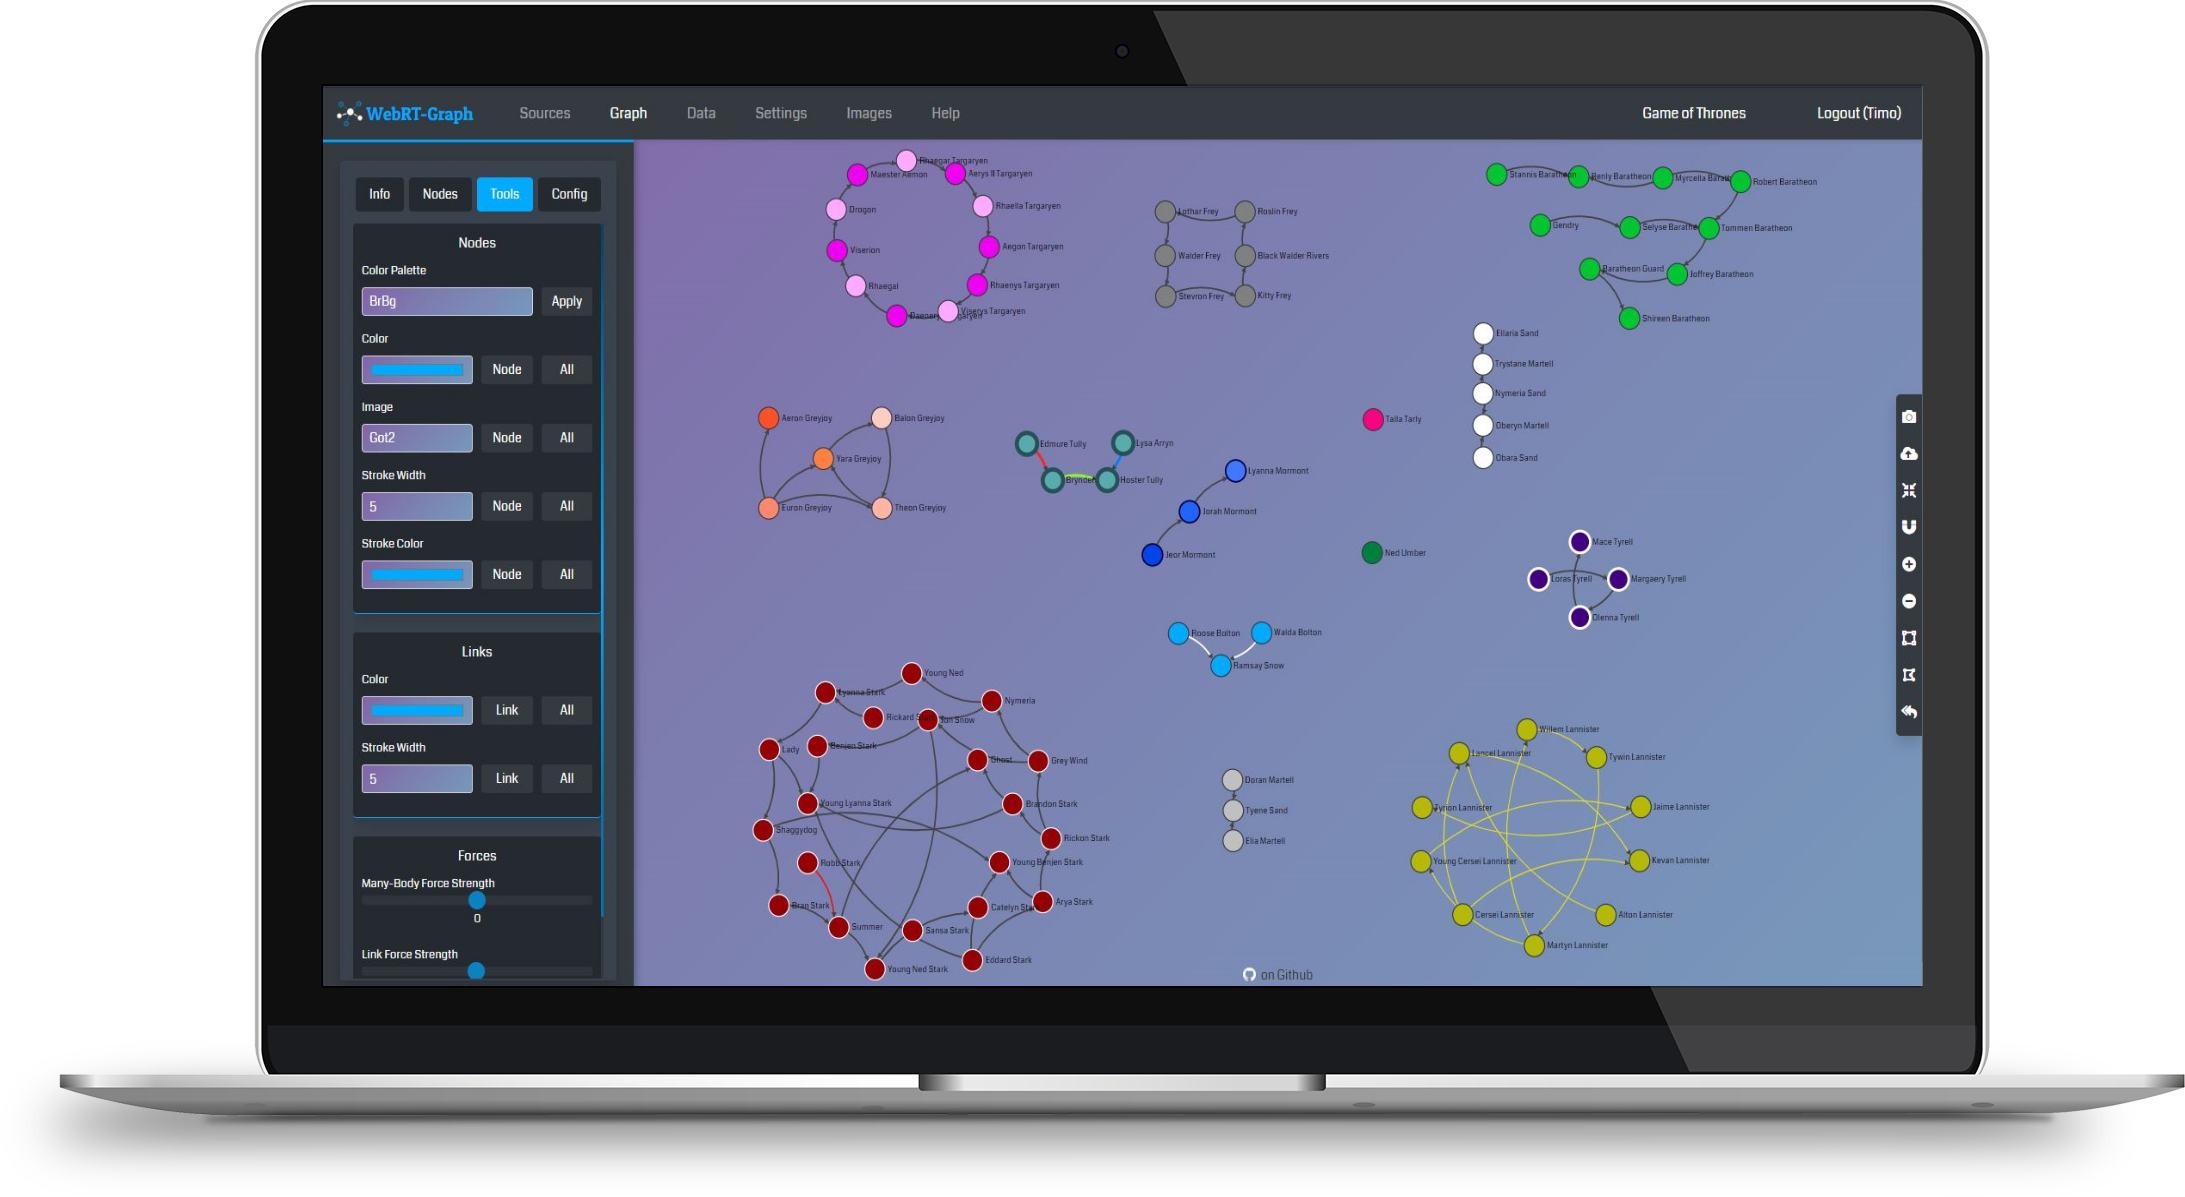
WebRT-Graph is a user-based web-application to analyze and visualize graph networks.
It's easy to use and designed to create beautiful graphs from arbitrary data.
Just import your data and define what fields are the nodes & links. That's it!
-
From Scratch - start a new graph from scratch with no data
-
Import - or import any structured data like JSON, XML & CSV files
-
Edit - add or remove nodes and links
-
Design - change color or sizes of your graph or add images on your nodes
-
Share - share your graph with other user to work together on it
-
Export - the graph as JSON or as an Image
-
And More - directed & undirected graphs, linear & curved links, weighted nodes, etc..
WebRT-Graph is based on Node.js and uses RethinkDB as data store.
-
install and run rethinkdb
-
edit
database.json(root directory) to define rethinkdb connection data -
start application with
npm run start -
open
http://localhost:8080in your browser
You'll need to download Node.js and RethinkDB first.
-
download RethinkDB and follow the install manual
-
download Node.js and run the setup file
-
download WebRT-Graph and extract the .zip file
-
open your command line tool and go into the root directory of
webrt-graph-master -
edit
database.json(root directory) to define RethinkDB connection data -
type in your command line window
npm run startto start the application -
open
http://localhost:8080in your browser


