

Made by Xinyu Chen • 🌐 https://twitter.com/chenxy346
awesome-latex-drawing is a collection which uses LaTeX to draw Bayesian networks, graphical models, tensor structure, and technical frameworks.
LaTeX is a high-quality typesetting system, and it is available as a free software. In recent years, it is very popular for creating some graphics by using LaTeX because LaTeX is able to draw many complicated graphics containing math equations. For many programming languages like Python, installing console and related packages is the first step. If you prefer not to install LaTeX on your own computer, overleaf.com is a good option. overleaf.com gives you the full capabilities of LaTeX without installing any stuff, it supports writing and compiling .tex file on your web browser and can be asscessible for any laptops with an Internet connection.
Table of Examples
- Bayesian network of Bayesian CP factorization (BCPF)
- Bayesian network of Bayesian Gaussian CP (BGCP) factorization
- Bayesian network of Bayesian augmented tensor factorization (BATF)
- Bayesian network of Bayesian temporal matrix factorization (BTMF)
Open overleaf.com in your Chrome.
It is not necessary to open each file in this repository because you can just follow this readme document.
Looking for some good LaTeX drawing examples? Here is a few (20+) to peruse.
LaTeX provides some powerful domain-specific packages and tools like tikz to enable flexible graphical models.
This example is from the following paper:
- Qibin Zhao, Liqing Zhang, Andrzej Cichocki (2015). Bayesian CP factorization of incomplete tensors with automatic rank determination. IEEE Transactions on Pattern Analysis and Machine Intelligence, 37(9): 1751-1763.
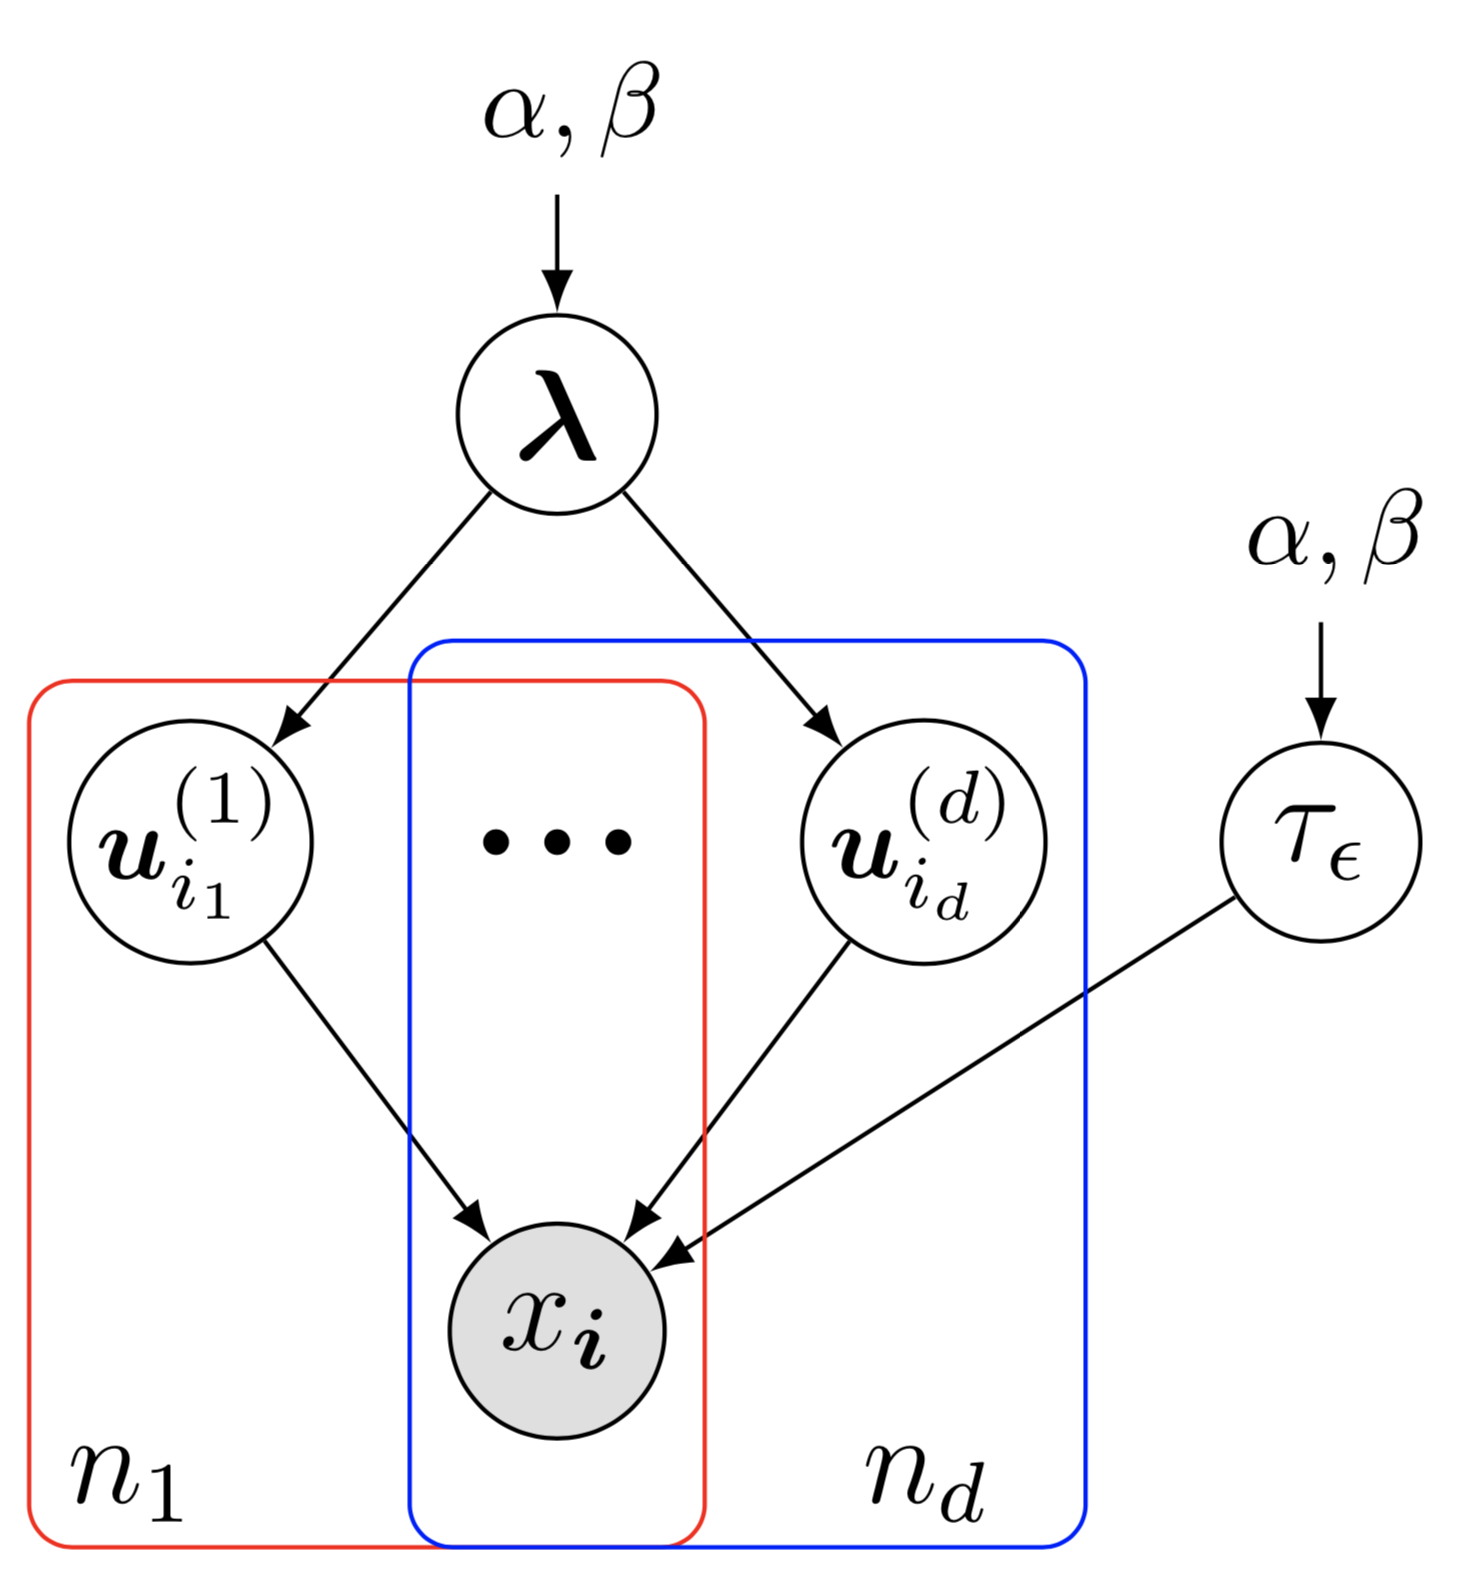 which shows the Bayesian network of Bayesian CP factorization (BCPF) model. To draw this Bayesian network example, there are some preliminaries to follow:
preamblecodes:- define the
documentclassasstandalone, e.g.,\documentclass[border = 0.1cm]{standalone}with 0.1cm border, - use package
tikzin preamble, i.e.,\usepackage{tikz}, and usetikzlibrary like\usetikzlibrary{bayesnet}which is an important tool for drawing Bayesian networks and directed factor graph, - set the
tikzstyle by using the\tikzstyle{}command, - use math equation environments including
\usepackage{amsfonts, amsmath, amssymb}.
- define the
bodycodes:- use
\begin{tikzpicture} \end{tikzpicture}to start drawing, - use
\nodeto define nodes and text boxes in the Bayesian network, - use
\pathto define arrows in the Bayesian network, - use
\plateto define plates in the Bayesian network.
- use
Please click on the image and check out the source code.
This example is from the following paper:
Xinyu Chen, Zhaocheng He, Lijun Sun (2019). A Bayesian tensor decomposition approach for spatiotemporal traffic data imputation. Transportation Research Part C: Emerging Technologies, 98: 73-84.
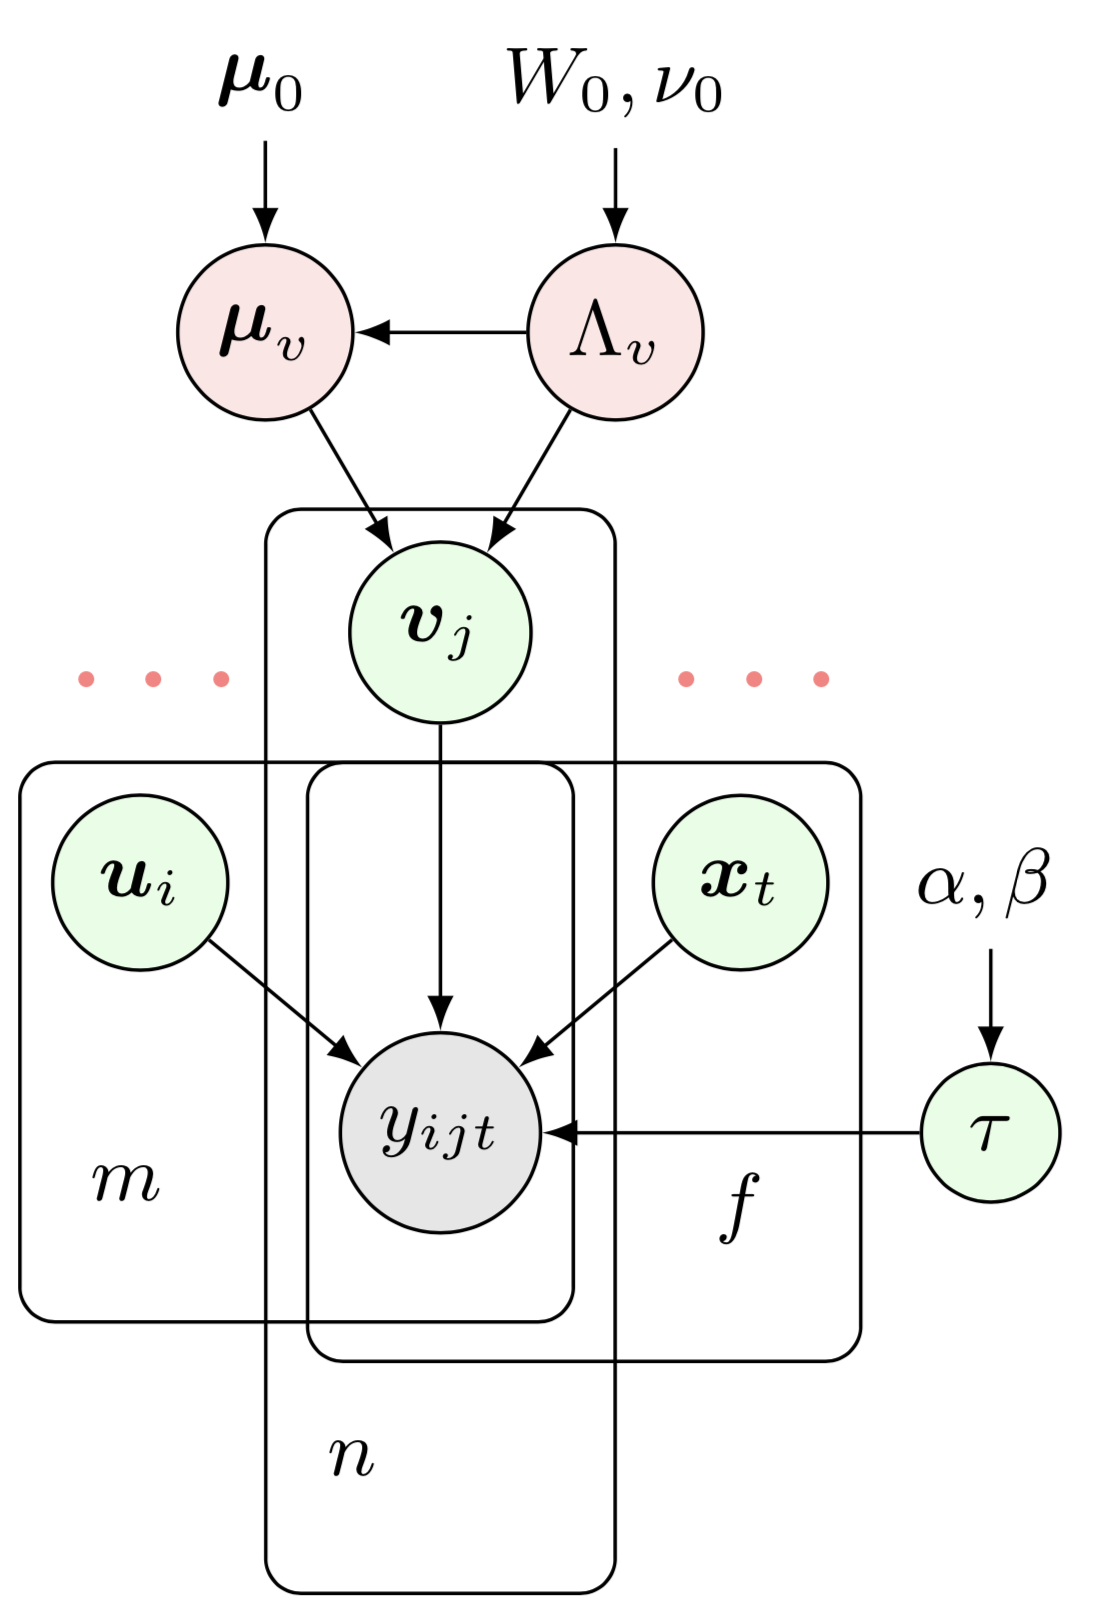 which shows the Bayesian network of Bayesian Gaussian CP factorization (BGCP) model. To draw this Bayesian network example, there are some preliminaries to follow:
preamblecodes:- define the
documentclassasstandalone, e.g.,\documentclass[border = 0.1cm]{standalone}with 0.1cm border, - use package
tikzin preamble, i.e.,\usepackage{tikz}, and usetikzlibrary like\usetikzlibrary{bayesnet}which is an important tool for drawing Bayesian networks and directed factor graph, - set the
tikzstyle by using the\tikzstyle{}command, - use math equation environments including
\usepackage{amsmath, amsfonts, amssymb}.
- define the
bodycodes:- use
\begin{tikzpicture} \end{tikzpicture}to start drawing, - use
\nodeto define nodes and text boxes in the Bayesian network, - use
\pathto define arrows in the Bayesian network, - use
\plateto define plates in the Bayesian network.
- use
Please click on the image and check out the source code. If you are interested in the original Bayesian network of BGCP in the paper, please check out BGCP.tex.
This example is from the following paper:
Xinyu Chen, Zhaocheng He, Yixian Chen, Yuhuan Lu, Jiawei Wang (2019). Missing traffic data imputation and pattern discovery with a Bayesian augmented tensor factorization model. Transportation Research Part C: Emerging Technologies, 104: 66-77.
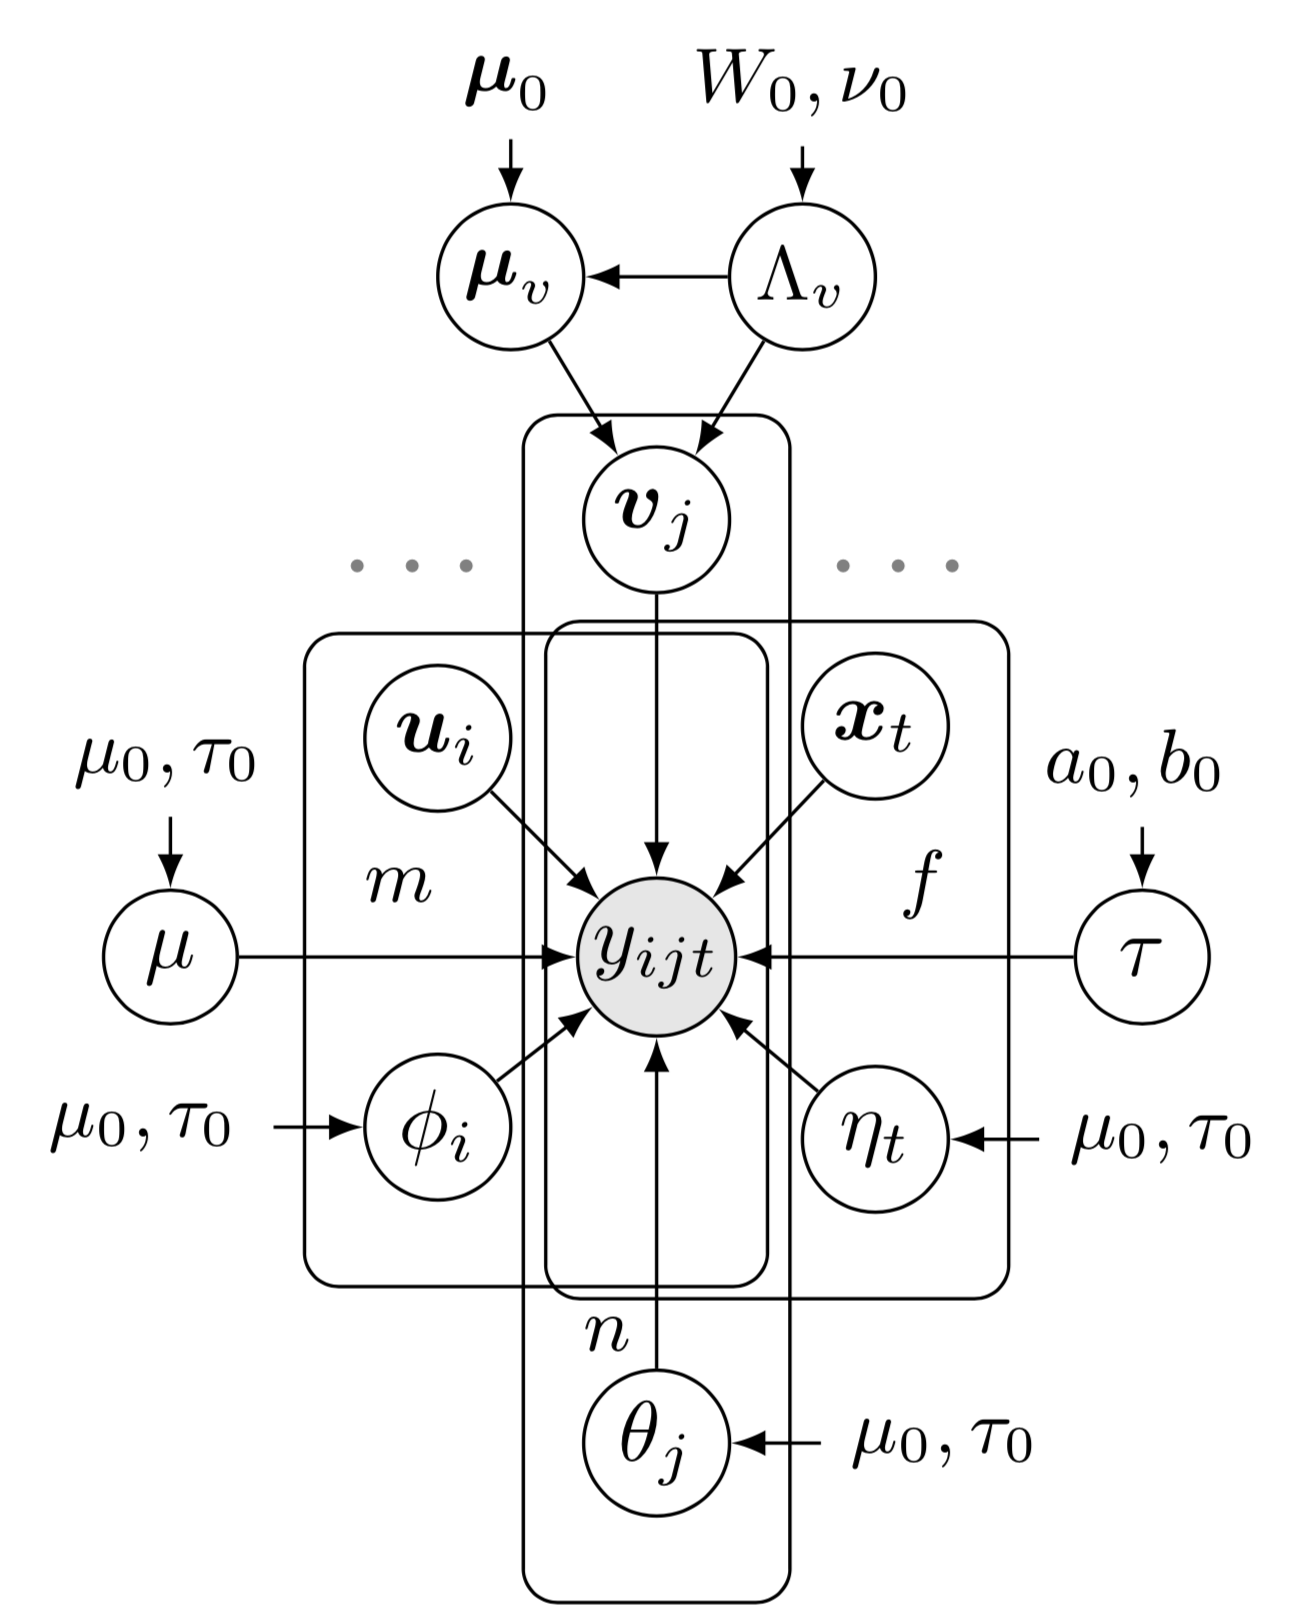 which shows the Bayesian network of Bayesian augmented tensor factorization (BATF) model. To draw this Bayesian network example, there are some preliminaries to follow:
preamblecodes:- define the
documentclassasstandalone, e.g.,\documentclass[border = 0.1cm]{standalone}with 0.1cm border, - use package
tikzin preamble, i.e.,\usepackage{tikz}, and usetikzlibrary like\usetikzlibrary{bayesnet}which is an important tool for drawing Bayesian networks and directed factor graph, - set the
tikzstyle by using the\tikzstyle{}command, - use math equation environments including
\usepackage{amsmath, amsfonts, amssymb}.
- define the
bodycodes:- use
\begin{tikzpicture} \end{tikzpicture}to start drawing, - use
\nodeto define nodes and text boxes in the Bayesian network, - use
\pathto define arrows in the Bayesian network, - use
\plateto define plates in the Bayesian network.
- use
Please click on the image and check out the source code.
This example is from the following paper:
Xinyu Chen, Lijun Sun (2021). Bayesian temporal factorization for multidimensional time series prediction. IEEE Transactions on Pattern Analysis and Machine Intelligence. (Early access)
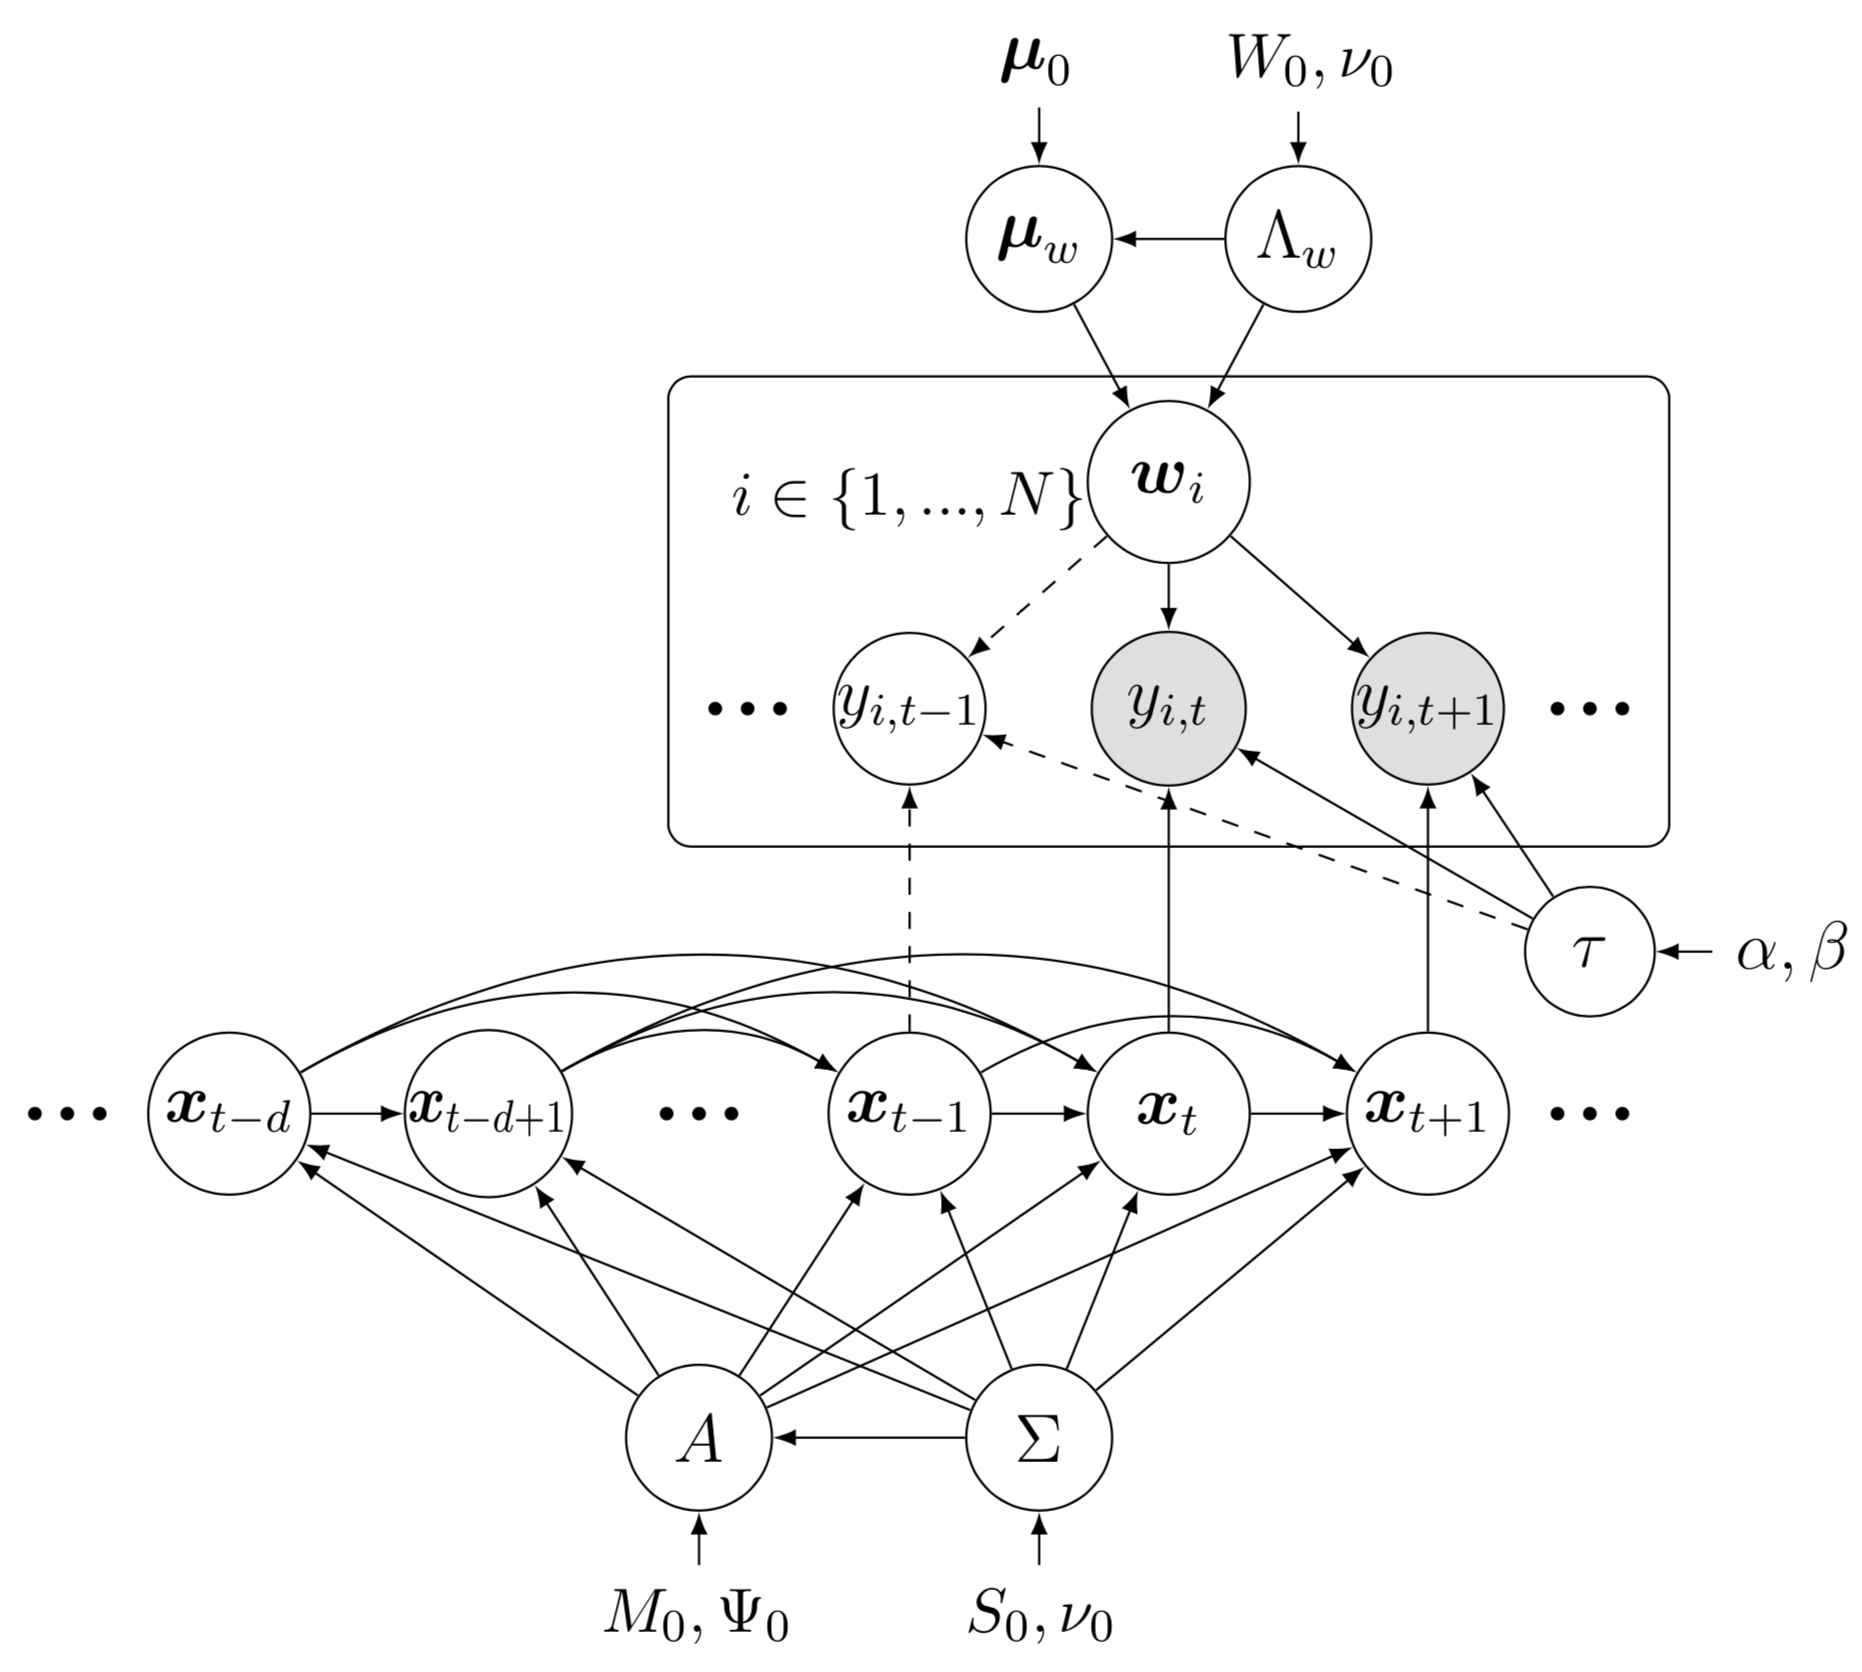 which shows the Bayesian network of Bayesian temporal matrix factorization (BTMF) model. To draw this Bayesian network example, there are some preliminaries to follow:
preamblecodes:- define the
documentclassasstandalone, e.g.,\documentclass[border = 0.1cm]{standalone}with 0.1cm border, - use package
tikzin preamble, i.e.,\usepackage{tikz}, and usetikzlibrary like\usetikzlibrary{bayesnet}which is an important tool for drawing Bayesian networks and directed factor graph, - set the
tikzstyle by using the\tikzstyle{}command, - use math equation environments including
\usepackage{amsmath, amsfonts, amssymb}.
- define the
bodycodes:- use
\begin{tikzpicture} \end{tikzpicture}to start drawing, - use
\nodeto define nodes and text boxes in the Bayesian network, - use
\pathto define arrows in the Bayesian network, - use
\plateto define plates in the Bayesian network.
- use
Please click on the image and check out the source code. Instead of multivariate vector autoregressive process on temporal factors, we can also use univariate autoregressive process to rebuild BTMF. The Beyasian network is available at btmf_net.png, you can also check out the source code btmf_net.tex.
- Open
- Upload
in your overleaf project, then you will see the following picture:

Figure 7: Tensor completion task and its framework including data organization and tensor completion, in which traffic measurements are partially observed.
- Open rolling_prediction_strategy.tex in your overleaf project, then you will see the following picture:
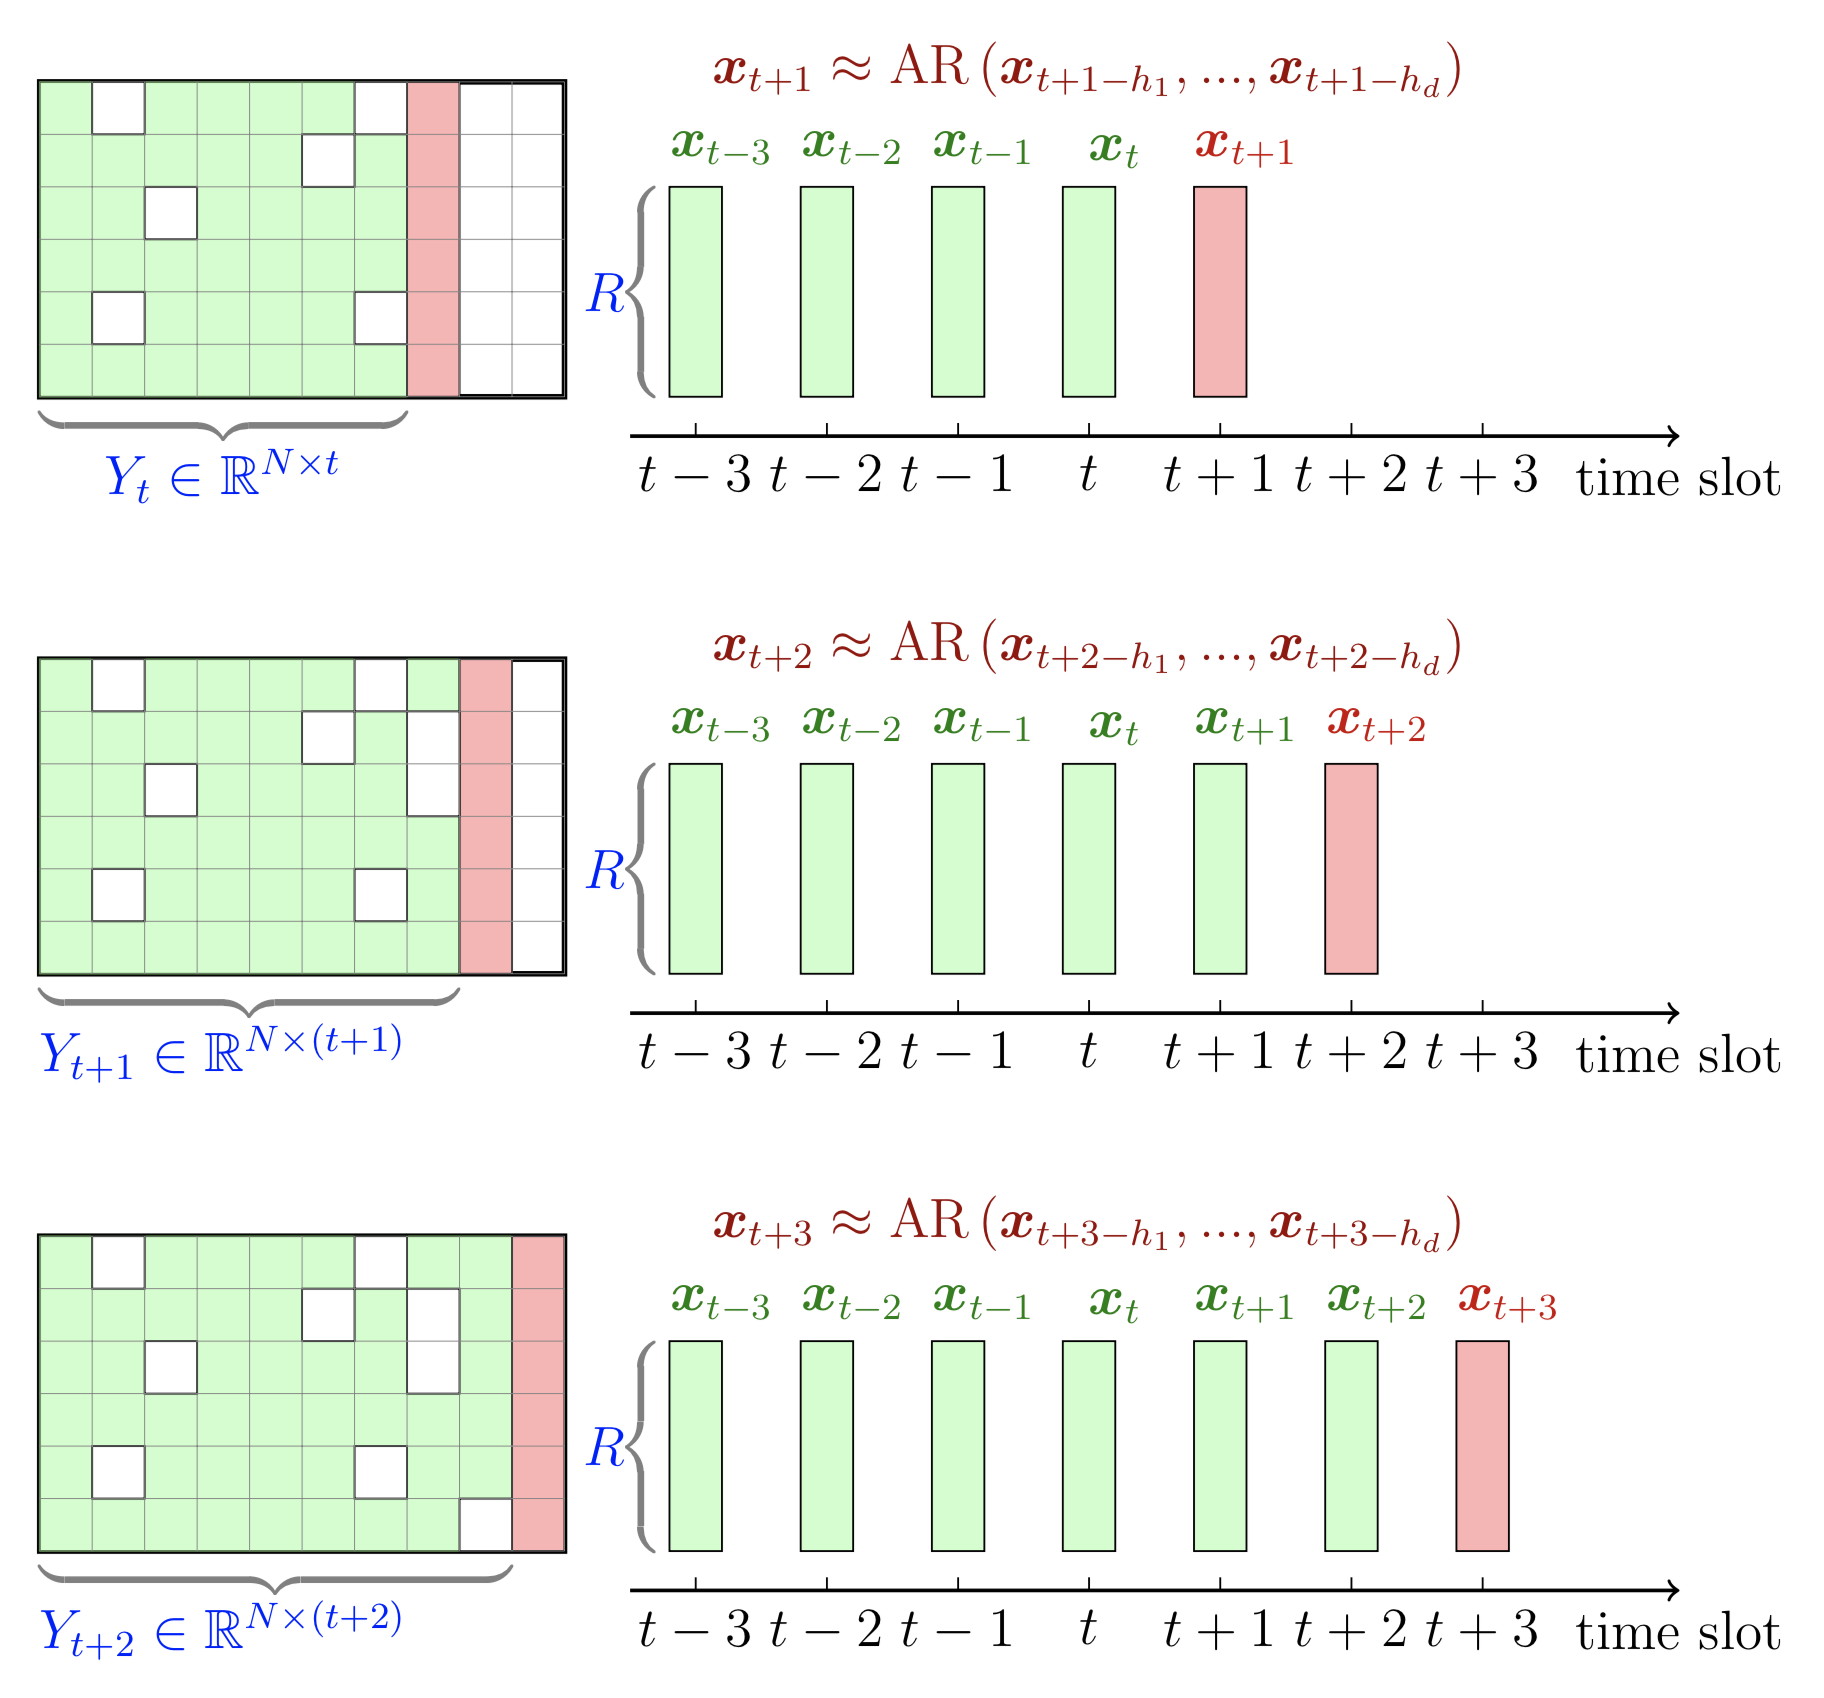
Figure 8: A graphical illustration of rolling prediction strategy with temporal matrix factorization and autoregressive model.
- Open rolling_prediction.tex in your overleaf project, then you will see the following picture:
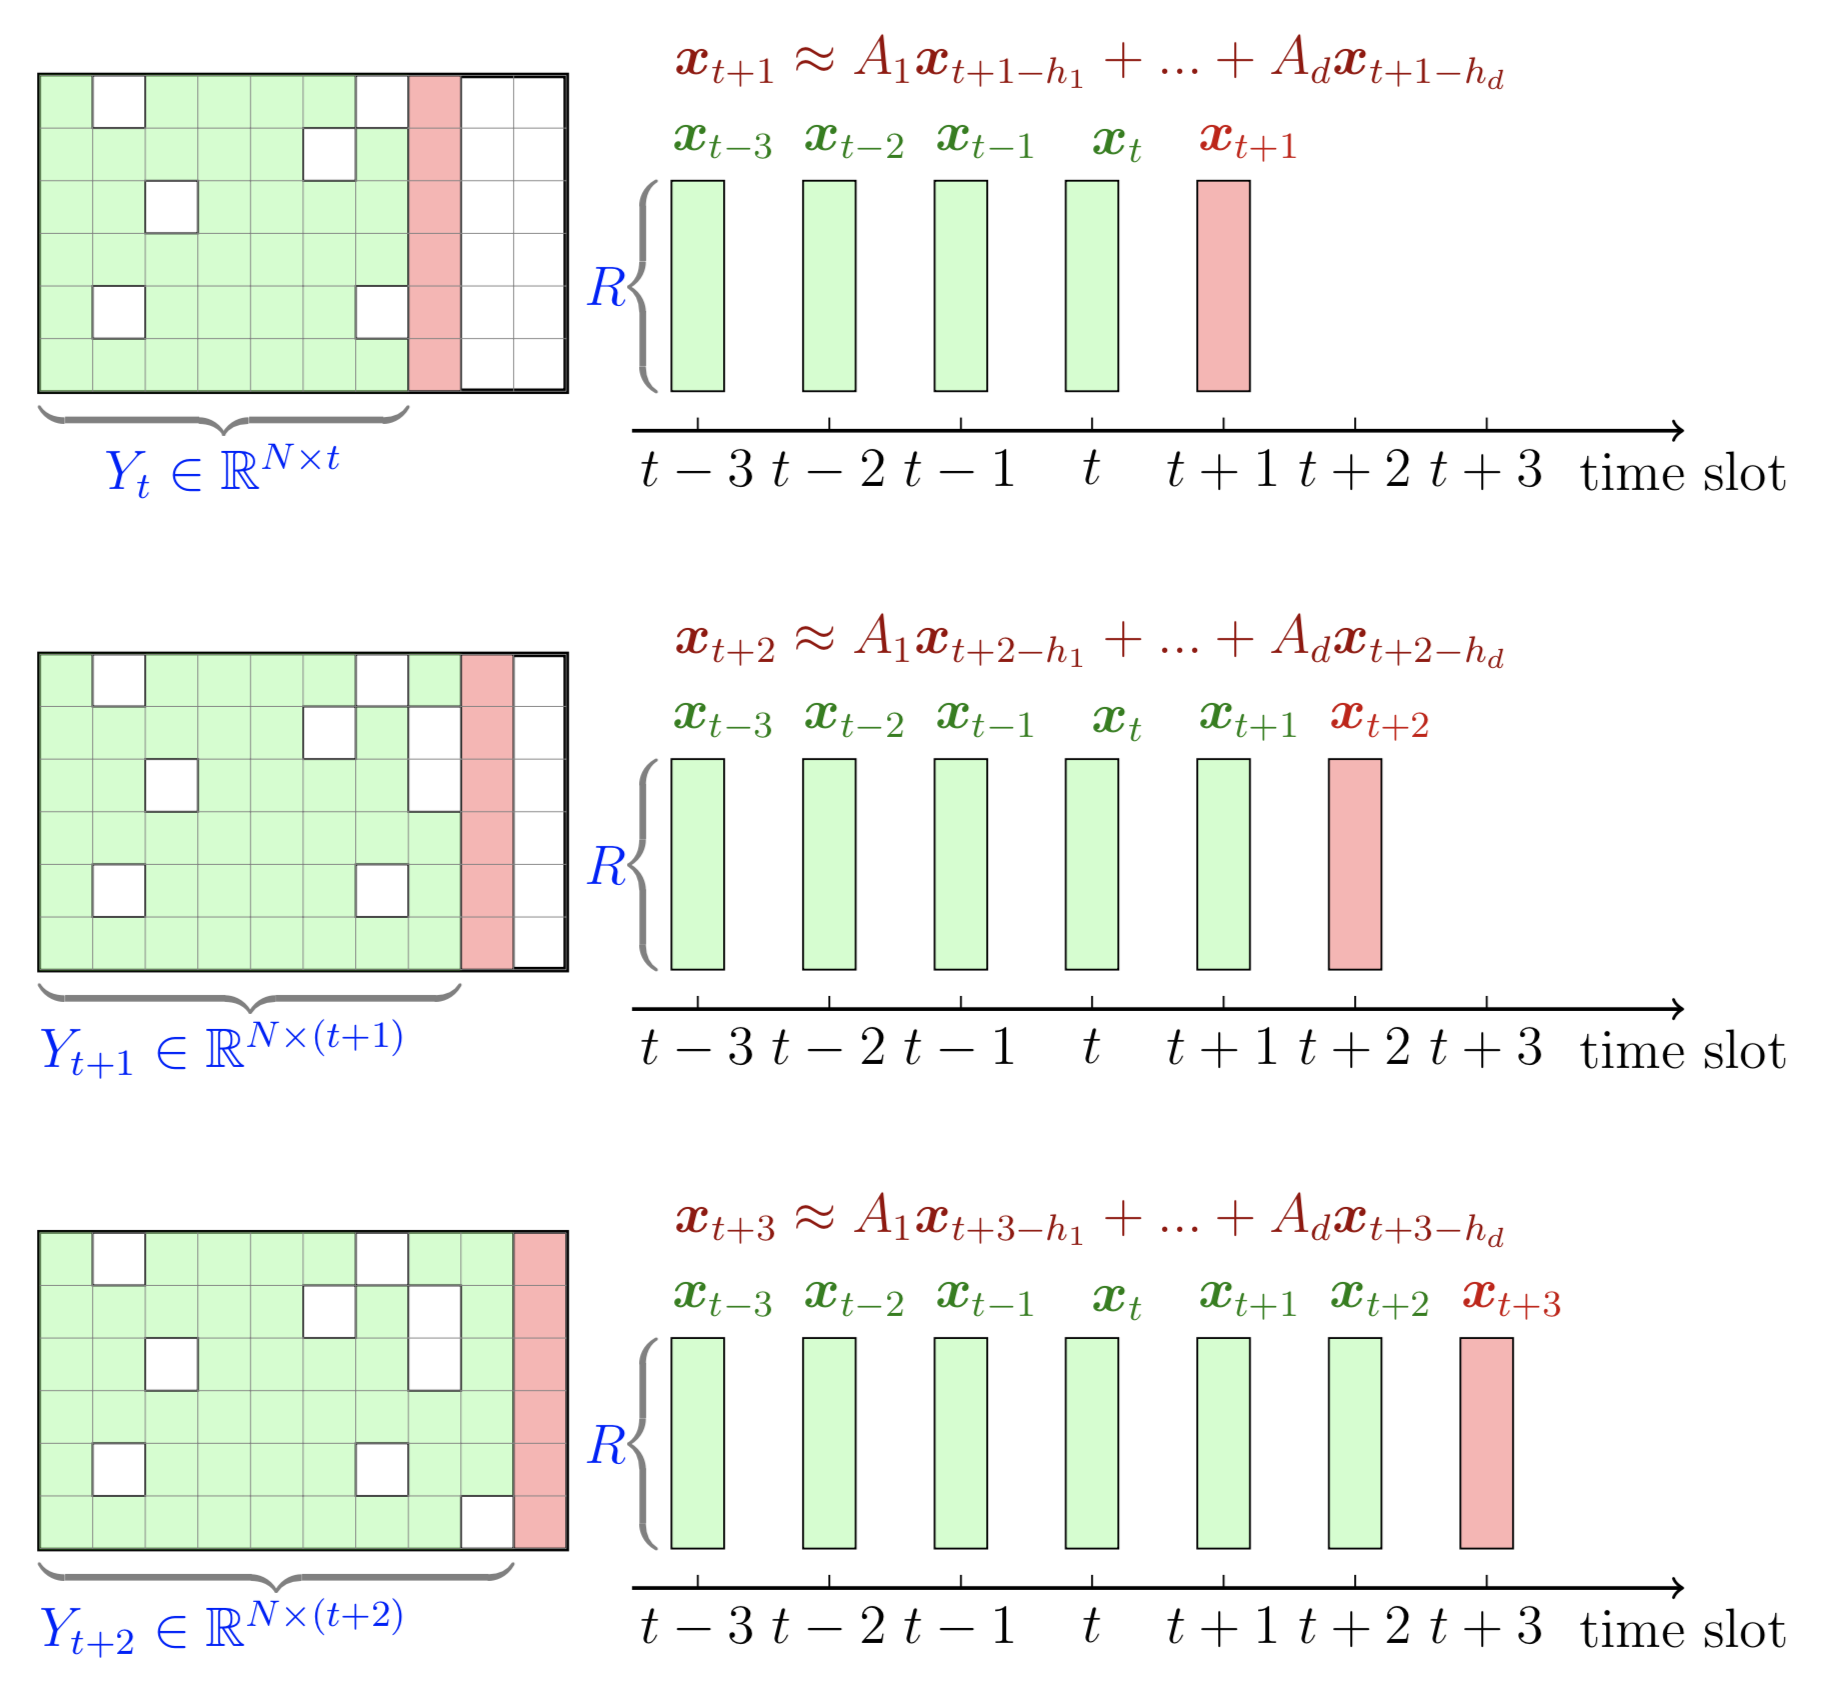
Figure 9: A graphical illustration of rolling prediction strategy with temporal matrix factorization and vector autoregressive model.
- Open graphical_time_series.tex in your overleaf project, then you will see the following picture:
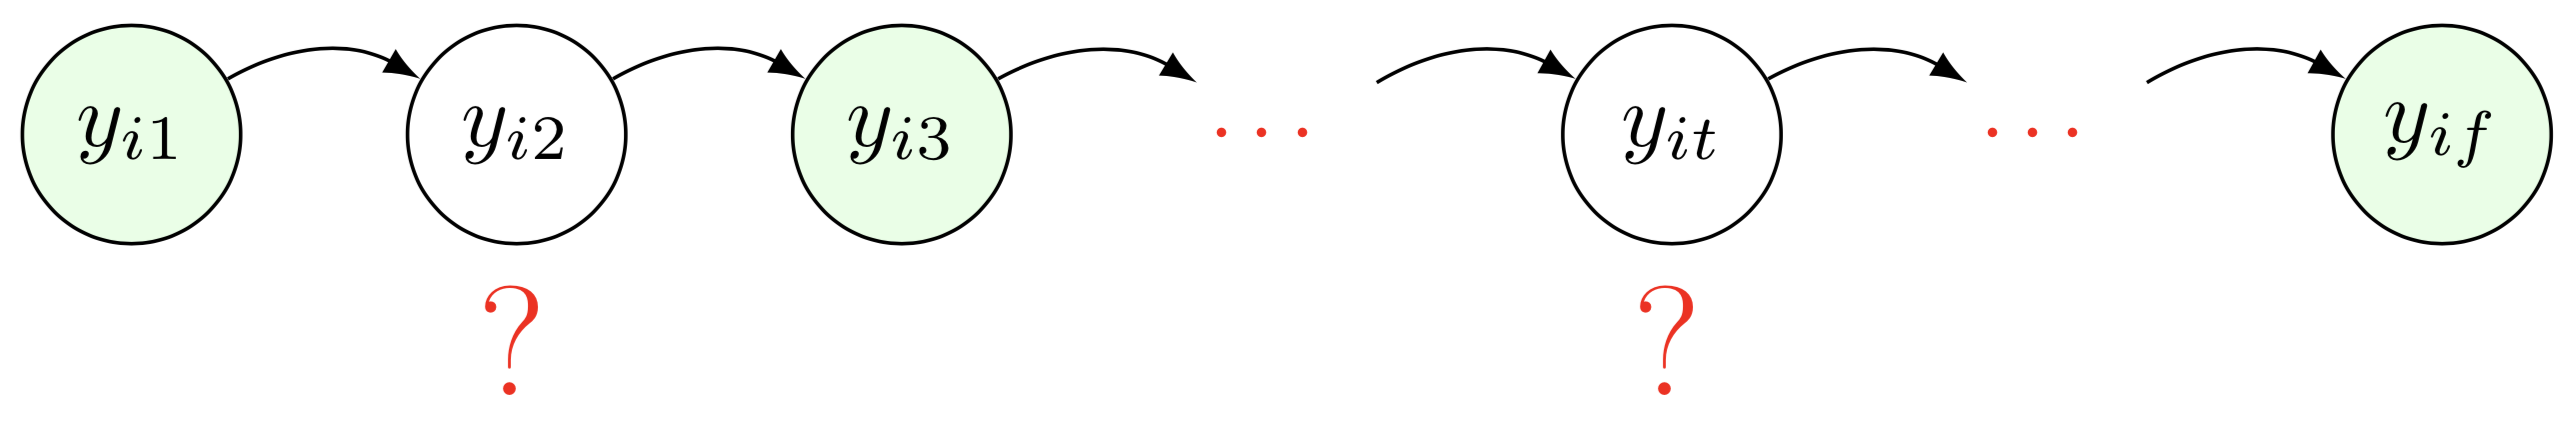
Figure 10: A graphical illustration of the partially observed time series data.
- Open tensor_time_series.tex in your overleaf project, then, you will see the following picture:
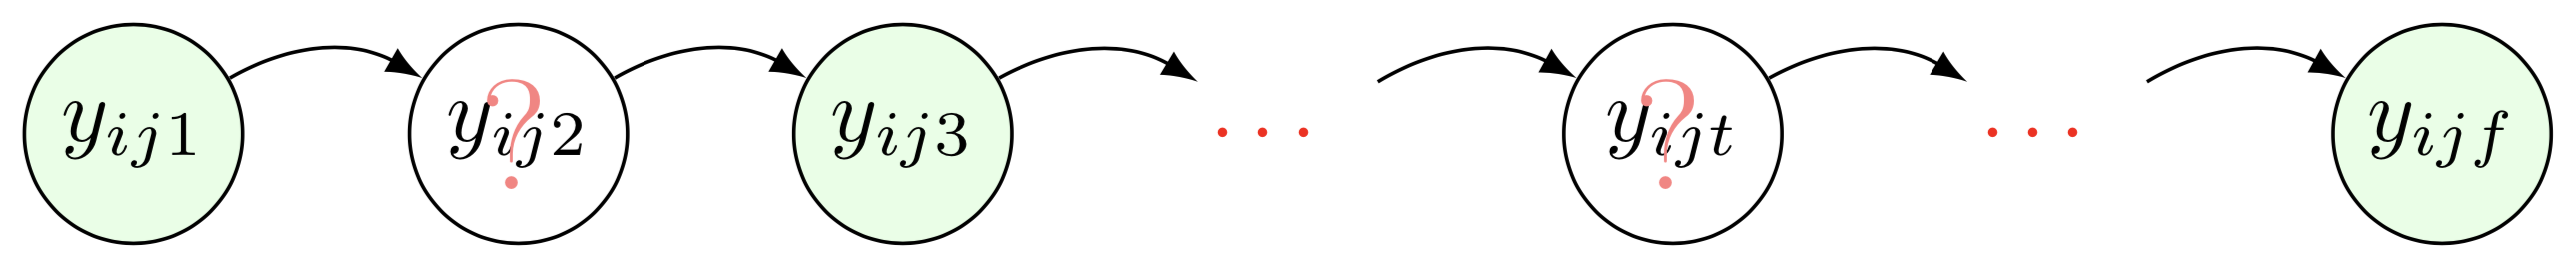
Figure 11: A graphical illustration of the partially observed time series tensor.
- Open graphical_matrix_time_series.tex in your overleaf project, then you will see the following picture:
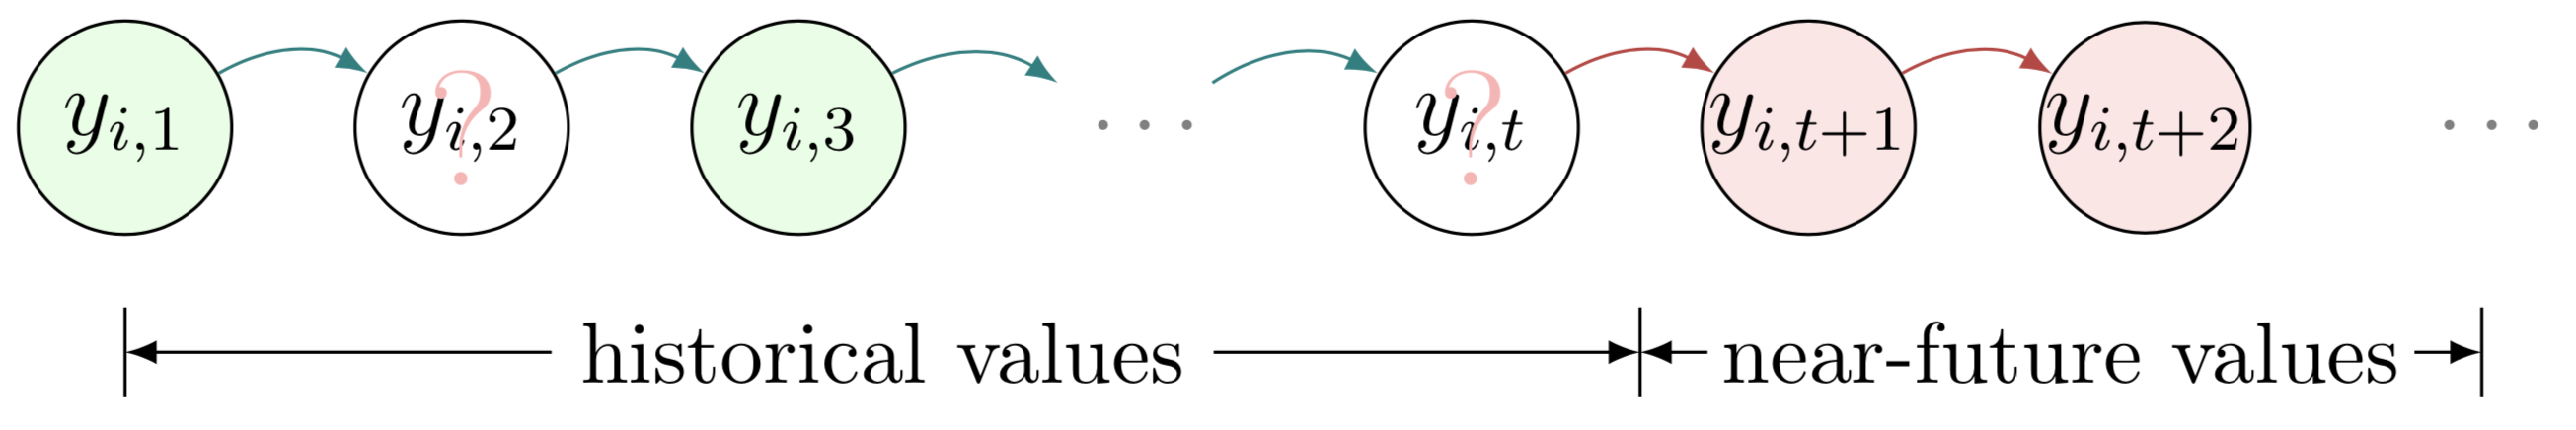
Figure 12: Multivariate time series data prediction with missing values.
- Open graphical_tensor_time_series.tex in your overleaf project, then you will see the following picture:
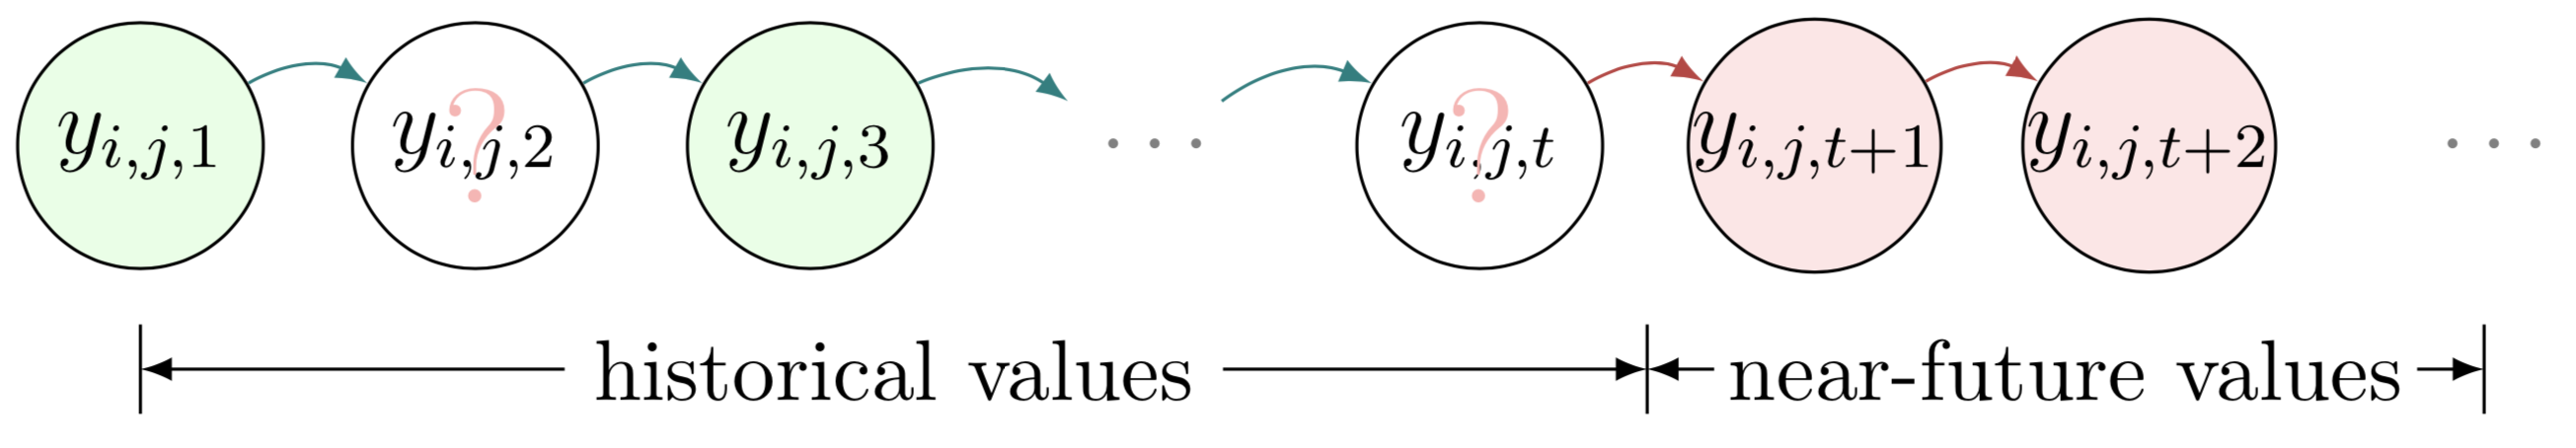
Figure 13: Tensor time series data prediction with missing values.
- Open mf-explained.tex in your overleaf project, then you will see the following picture:
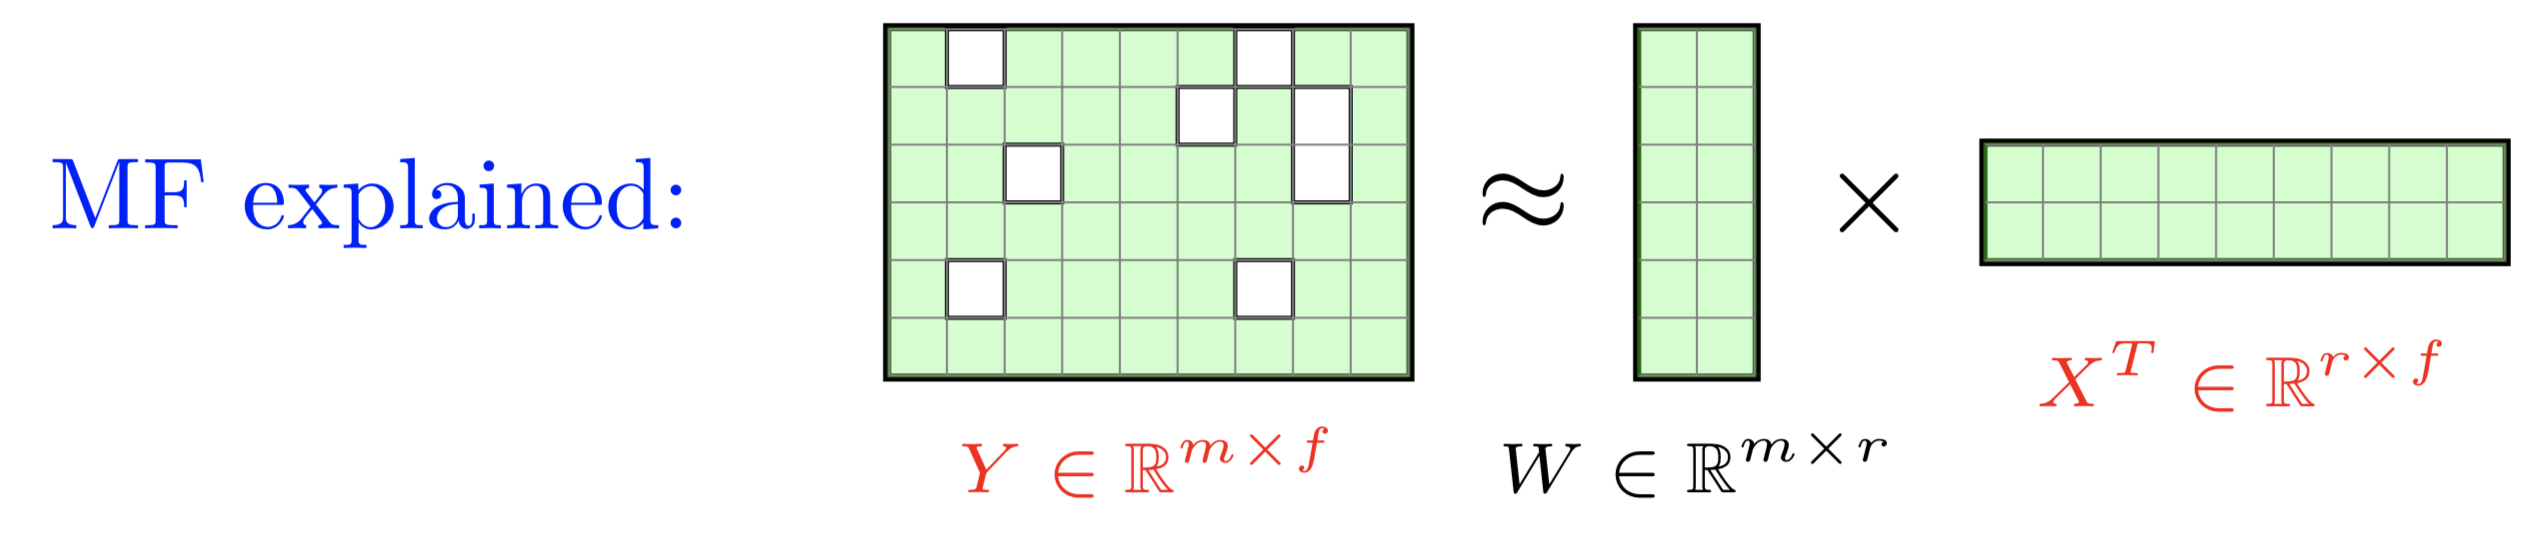
Figure 14: A graphical illustration of matrix factorization.
- Open LRTC-flow.tex and upload
in your overleaf project, then you will see the following picture:
Figure 15: A graphical illustration of low-rank tensor completion model.
- Open latc_framework in your overleaf project, then you will see the following picture:
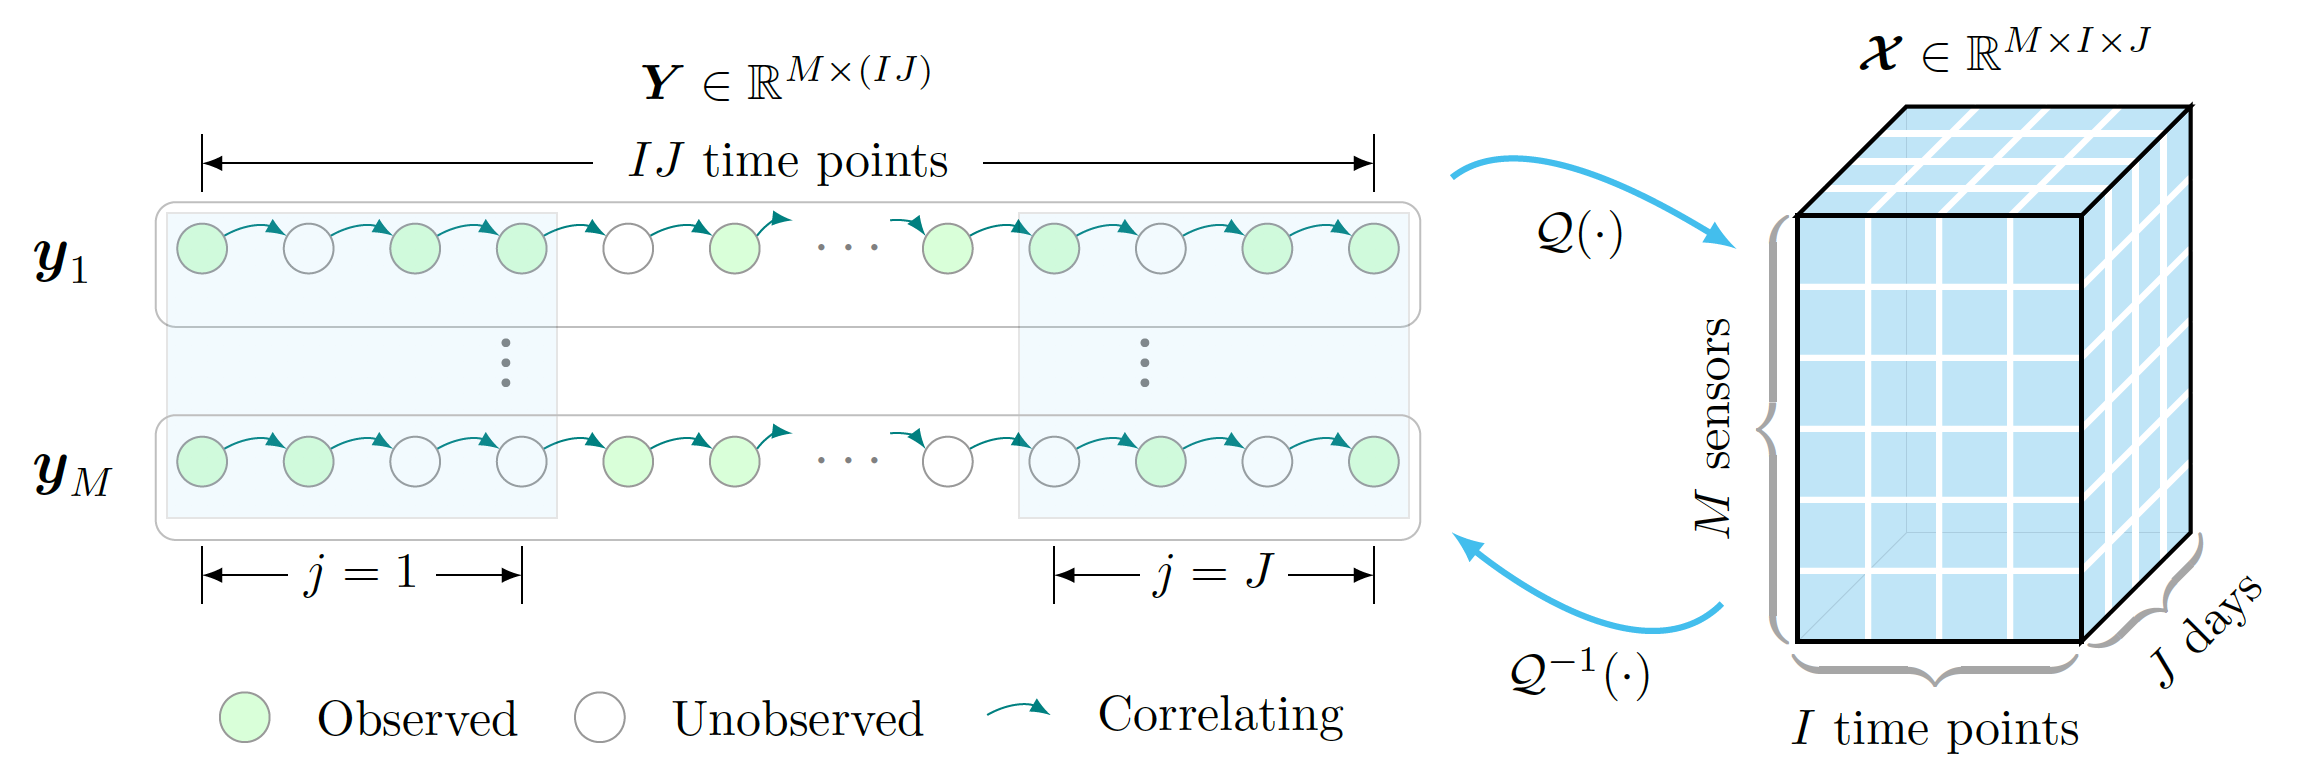
Figure 16: A graphical illustration of low-rank autoregressive tensor completion model.
- Open tensor.tex in your overleaf project, then you will see the following picture:
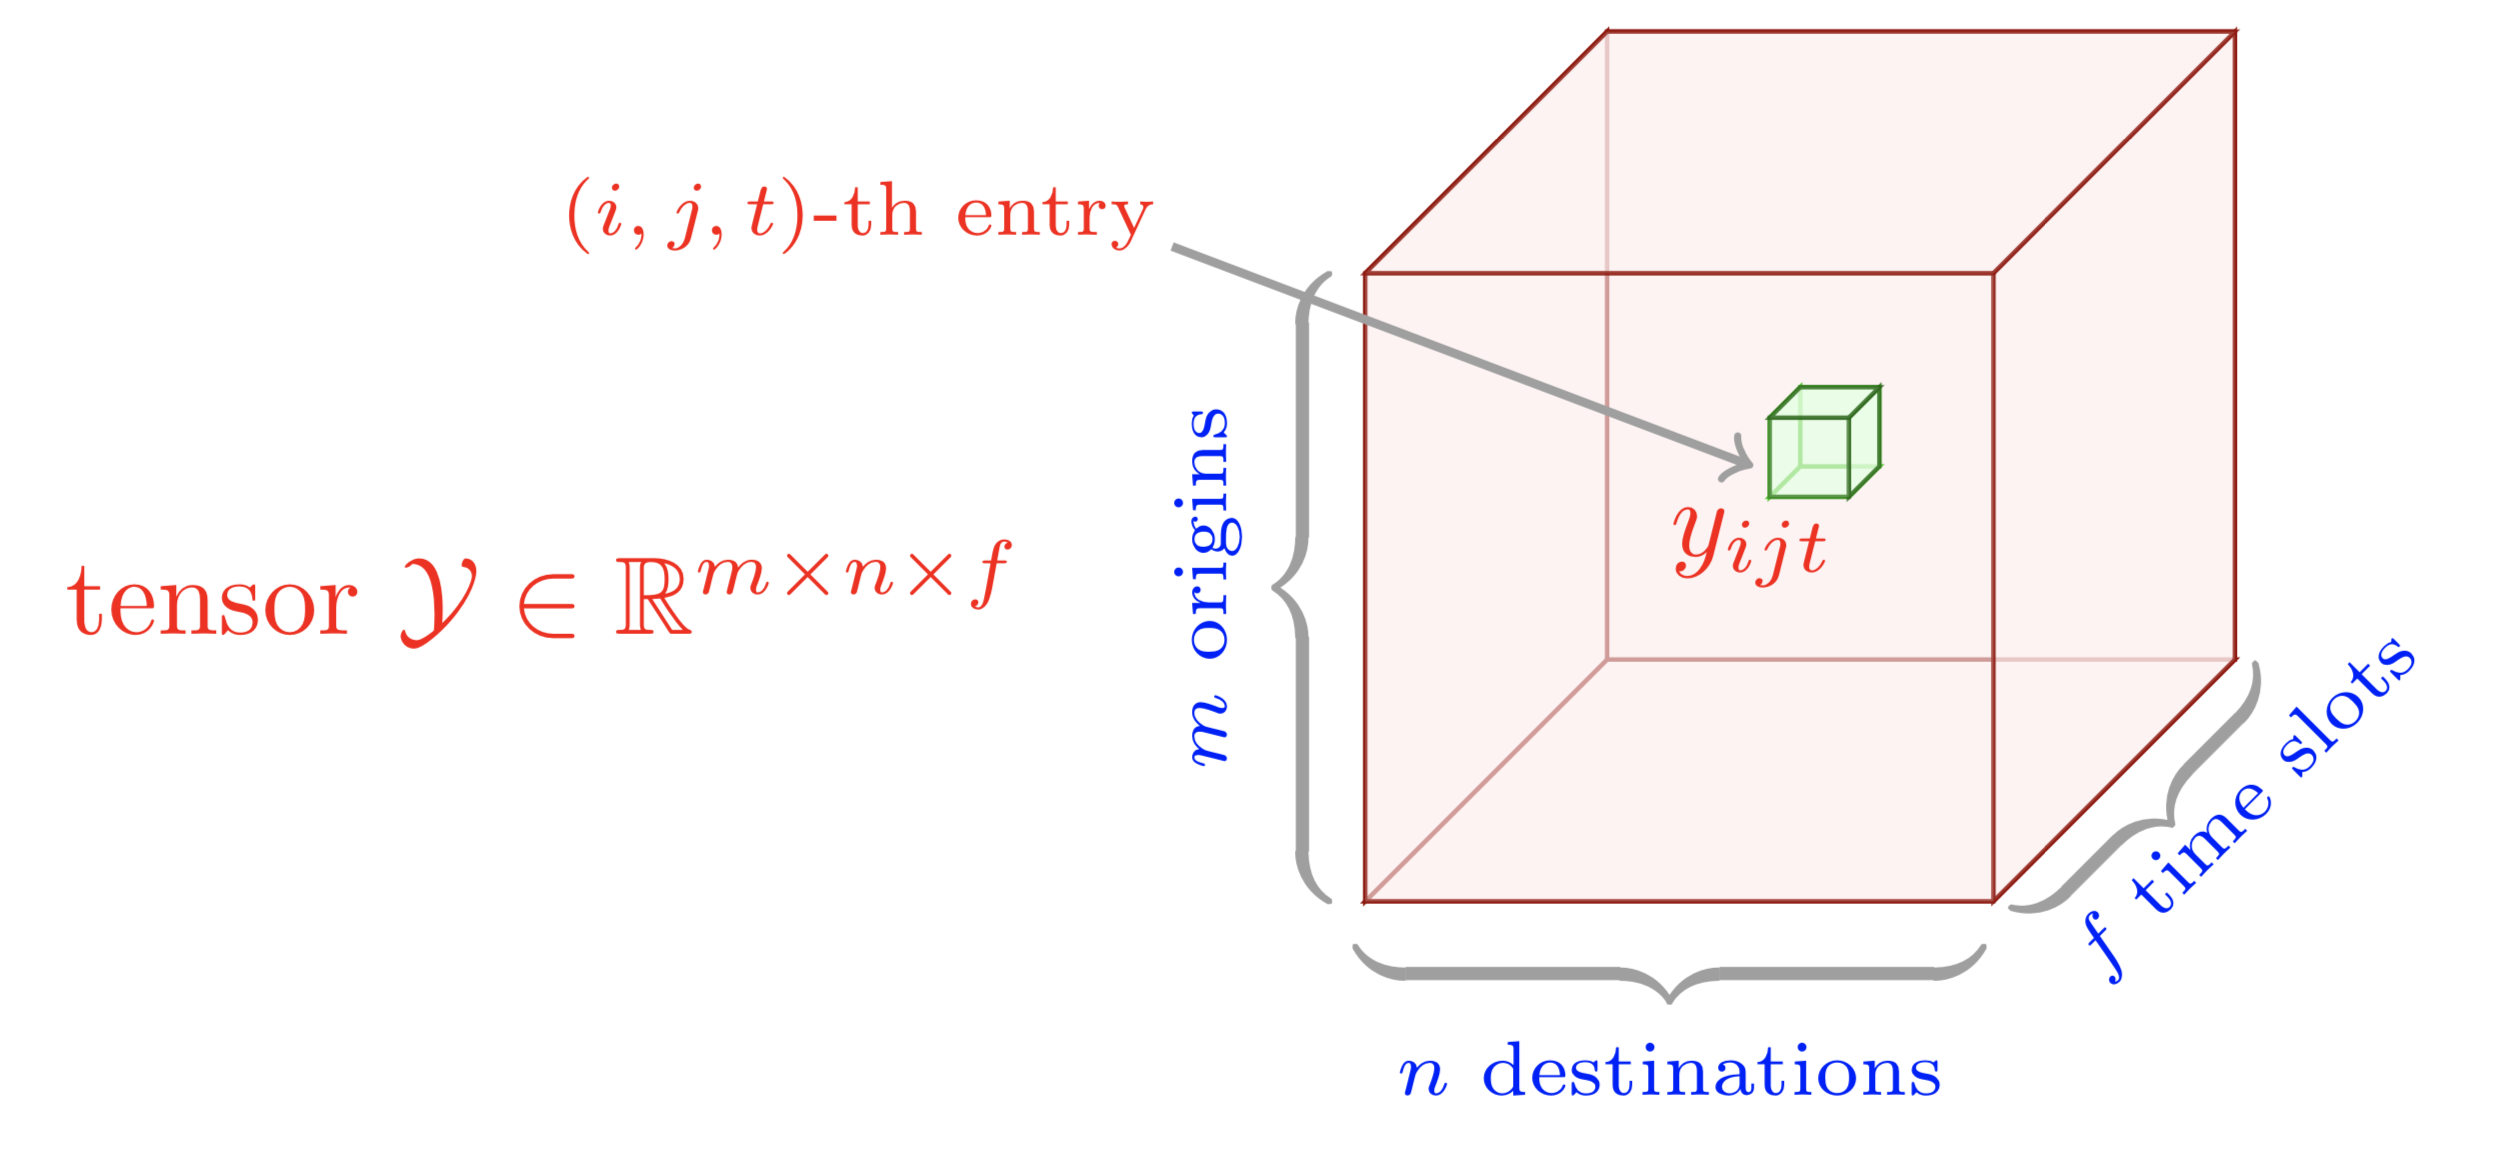
Figure 17: A graphical illustration for the (origin,destination,time slot) tensor.
- Open AuTF.tex in your overleaf project, then you will see the following picture:
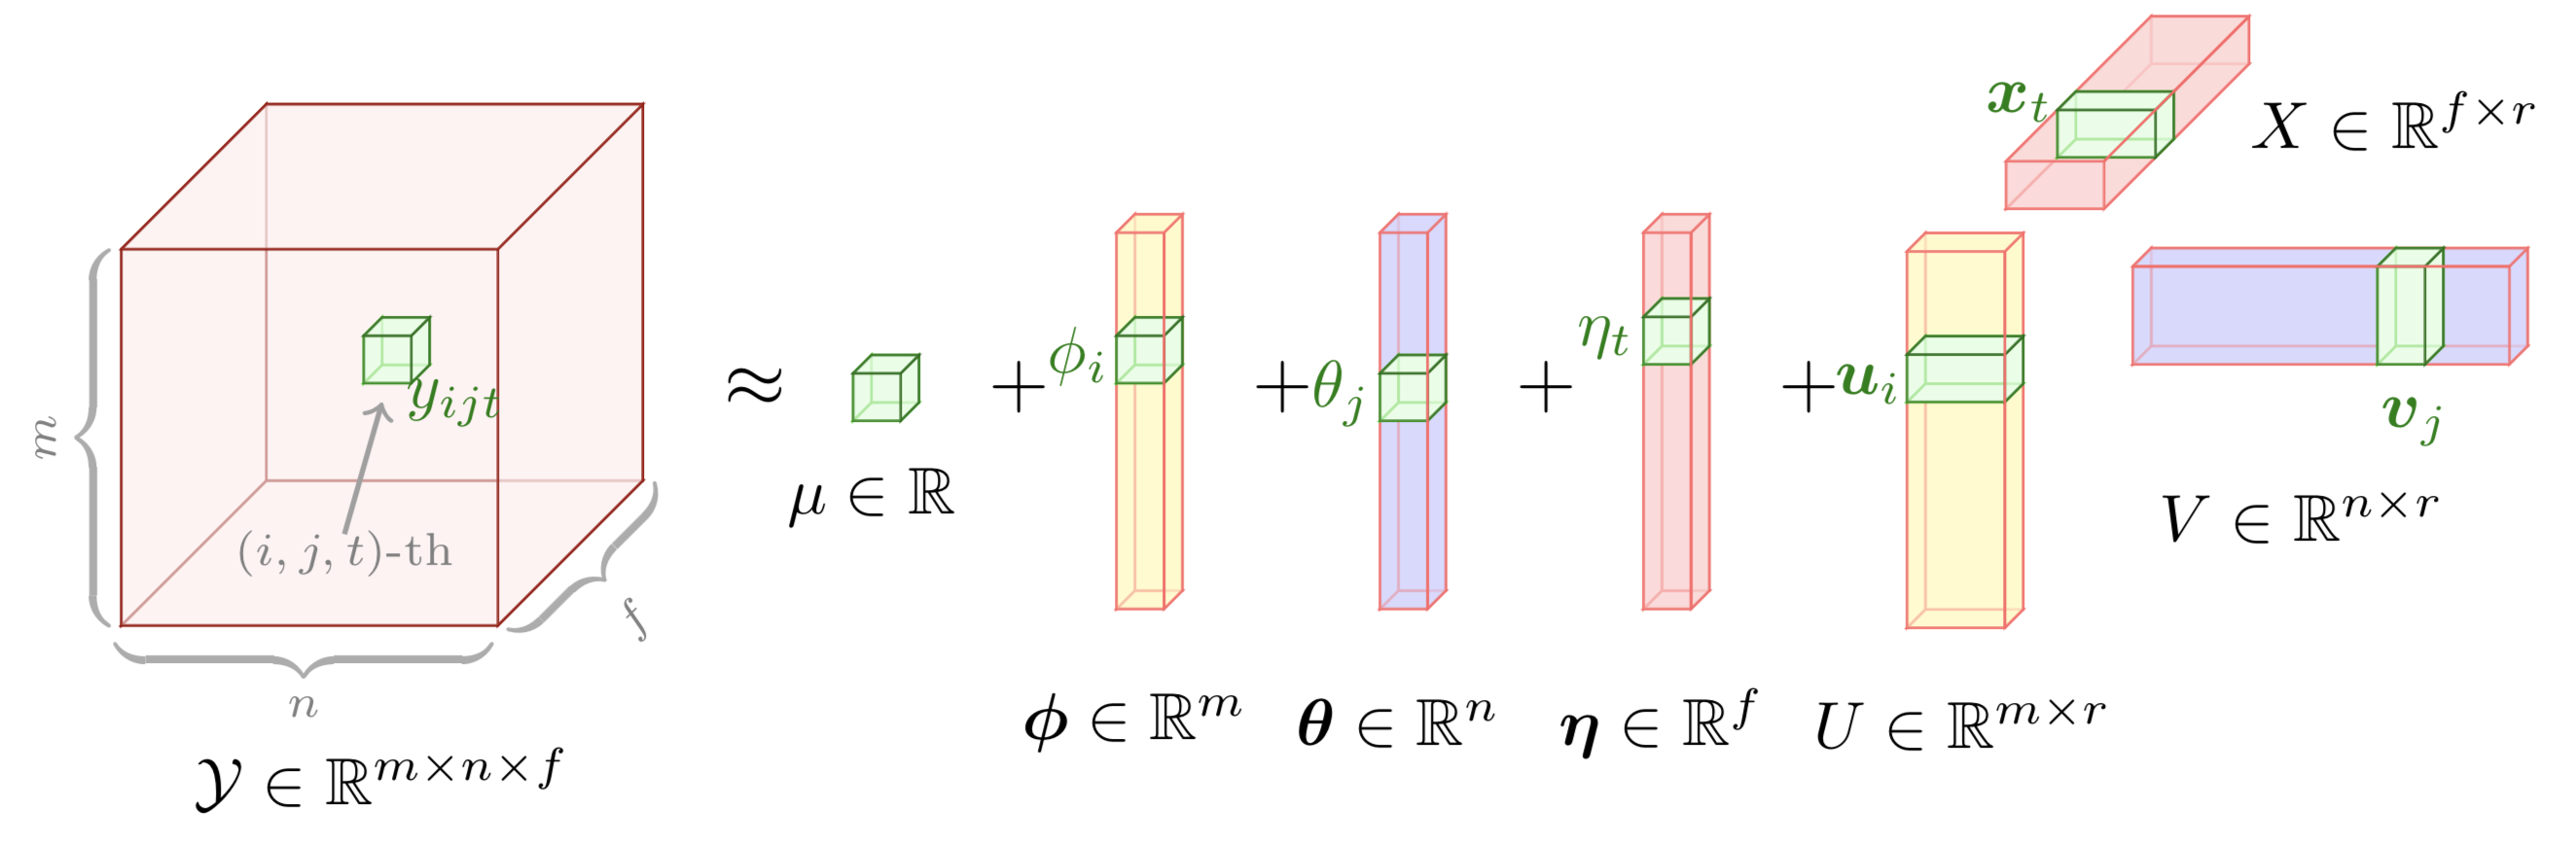
Figure 18: Augmented tensor factorization (AuTF) model.
- Open TVART.tex in your overleaf project, then you will see the following picture:
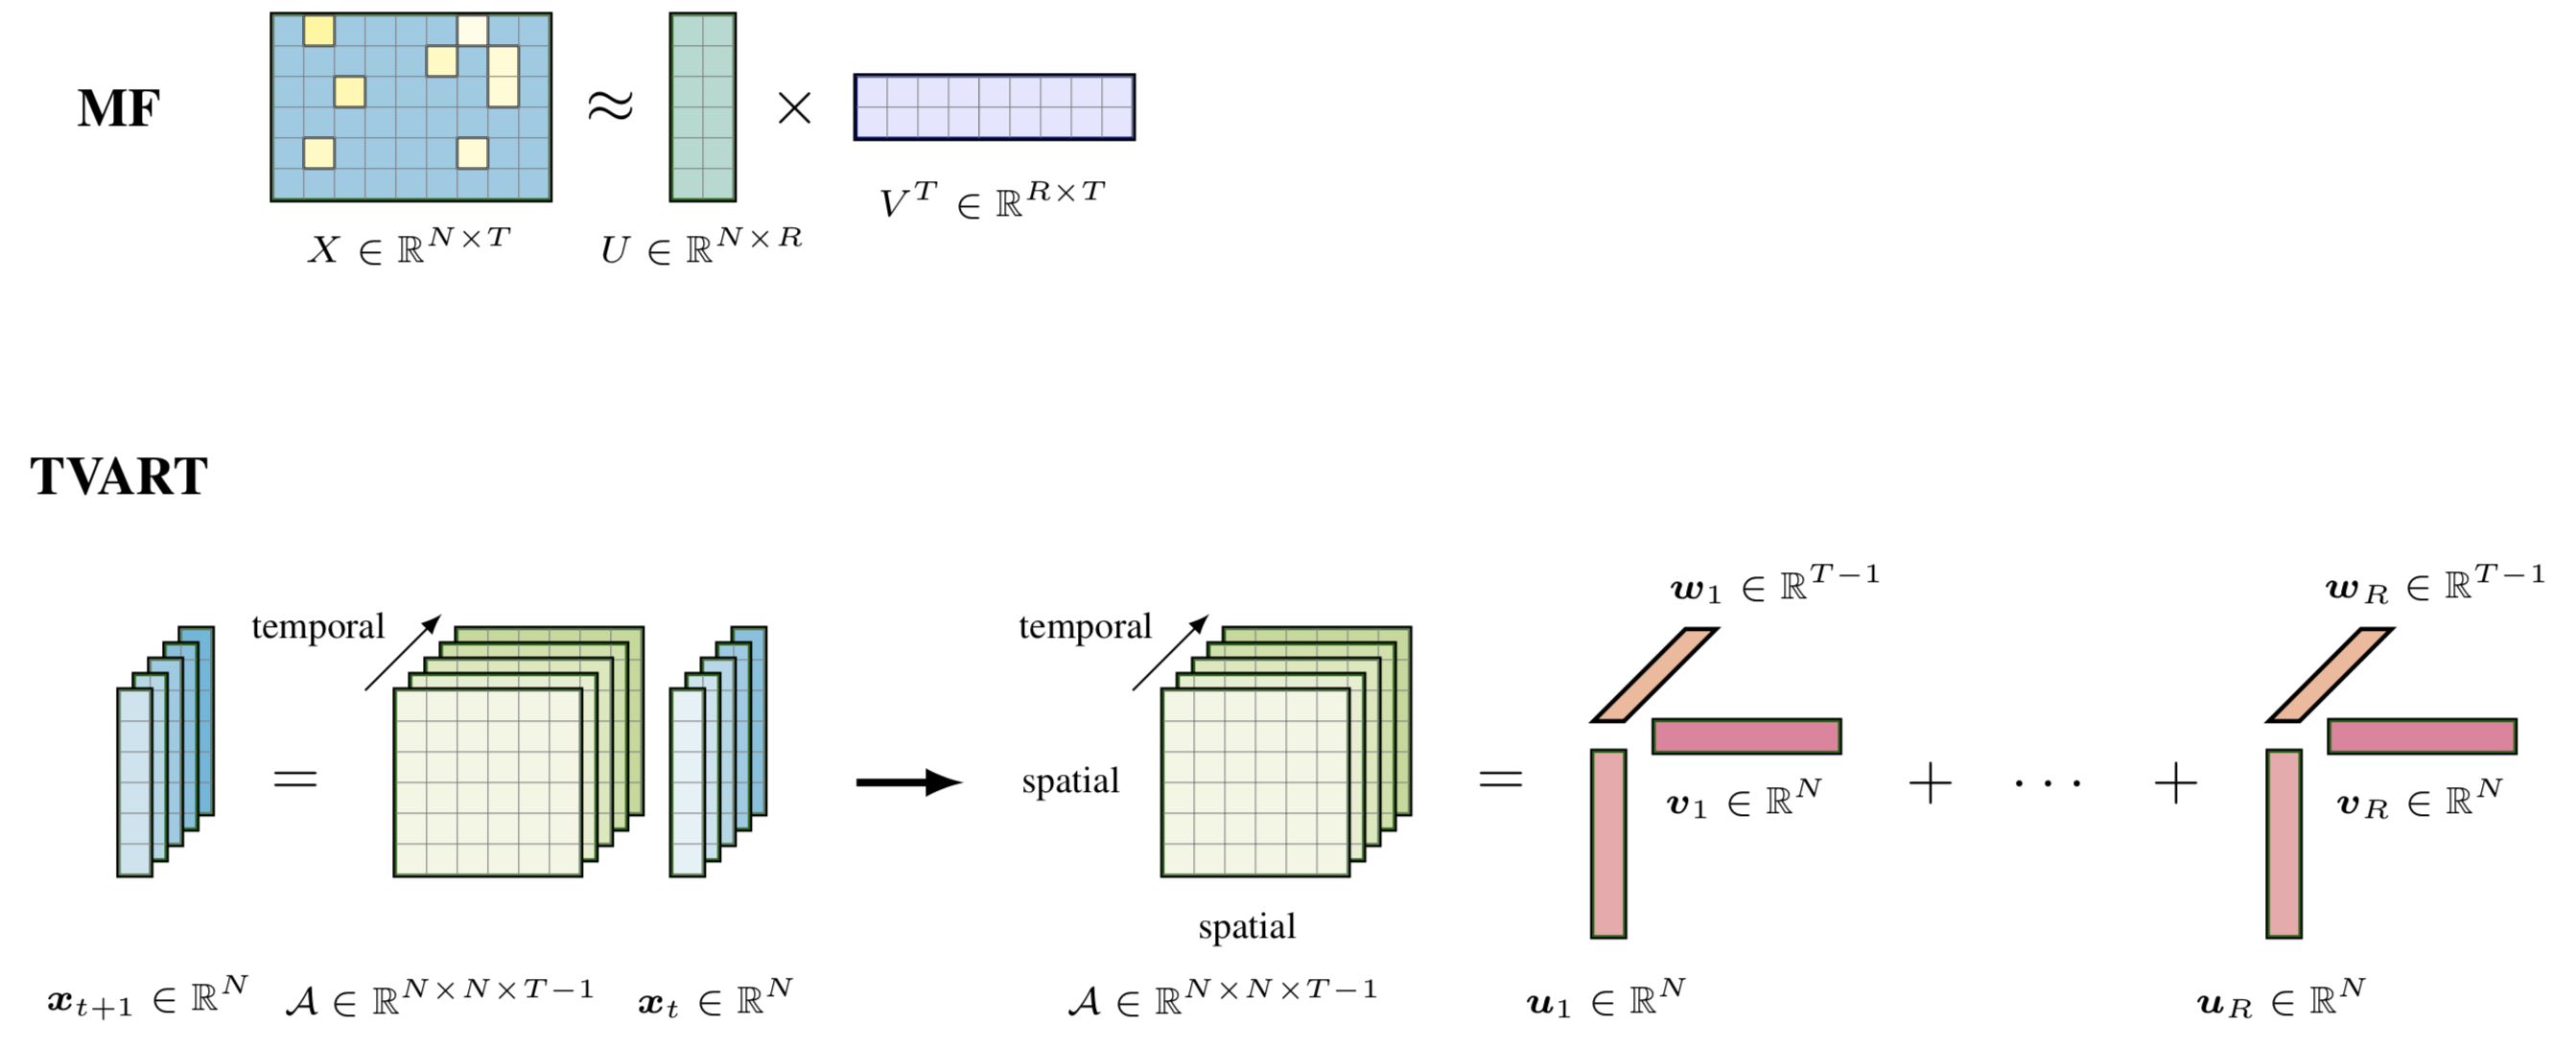
Figure 19: Tensor regression model.
- Open tensor_svt.tex in your overleaf project, then you will see the following picture:
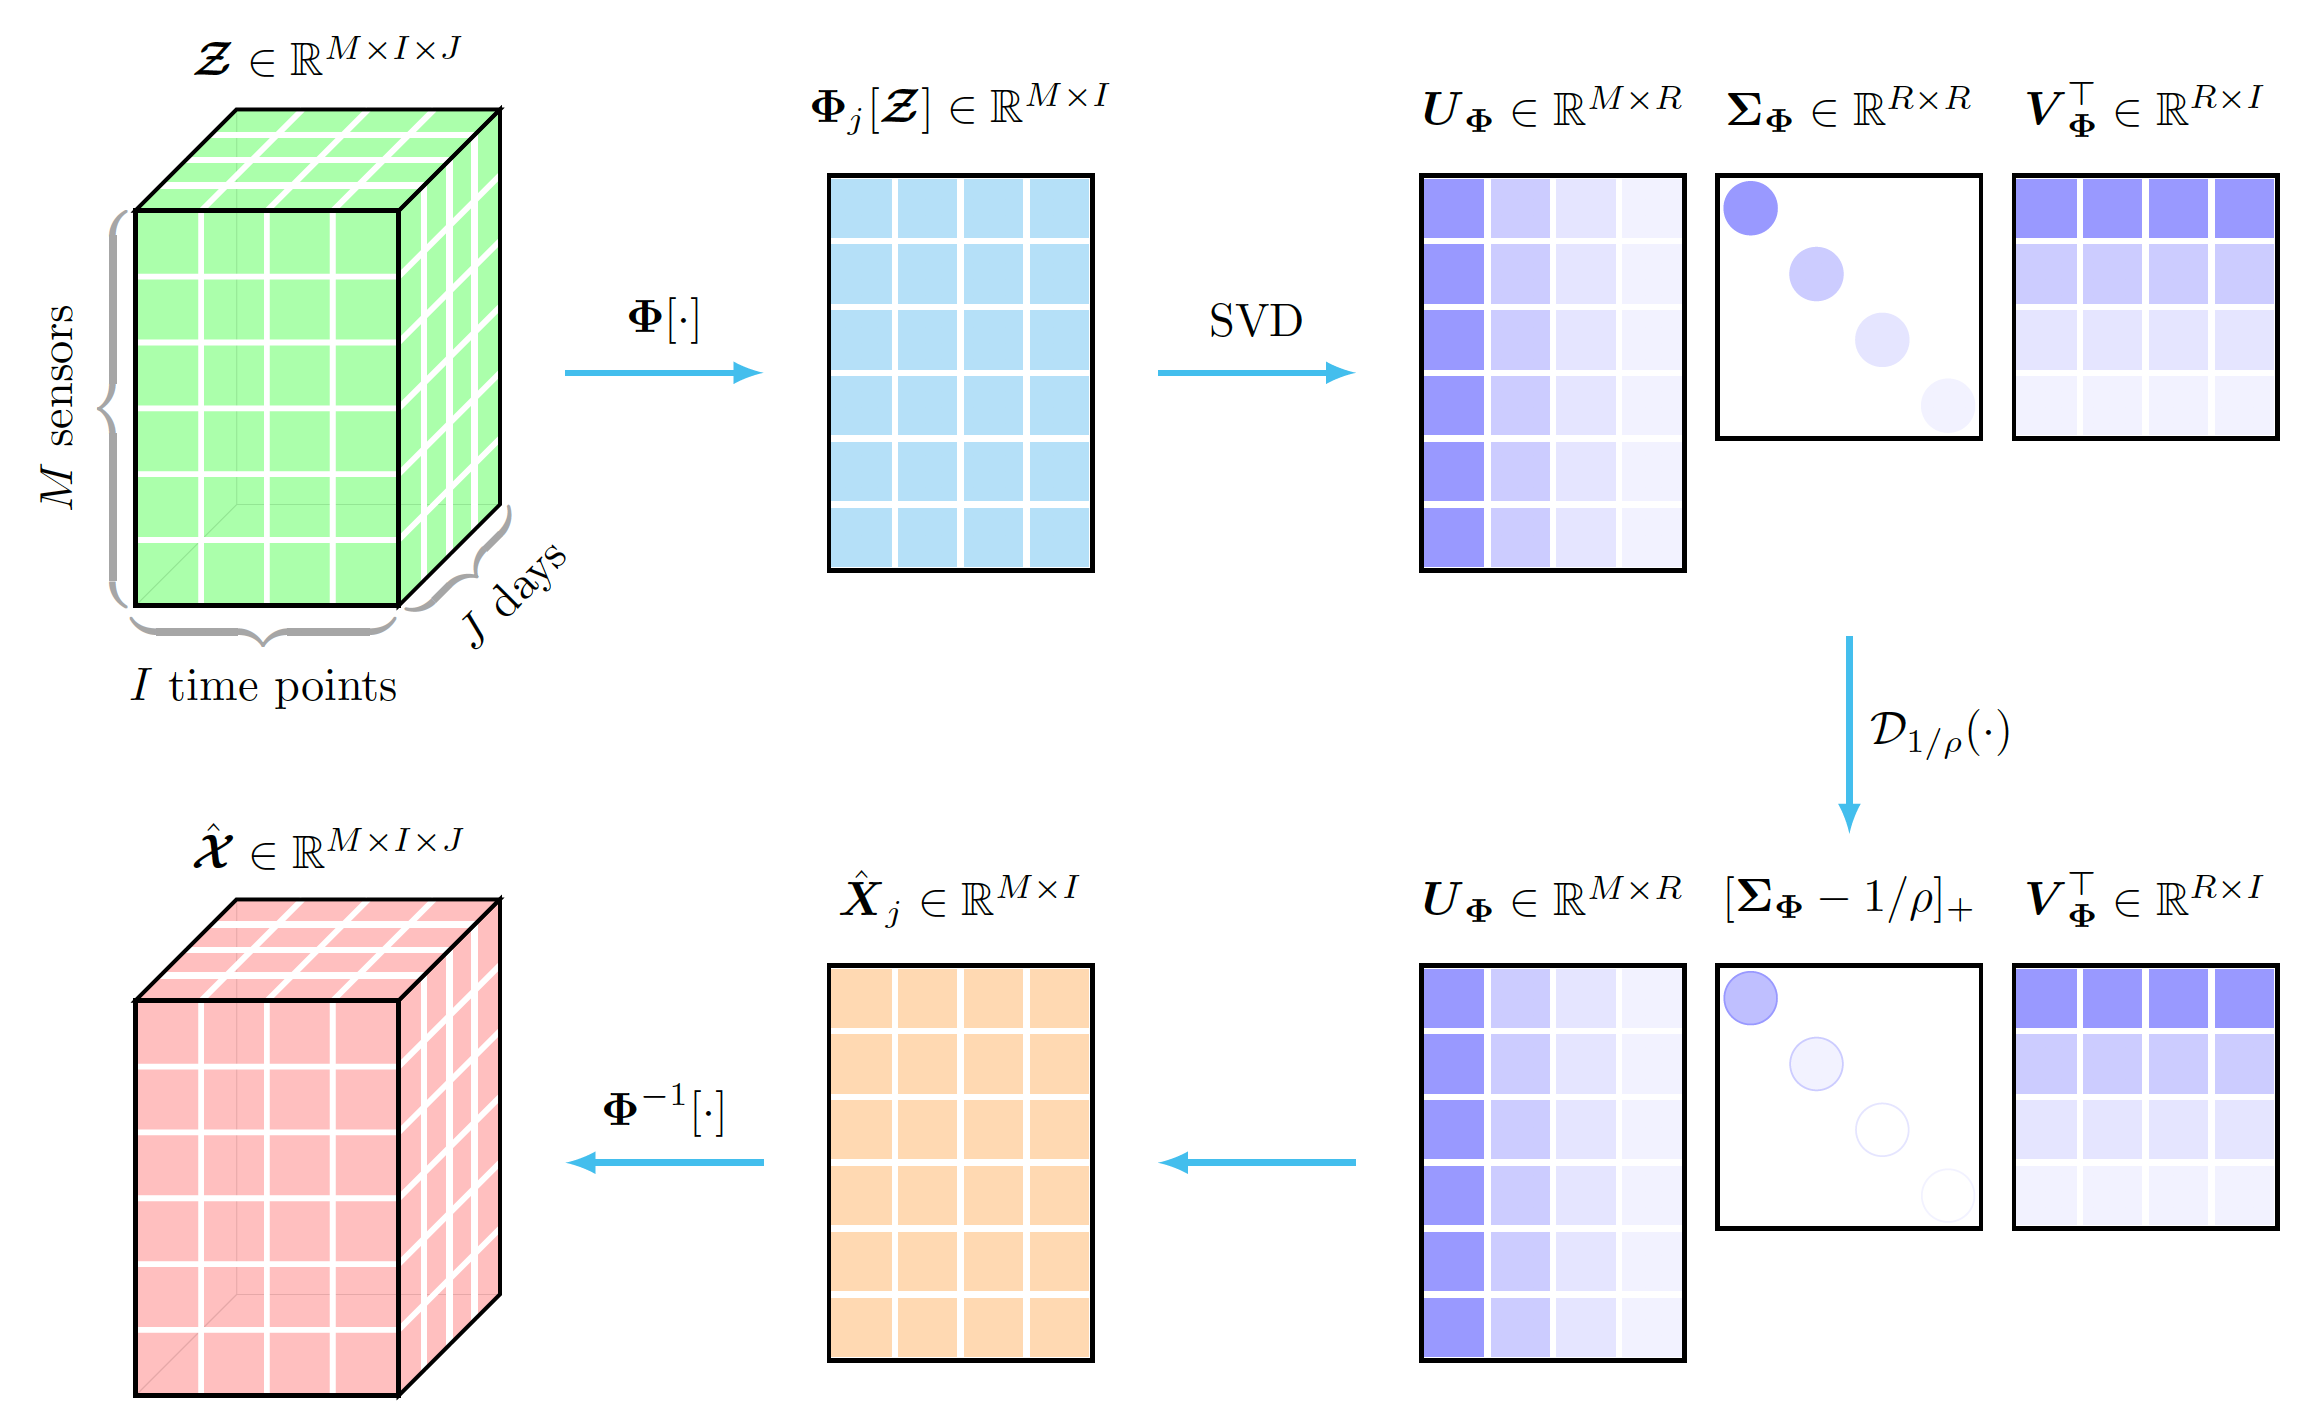
Figure 20: Singular value thresholding process of the tensor data with unitary transform.
- Open CP_factorization.tex in your overleaf project, then you will see the following picture:
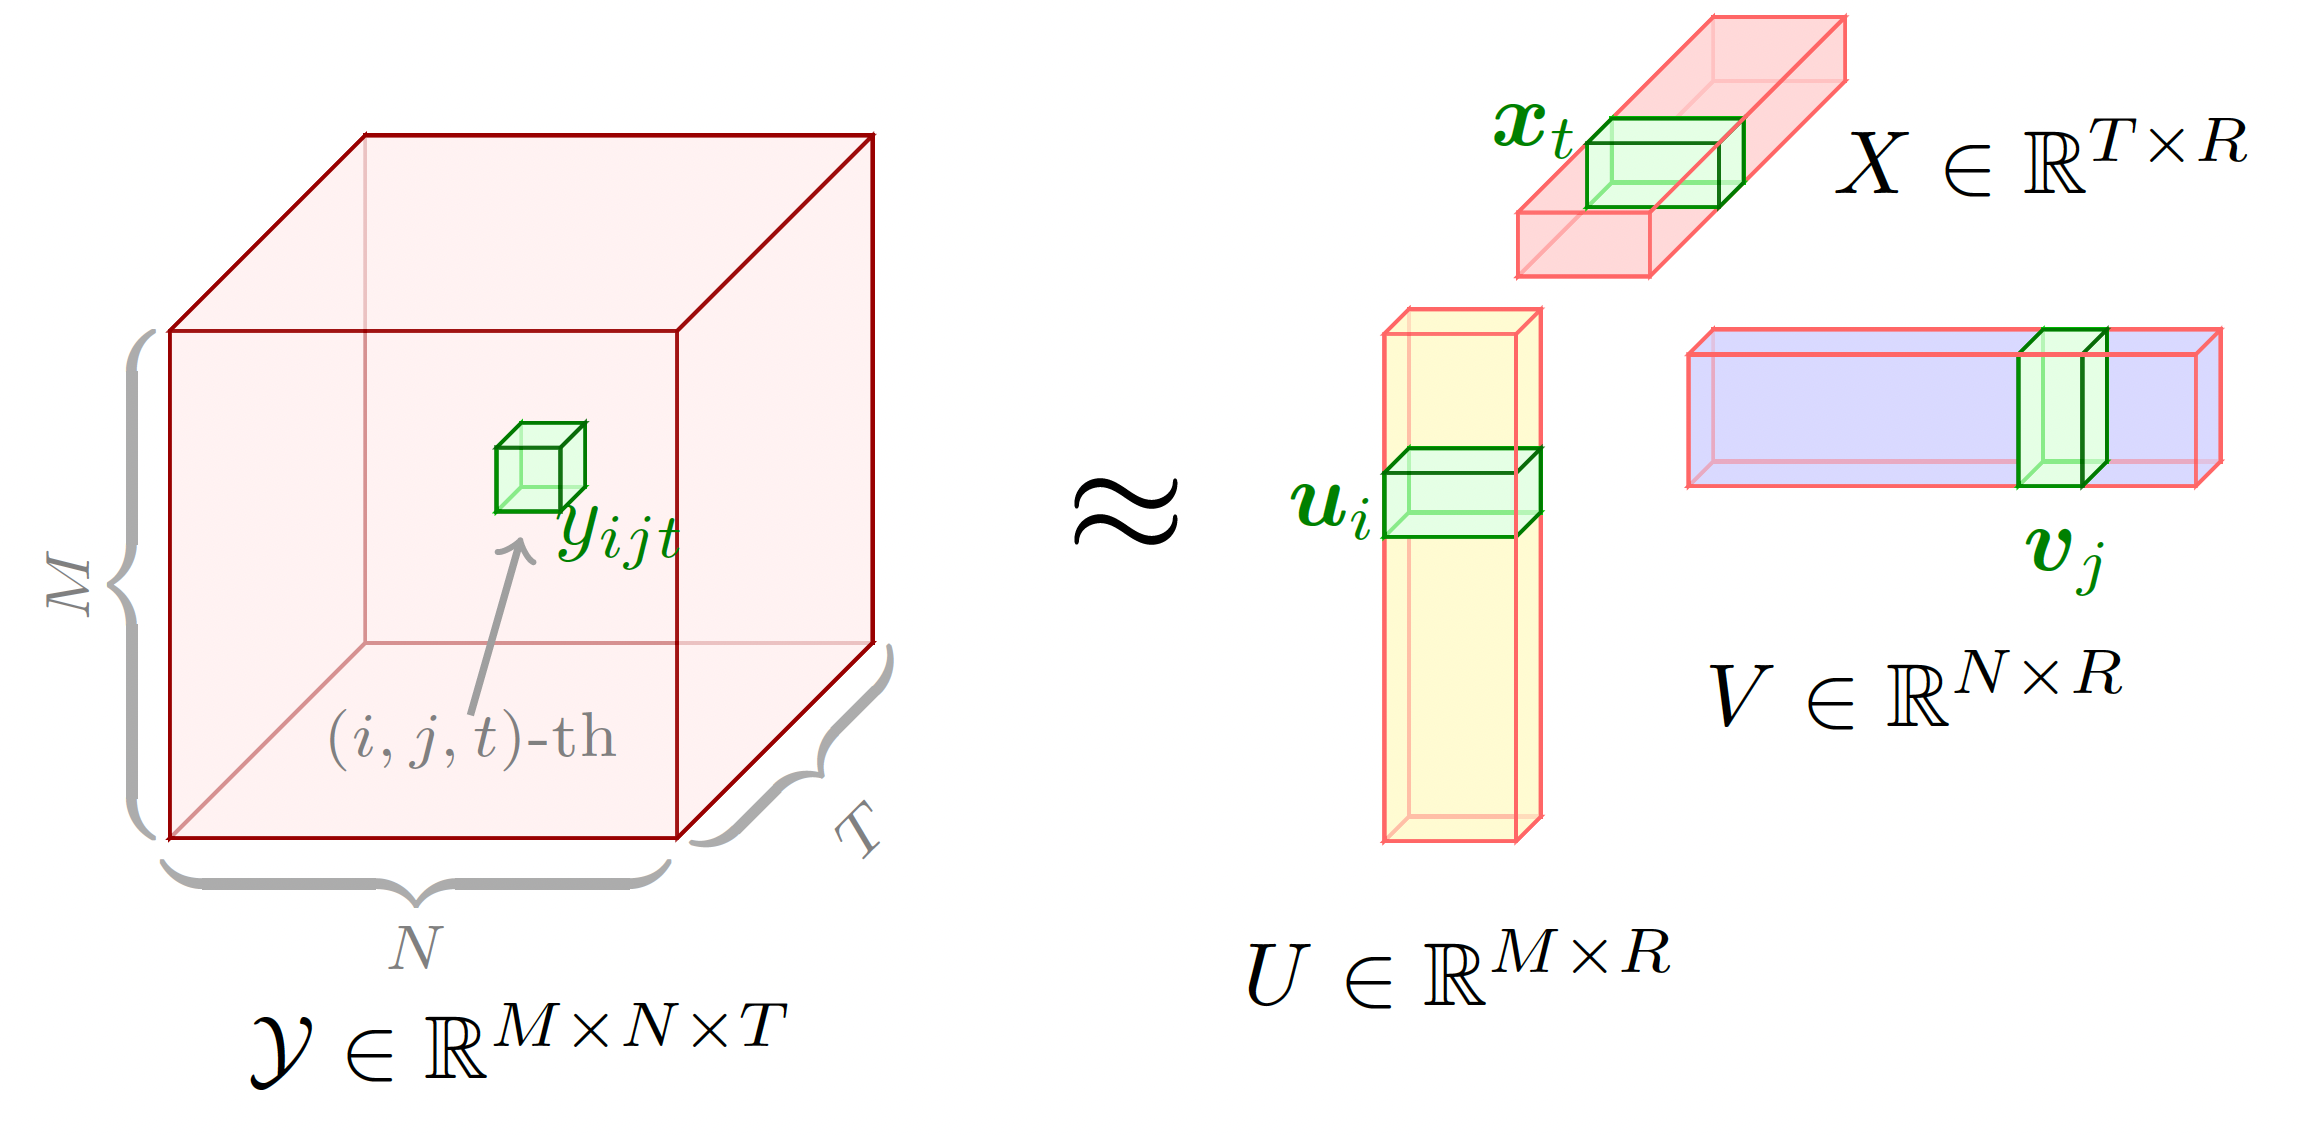
Figure 21: Illustration of CP factorization on third-order tensor.
- Open RMseries.tex in your overleaf project, then you will see the following picture:
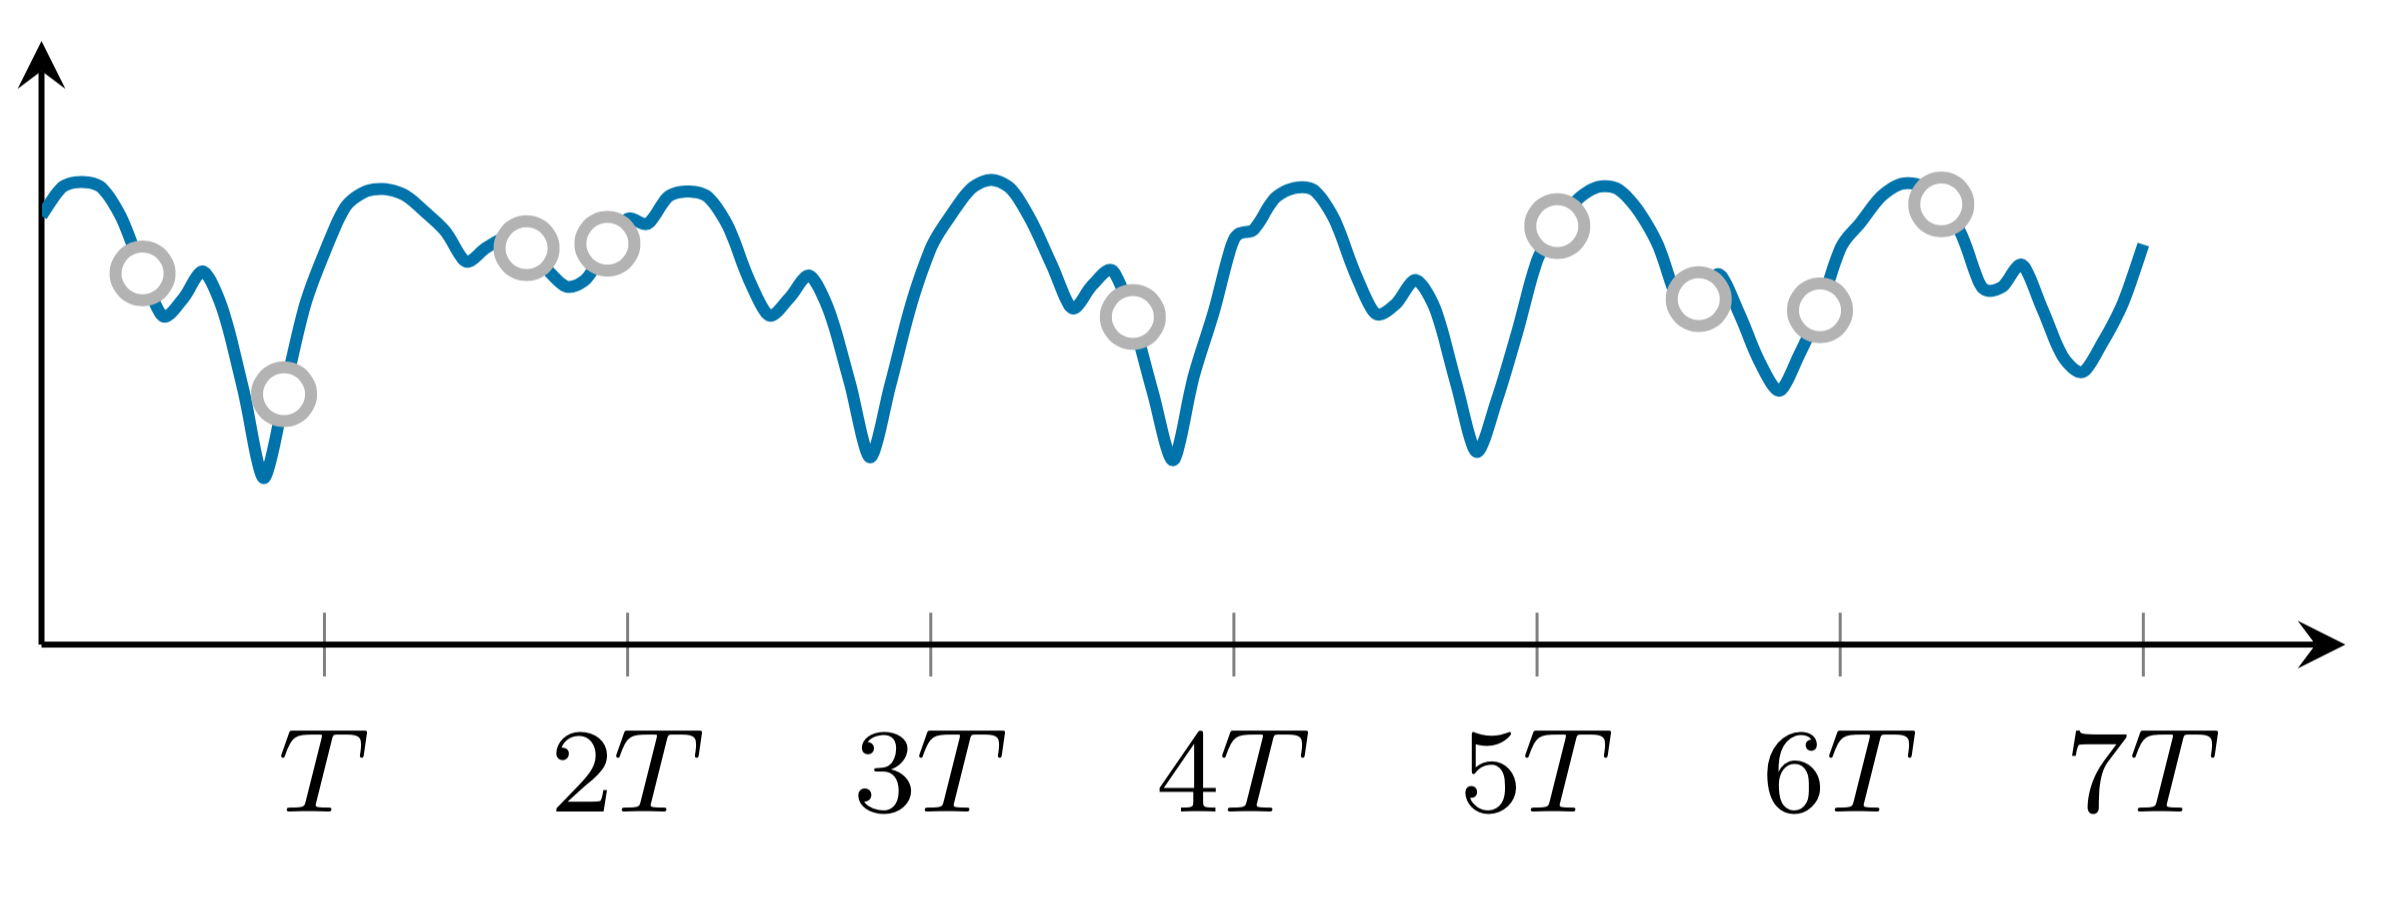
Figure 22: Random missing pattern.
- Open NMseries.tex in your overleaf project, then you will see the following picture:
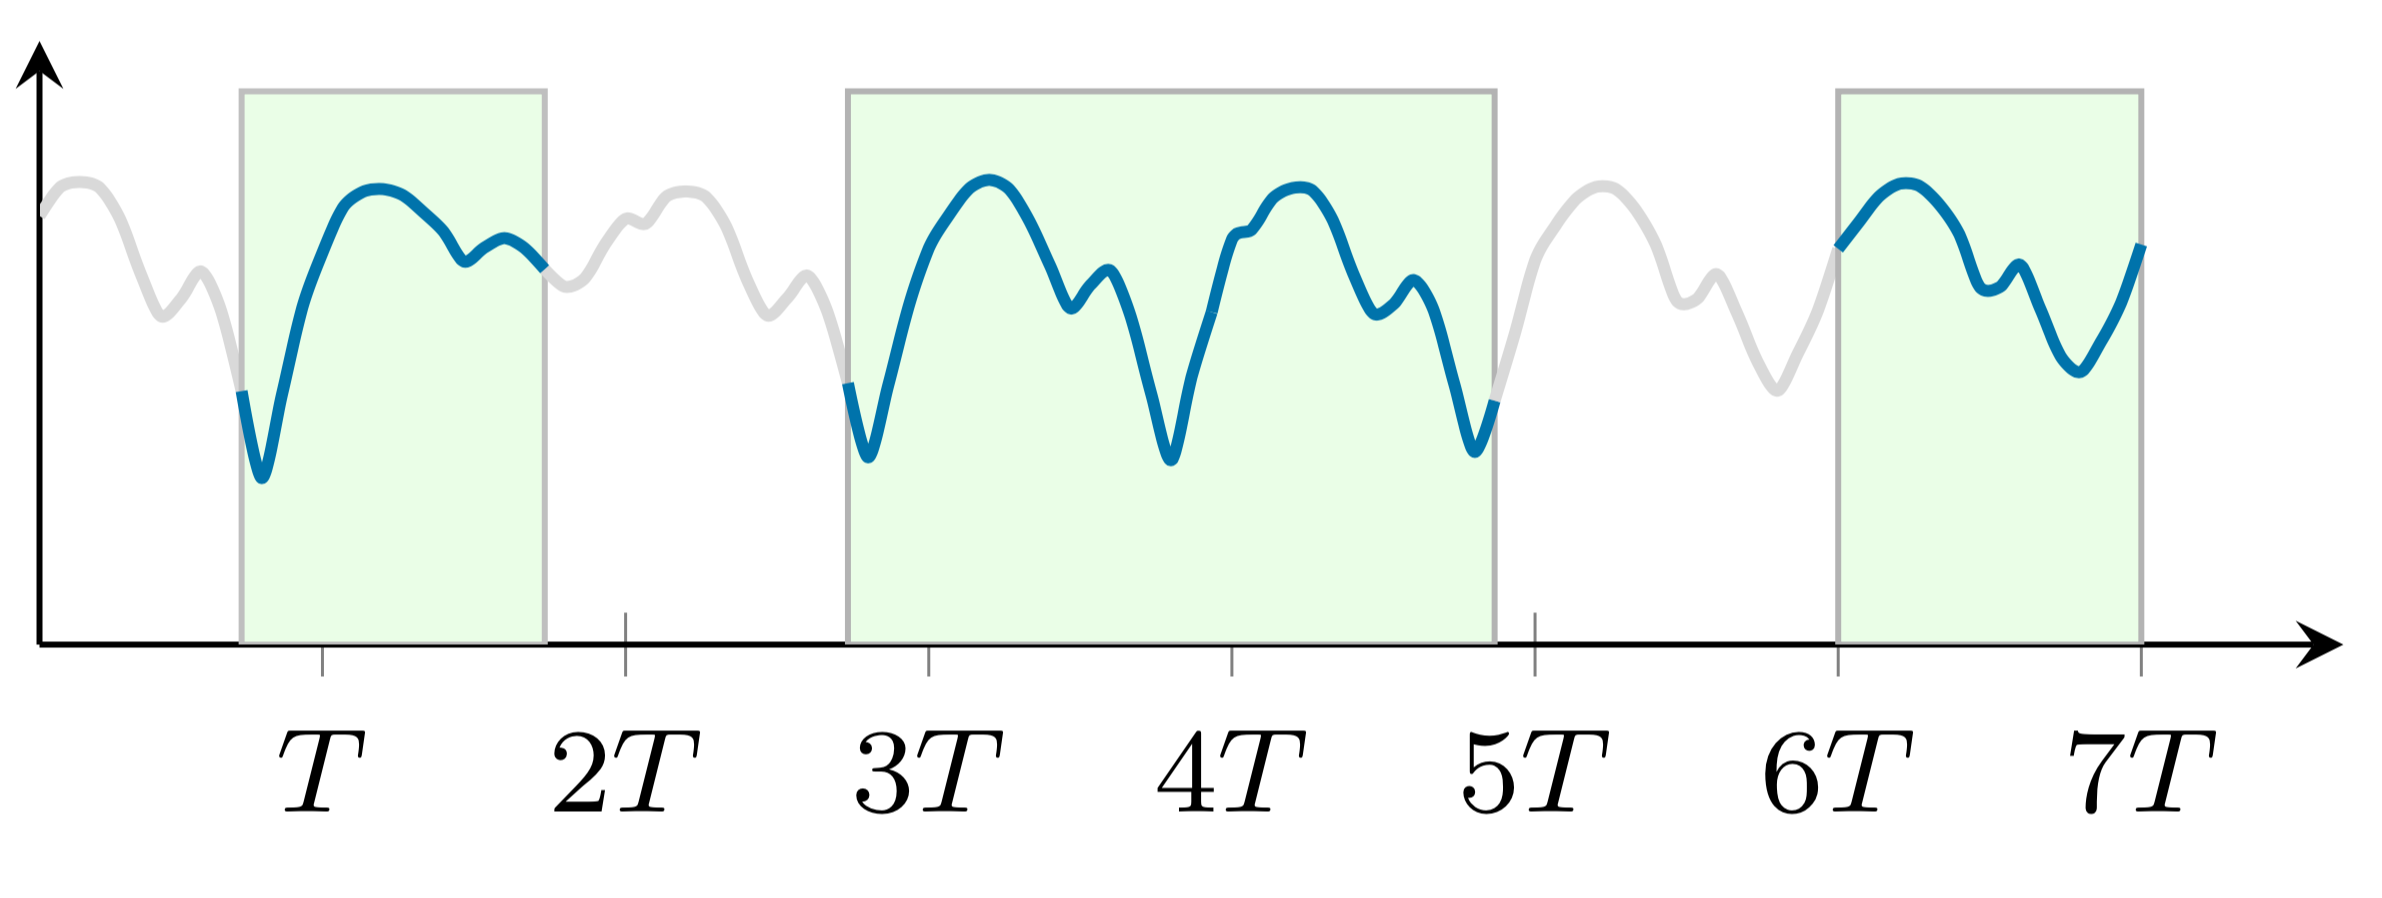
Figure 23: Non-random missing pattern.
- Open performance_bar.tex and upload
in your overleaf project, then you will see the following picture:
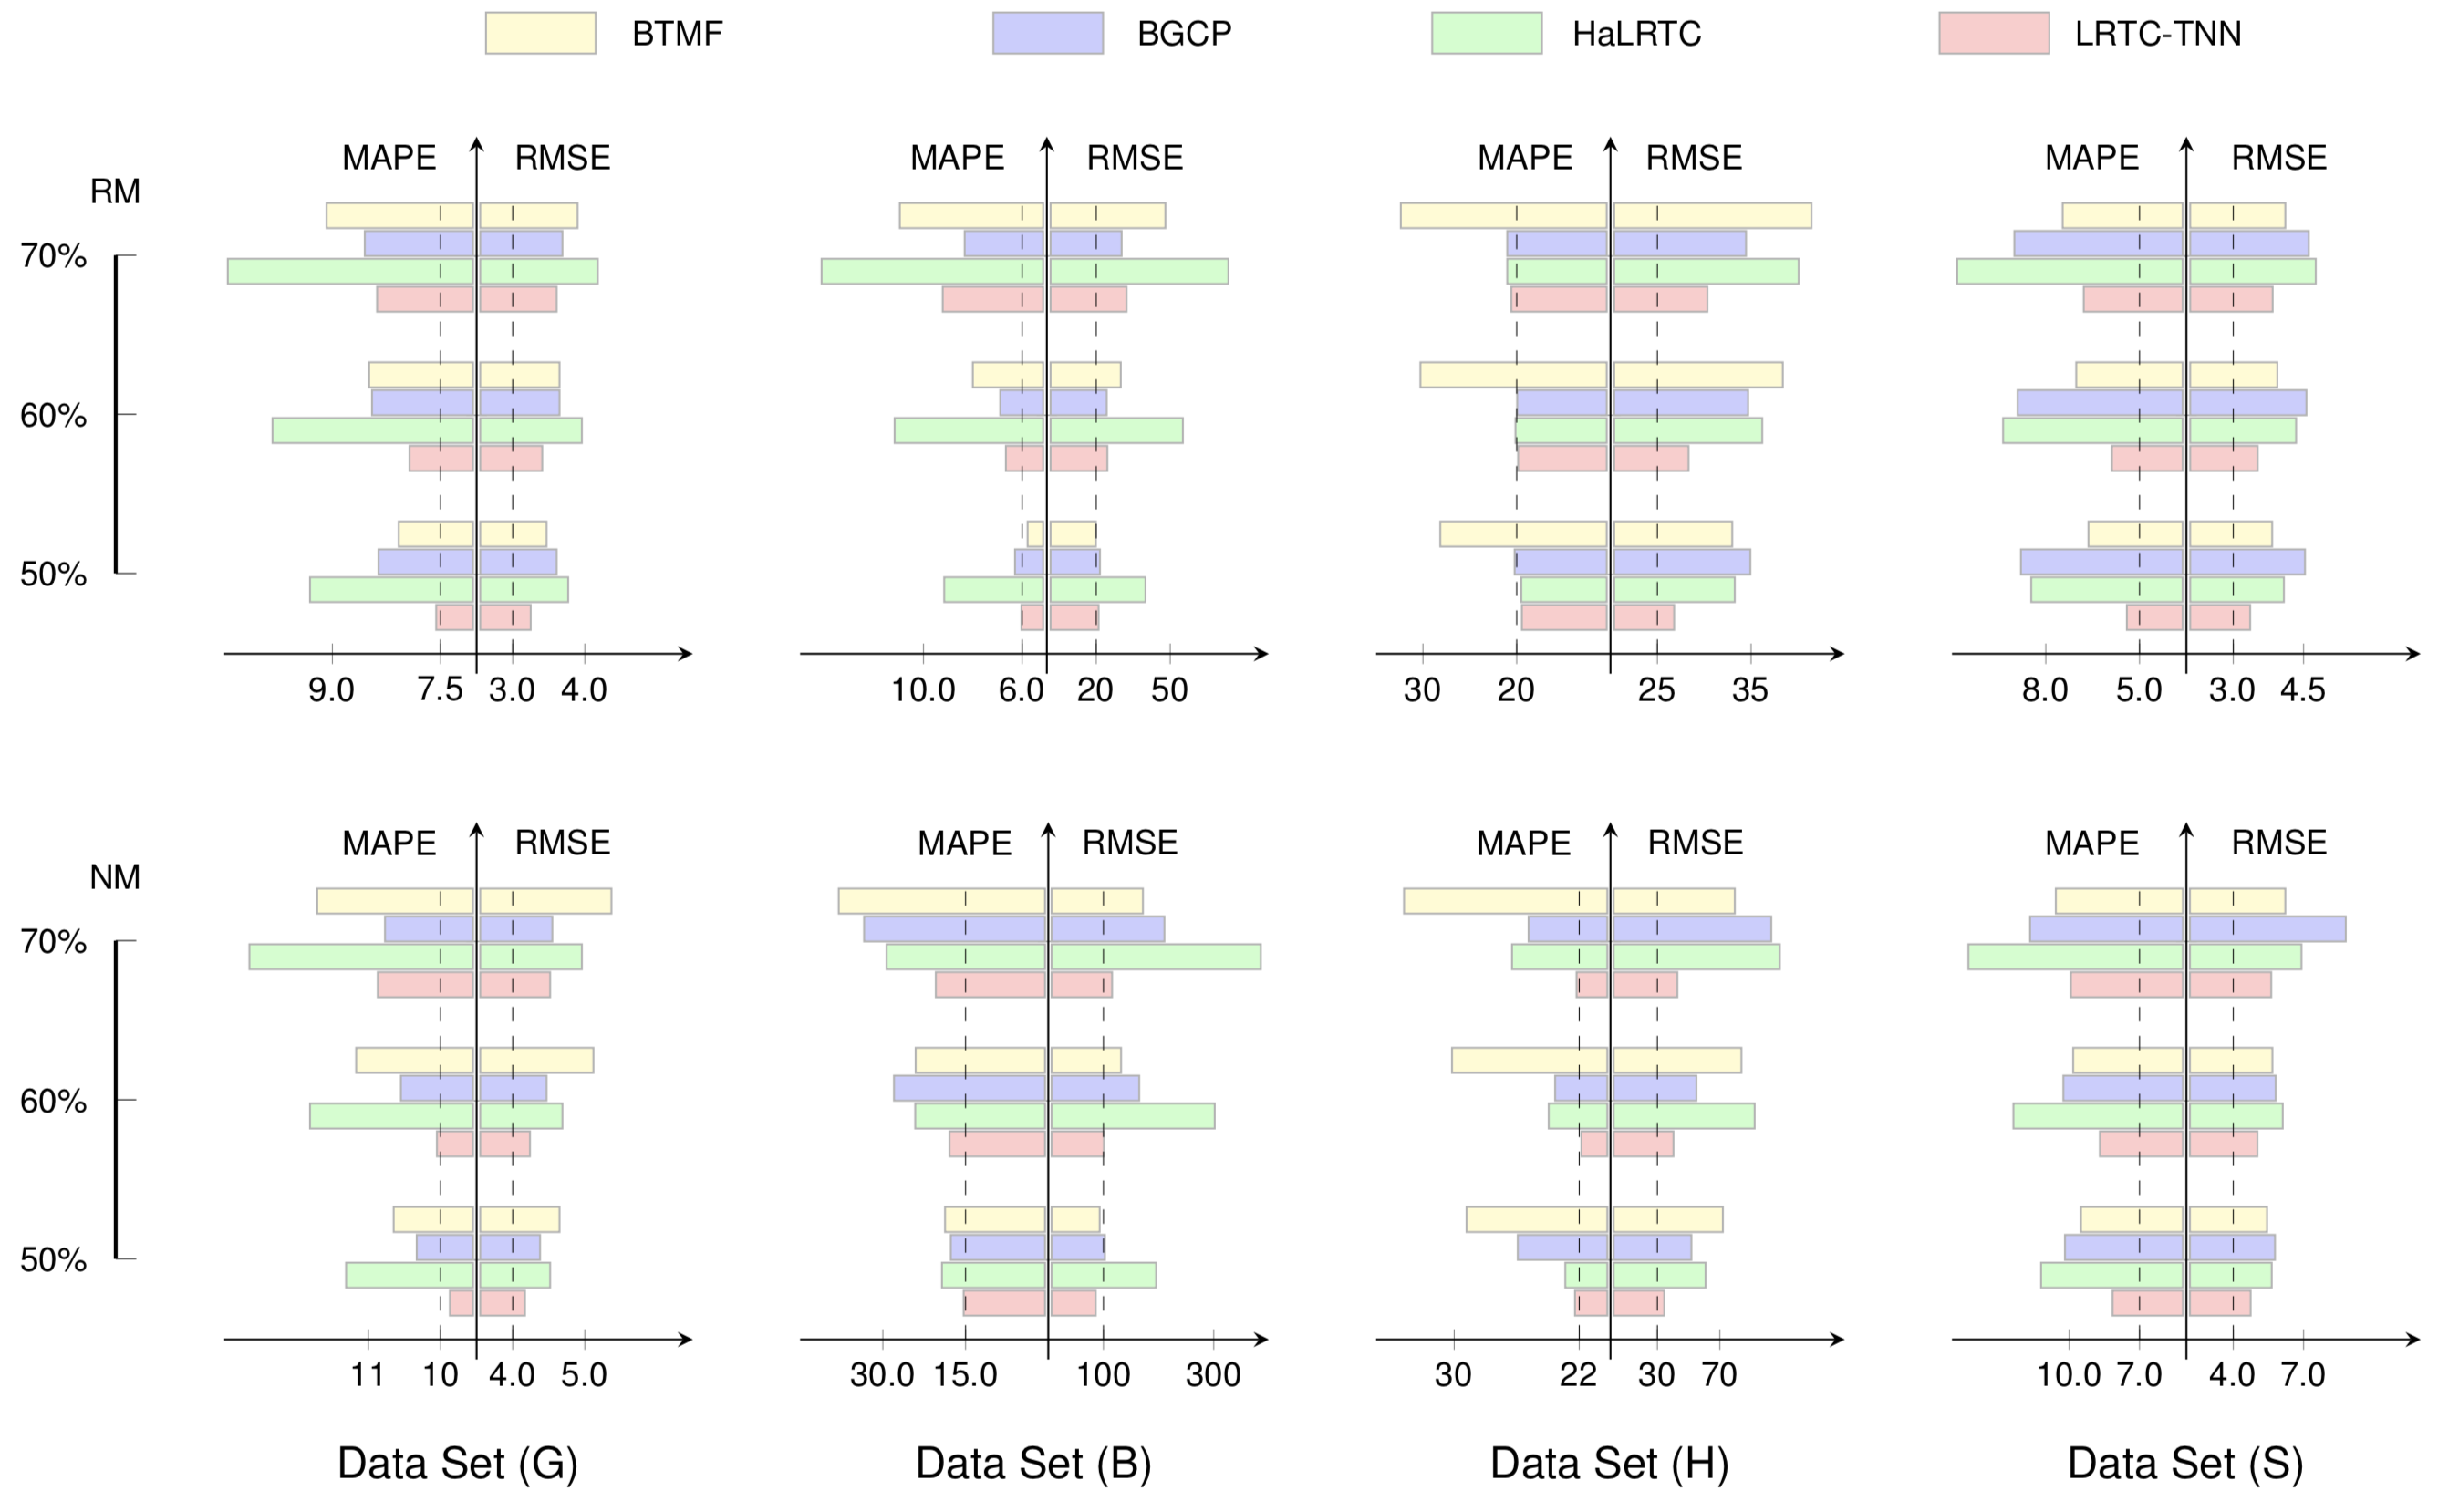
Figure 24: Imputation performance.
If you want to draw each sub-figure, please check out the following
.texfiles:
- Sub-figure at the 1st row and 1st column: RM_Gdata.tex
- Sub-figure at the 1st row and 2nd column: RM_Bdata.tex
- Sub-figure at the 1st row and 3rd column: RM_Hdata.tex
- Sub-figure at the 1st row and 4th column: RM_Sdata.tex
- Sub-figure at the 2nd row and 1st column: NM_Gdata.tex
- Sub-figure at the 2nd row and 2nd column: NM_Bdata.tex
- Sub-figure at the 2nd row and 3rd column: NM_Hdata.tex
- Sub-figure at the 2nd row and 4th column: NM_Sdata.tex
- Open
- Upload
in your overleaf project, then, you will see the following picture:

Figure 25: transdim logo.
Coming soon...
- Documentation (English version)
- 技术文档 (中文版)


Most of these examples are from our papers:
-
Xinyu Chen, Mengying Lei, Nicolas Saunier, Lijun Sun (2021). Low-rank autoregressive tensor completion for spatiotemporal traffic data imputation. IEEE Transactions on Intelligent Transportation Systems. [Preprint] [DOI] [Data & Python code] (Also accepted in part to MiLeTS Workshop of KDD 2021, see workshop paper)
-
Xinyu Chen, Yixian Chen, Nicolas Saunier, Lijun Sun (2021). Scalable low-rank tensor learning for spatiotemporal traffic data imputation. Transportation Research Part C: Emerging Technologies, 129: 103226. [Preprint] [DOI] [Data] [Python code]
-
Xinyu Chen, Lijun Sun (2021). Bayesian temporal factorization for multidimensional time series prediction. IEEE Transactions on Pattern Analysis and Machine Intelligence. (Early access) [Preprint] [DOI] [Slides] [Data & Python code]
-
Xinyu Chen, Lijun Sun (2020). Low-rank autoregressive tensor completion for multivariate time series forecasting. arXiv: 2006.10436. [Preprint] [Data & Python code]
-
Xinyu Chen, Jinming Yang, Lijun Sun (2020). A nonconvex low-rank tensor completion model for spatiotemporal traffic data imputation. Transportation Research Part C: Emerging Technologies, 117: 102673. [Preprint] [DOI] [Data & Python code]
-
Xinyu Chen, Zhaocheng He, Yixian Chen, Yuhuan Lu, Jiawei Wang (2019). Missing traffic data imputation and pattern discovery with a Bayesian augmented tensor factorization model. Transportation Research Part C: Emerging Technologies, 104: 66-77. [DOI] [Slides] [Data] [Matlab code] [Python code]
-
Xinyu Chen, Zhaocheng He, Lijun Sun (2019). A Bayesian tensor decomposition approach for spatiotemporal traffic data imputation. Transportation Research Part C: Emerging Technologies, 98: 73-84. [Preprint] [DOI] [Data] [Matlab code] [Python code]
Please cite our papers if you find these codes help your research.