Maps are everywhere 🌈 We'd be lost without the maps on our phone, and apps from Uber to Snapchat wouldn't work without the capabilities of these APIs. Map APIs give us data we couldn't get otherwise like routing and time estimation and gives us the tools to produce cool data visualizations and construct augmented reality. The best part is, it's pretty easy for us to take advantage of all their cool features too 😺
For this demo, we're going to be writing a react app that utilizes the Google Maps API. First, we're going to learn how to load a map into a react project. Then, we'll center and zoom in on Dartmouth. Next, we're going to drop markers on our map, with personalized info windows. Lastly, we're going to create a simple shape data visualization based on some data points!
Clone the workshop repository and cd workshop-ws-04-23-maps. Then run yarn install (this may take a second). We need to install all the dependencies from the package.json file.
🚀 We're using a different "starter-pack." This one is called create react app and it's used by front end developers to quickly create a complete react development environment. Though our starter pack is great, this one has a few more things we're going to need.
Our Yarn install includes something called google maps react. This is a JavaScript library that uses the Google Maps API and it makes it compatible with react projects.
Since we're using the Google Maps JavaScript API, we need to fetch an API key, just like we did for the Youtube API in Short Assignment 4. To do this you should head to http://console.developers.google.com
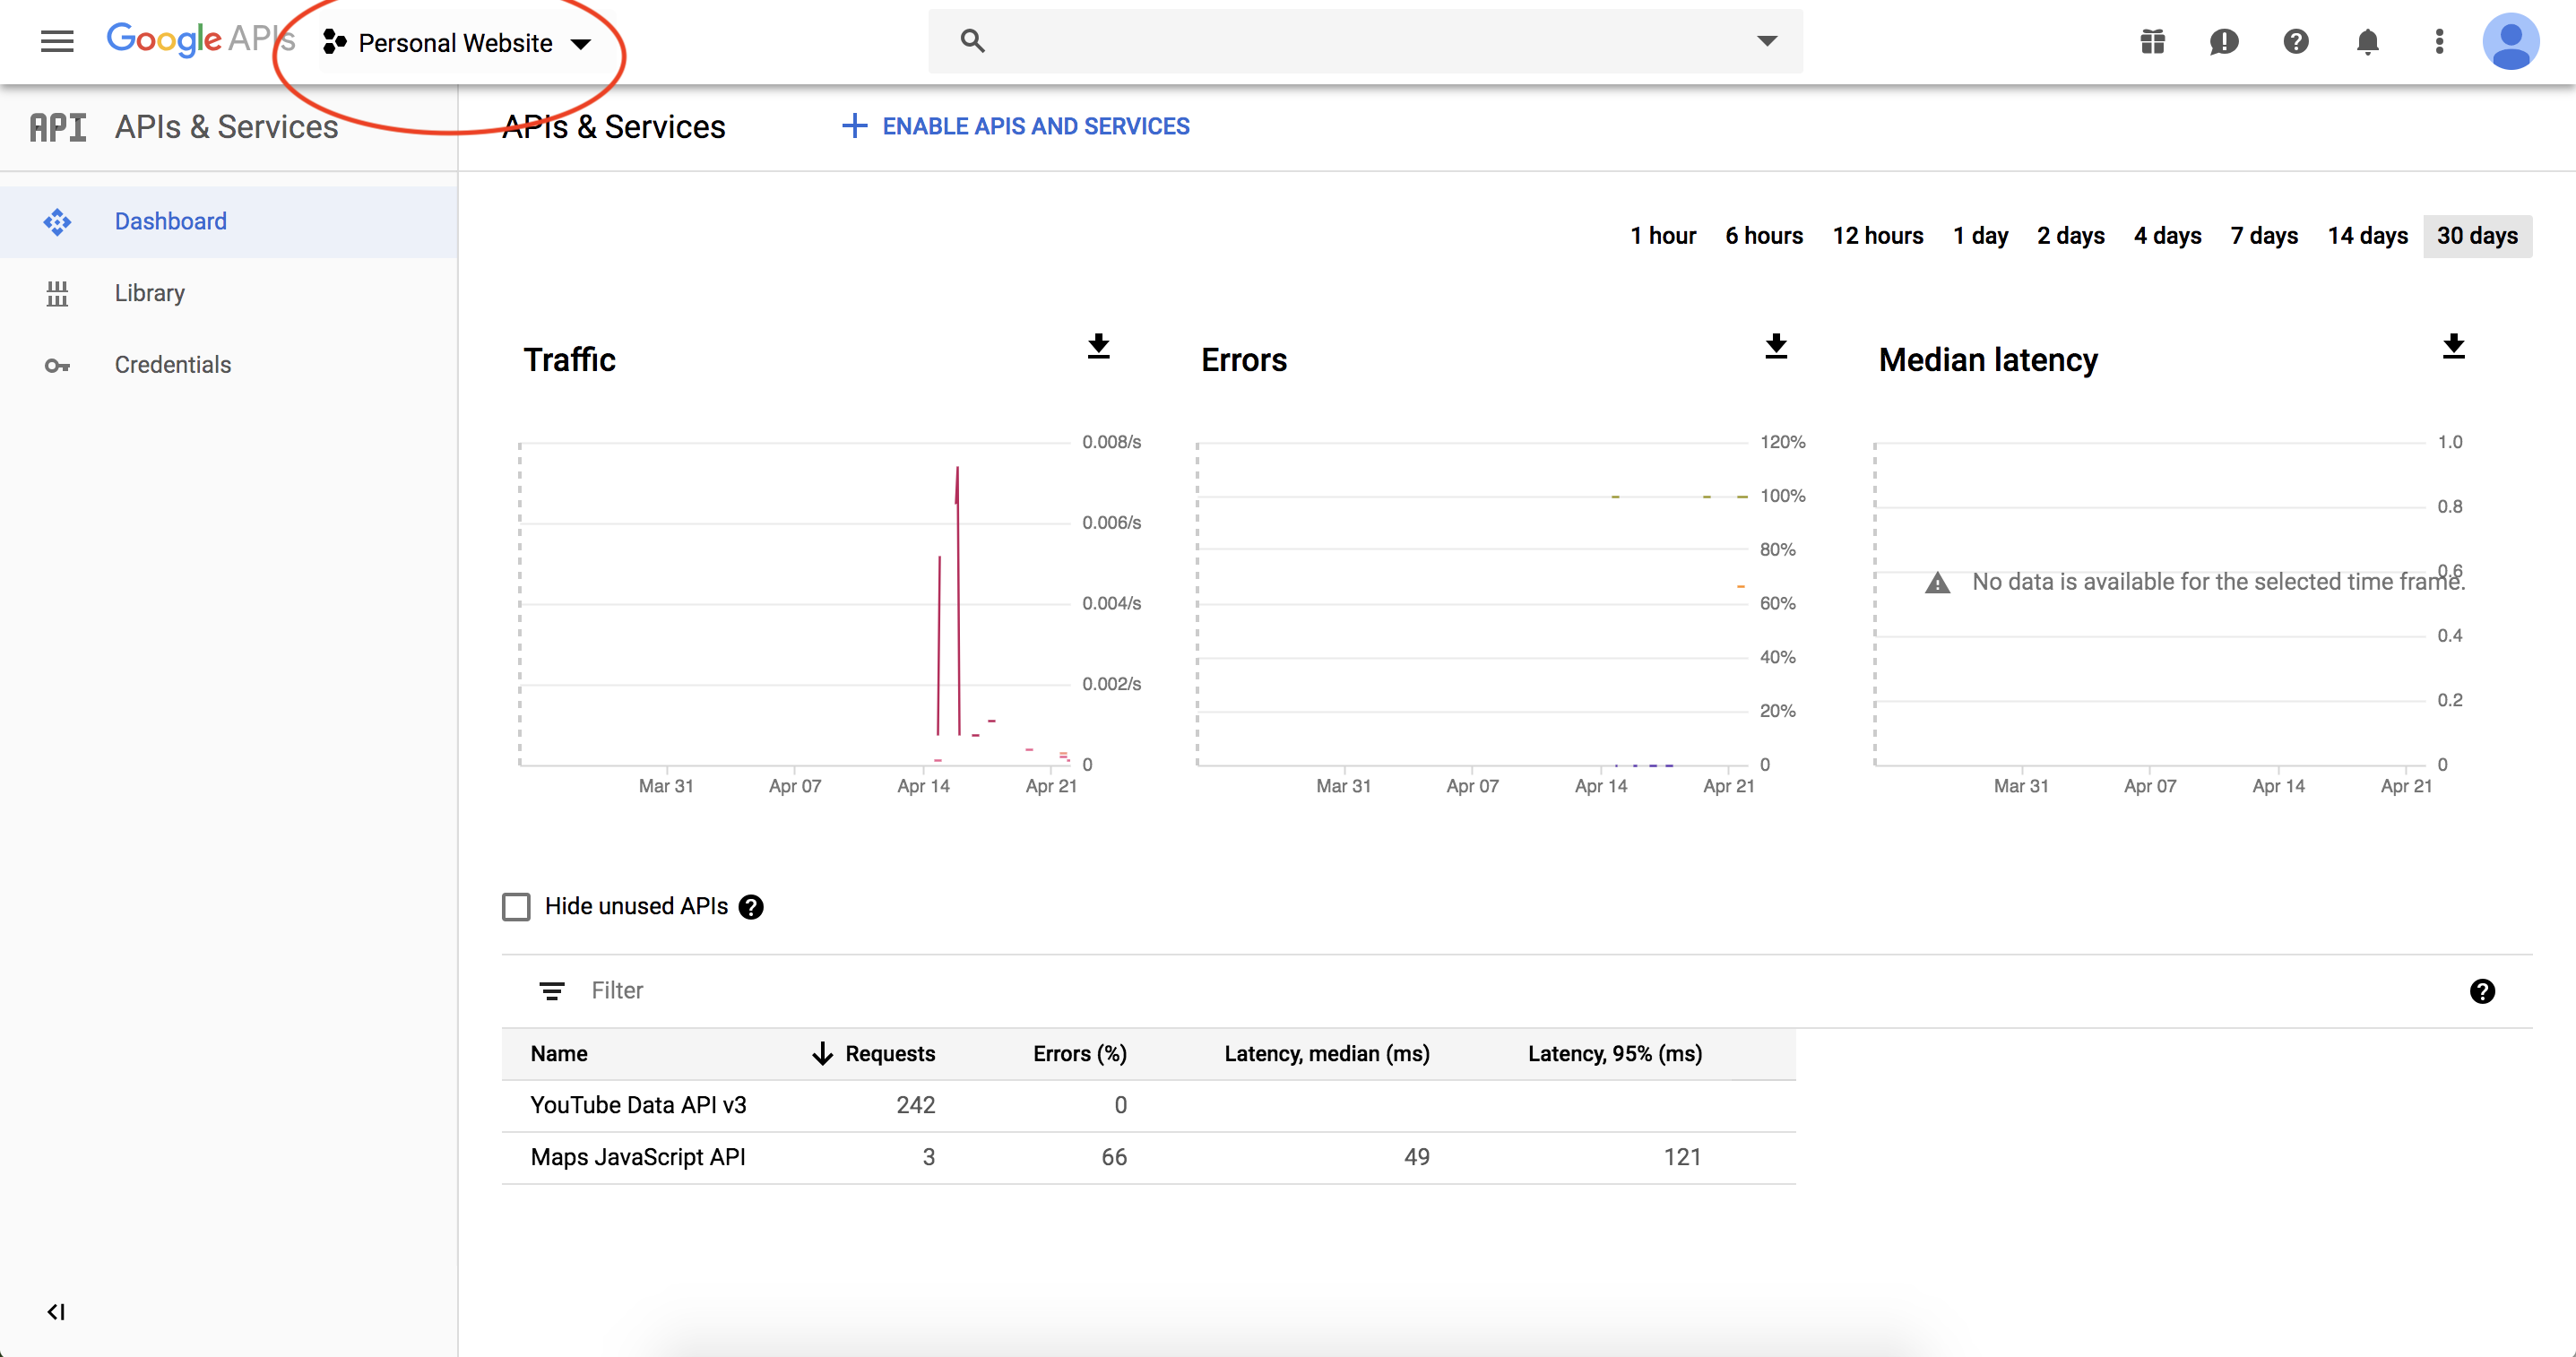
- You should see a screen that looks like the one below. Click on
Personal Websiteor whatever the name of your project is in the top bar.
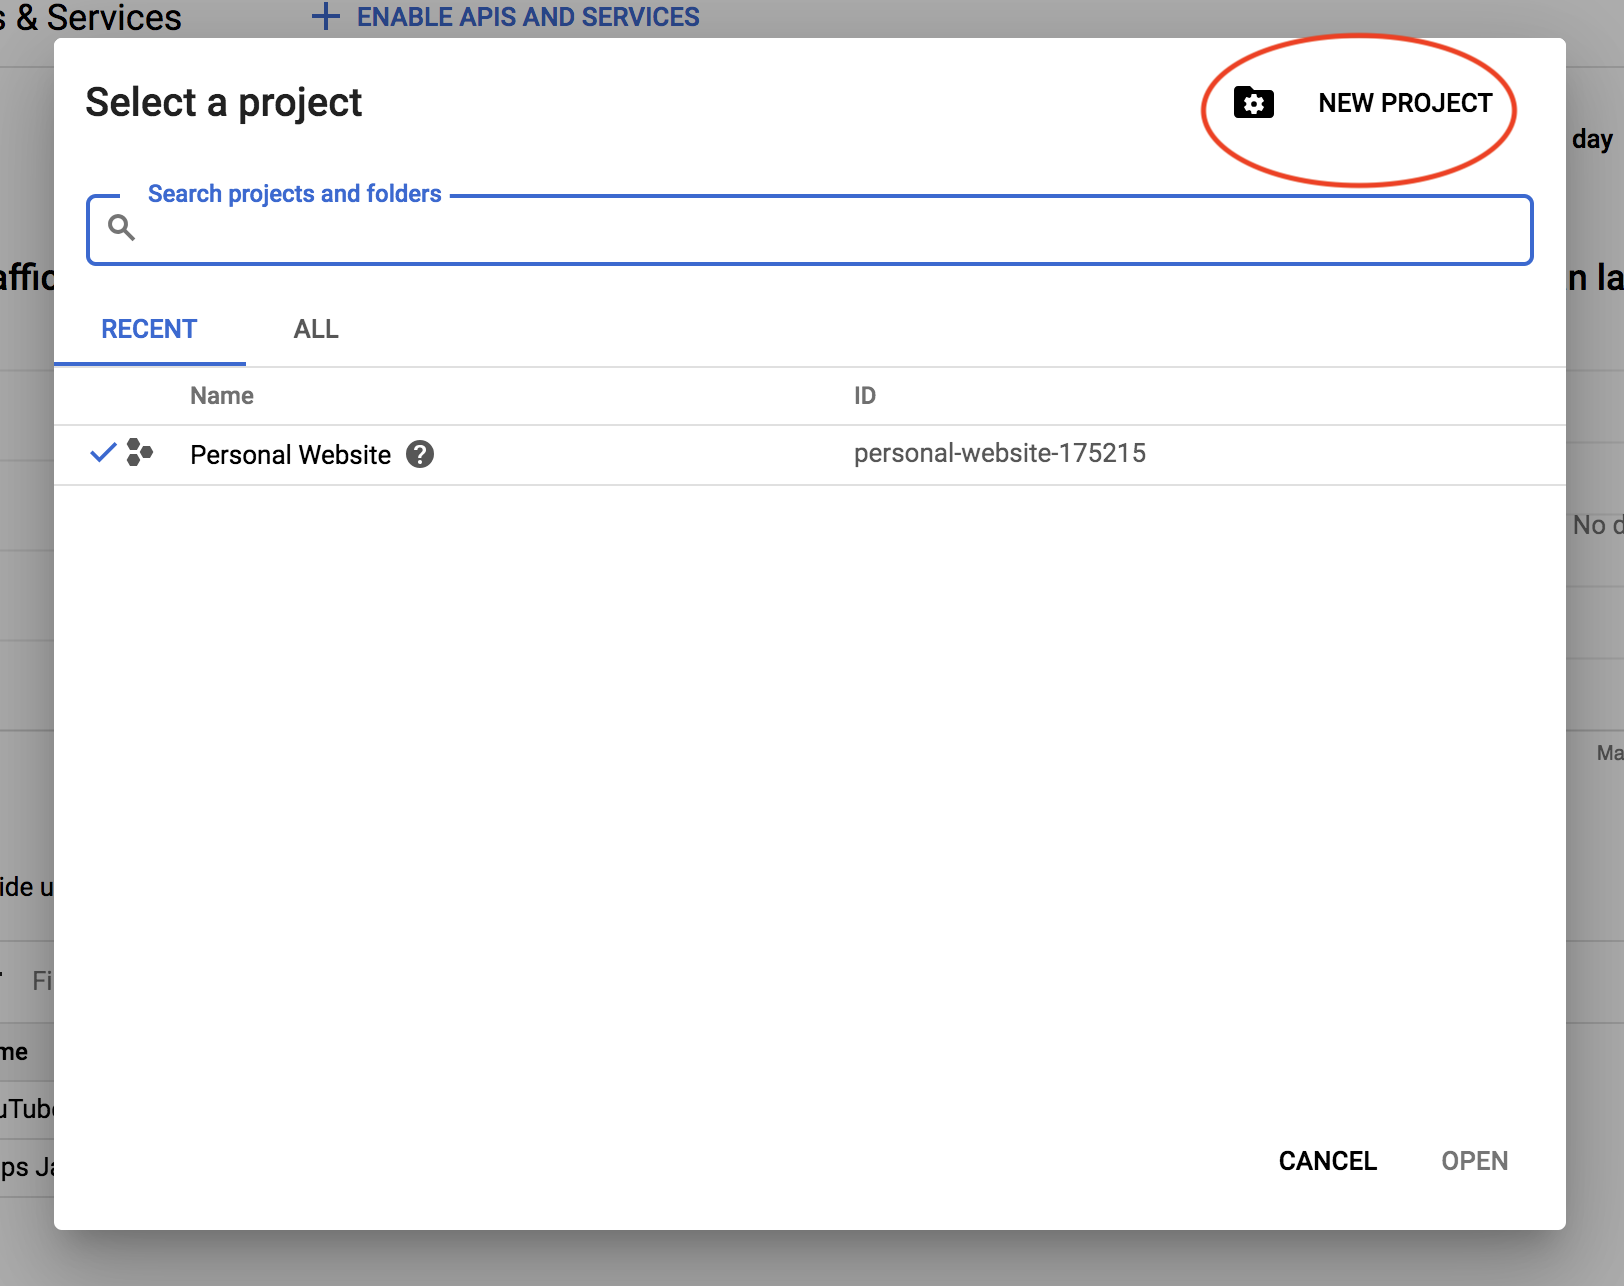
- After you click that you should see a page that looks like the one down here. You're going to click on
NEW PROJECT.
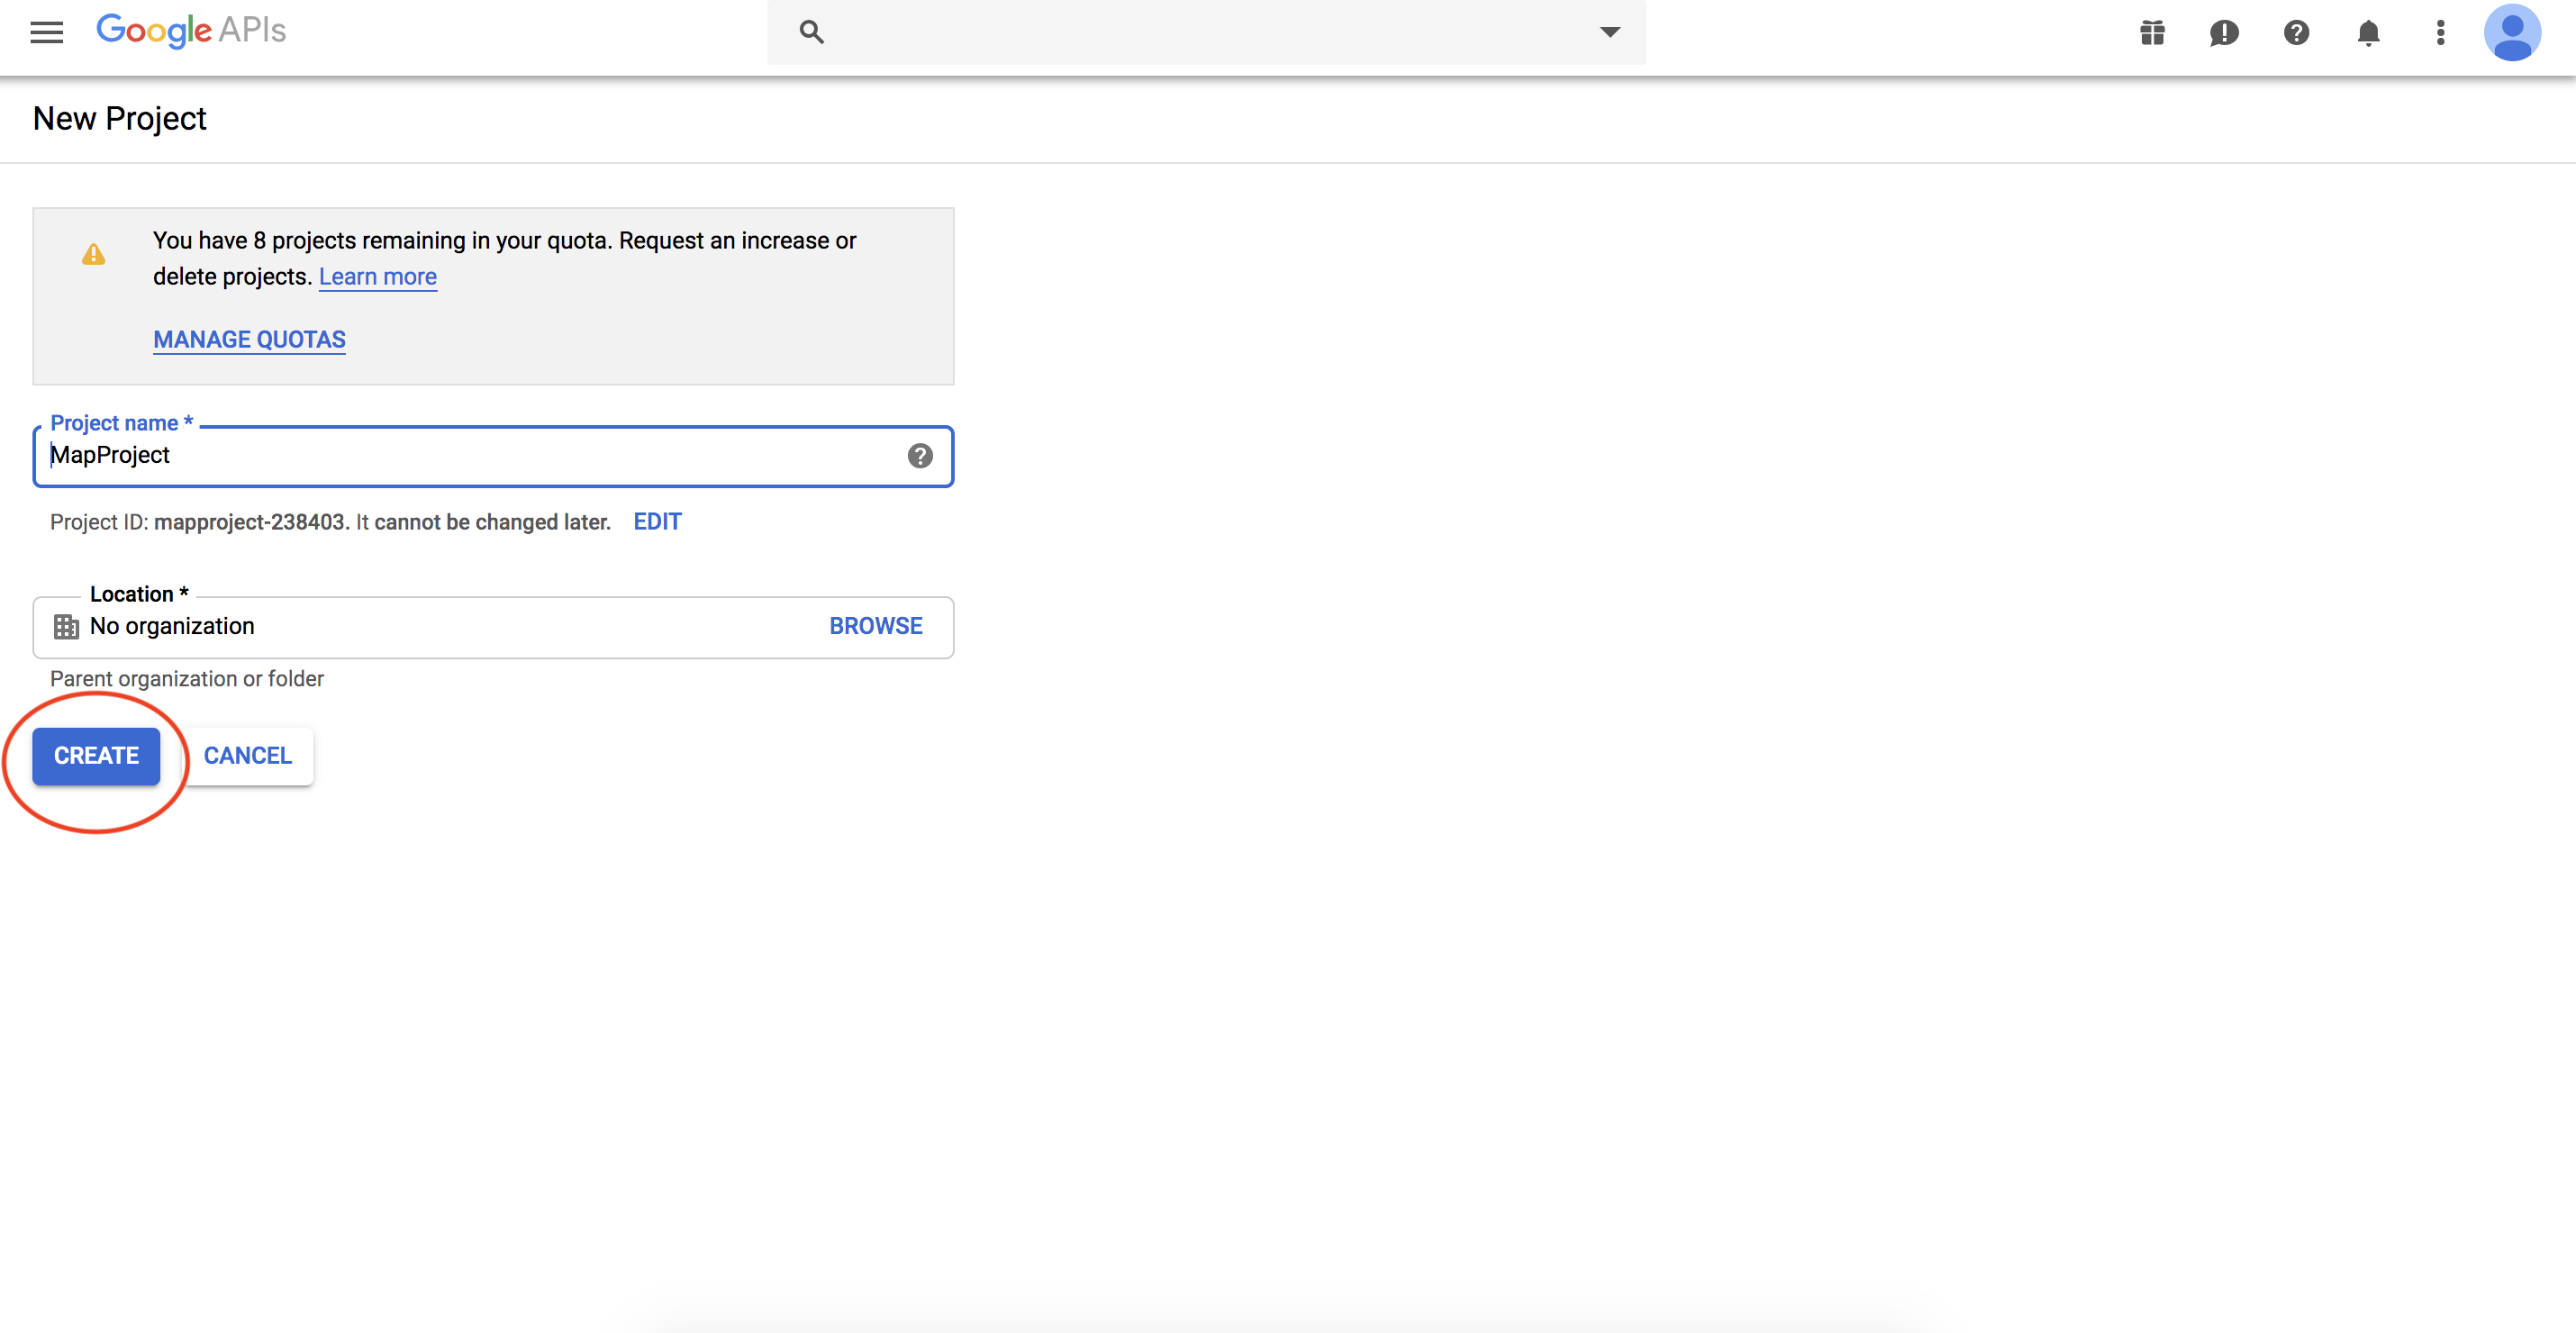
- Then you'll see something like this. Name your new project and click create!
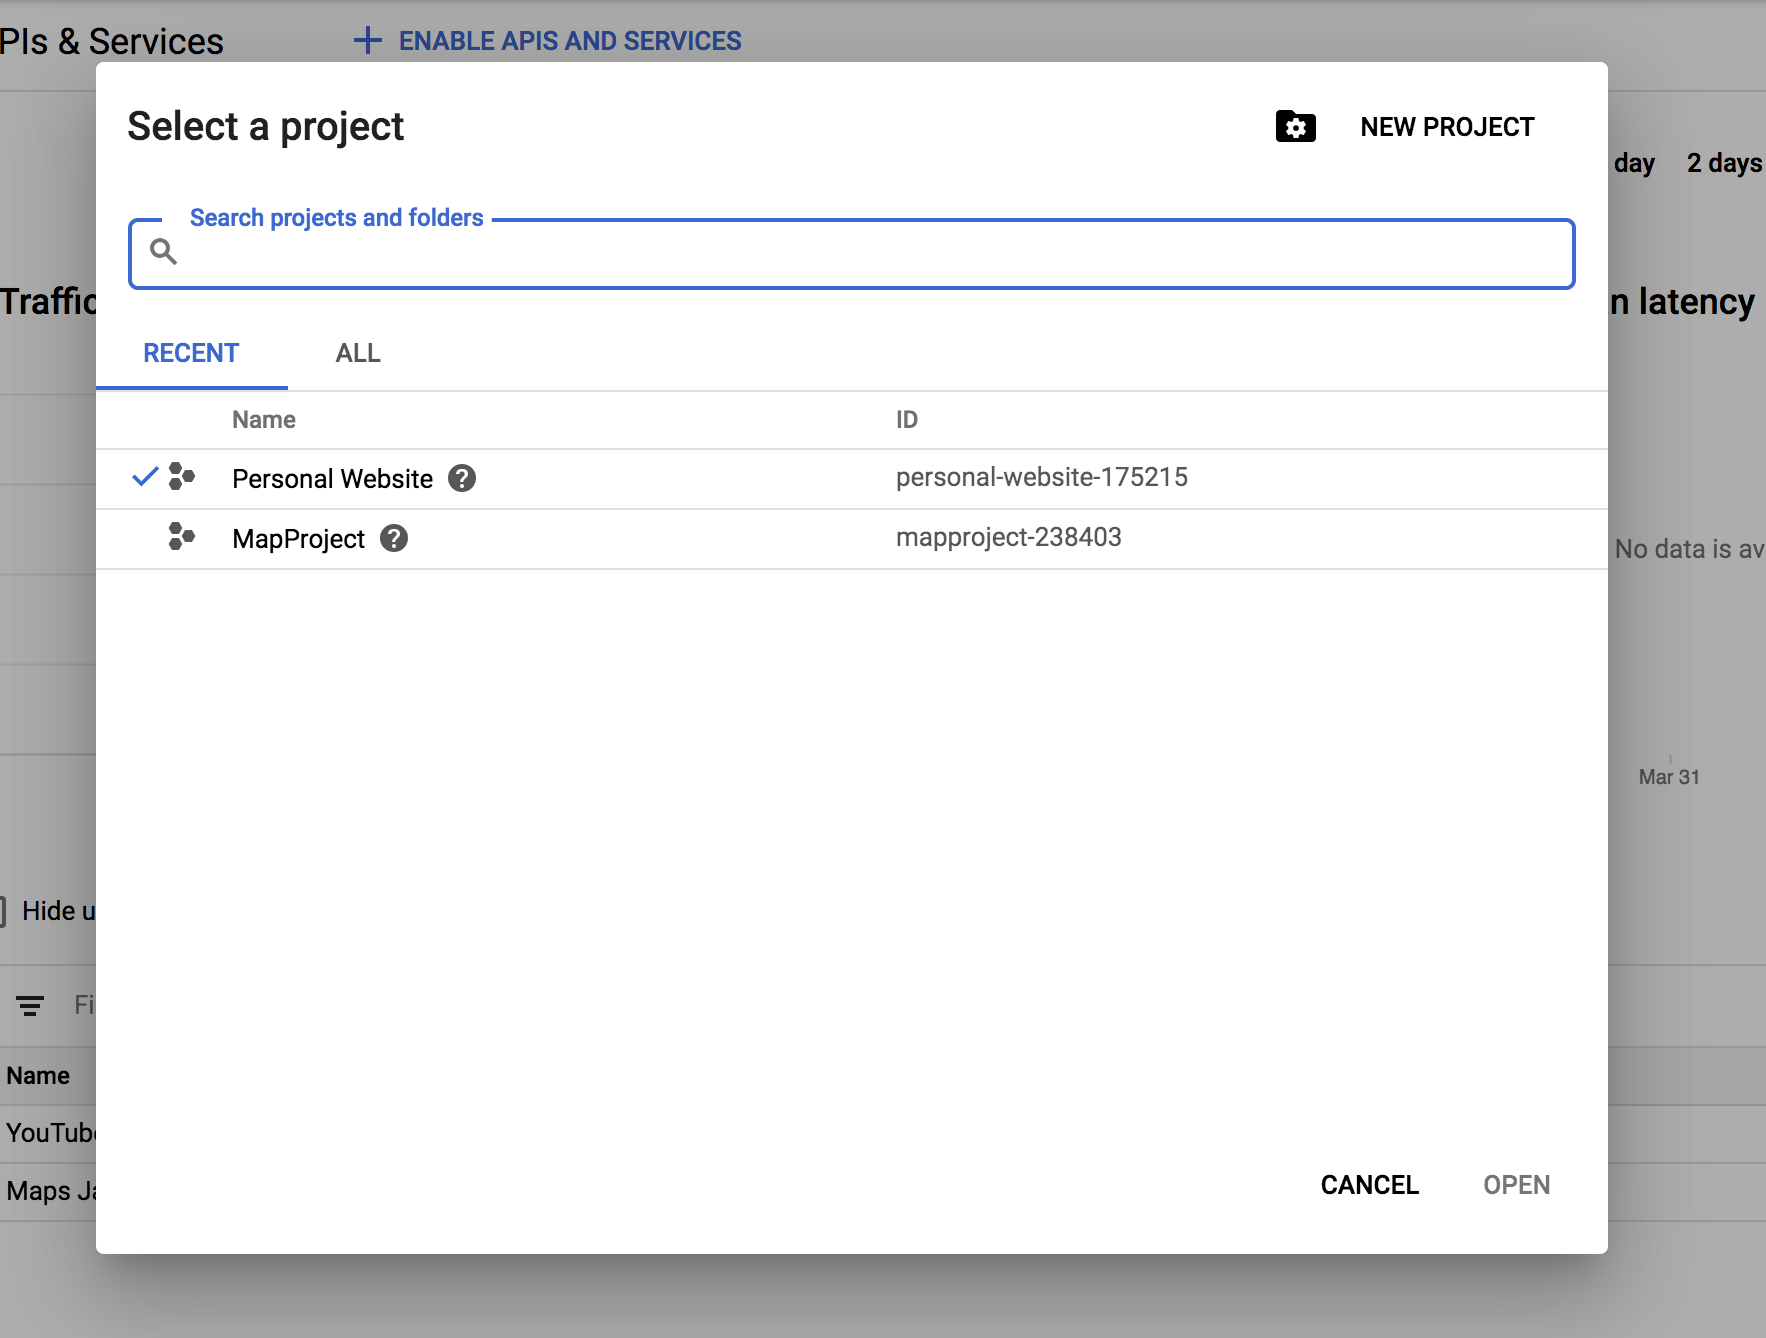
- We're almost there! Now you should be redirected back to the first screen, and we're going to click on
Personal Websiteor whatever it is for you again.
- Select your new project in the menu and click open. You should see something like this. If your project isn't listed, just search for it.
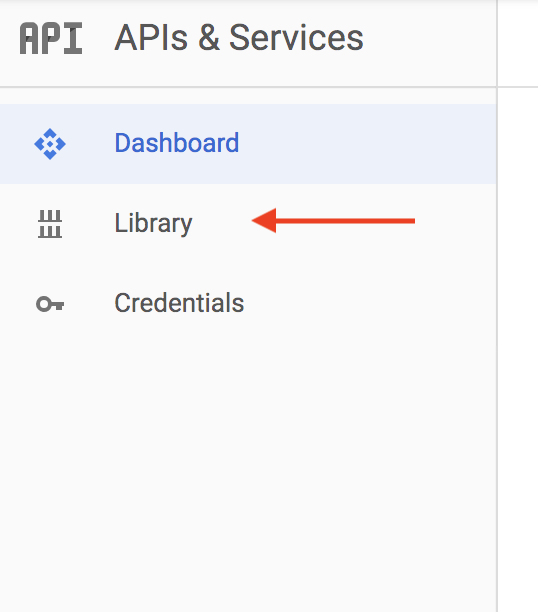
- Almost there we promise! Select Library on the left hand, invisible menu and you should see a screen like this:
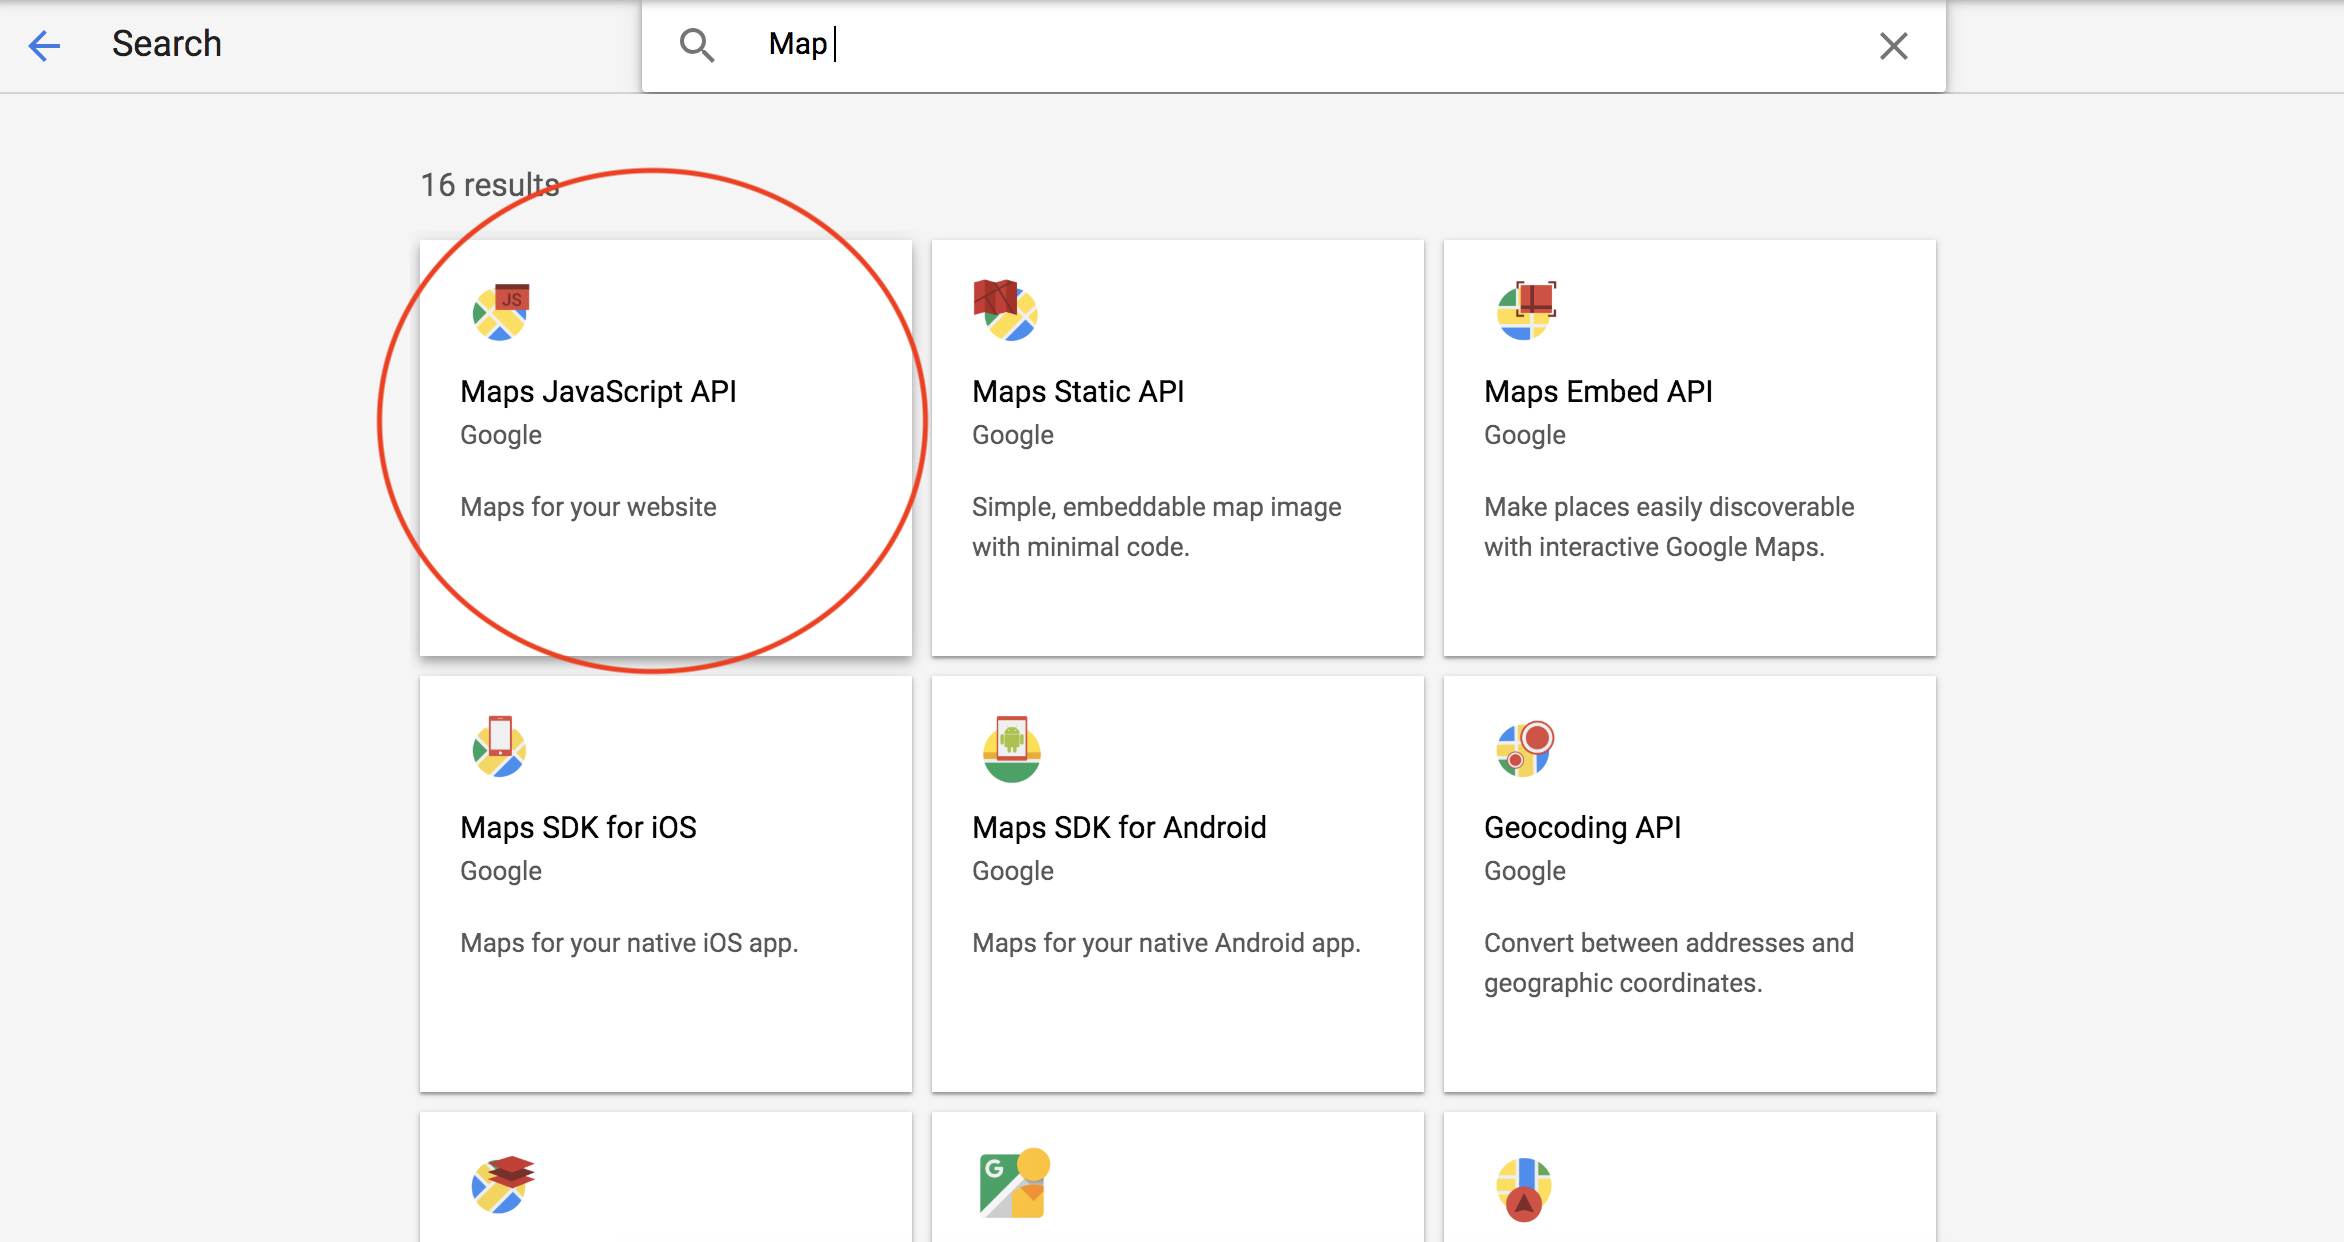
- Next, search for "Google Maps JavaScript API" it should look like this and then click on it:
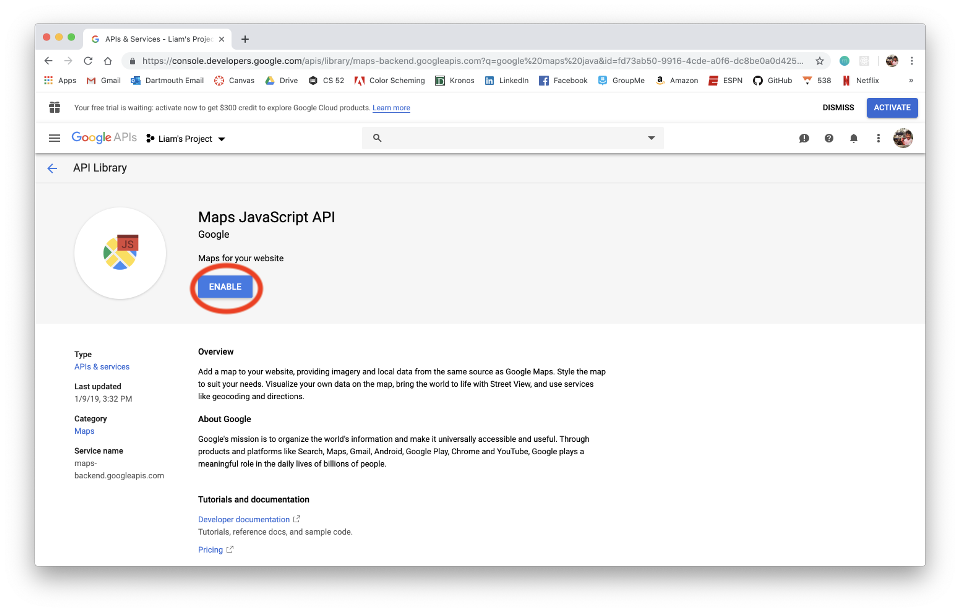
- Once you've clicked on the "Google Maps JavaScript API" click enable to enable that API
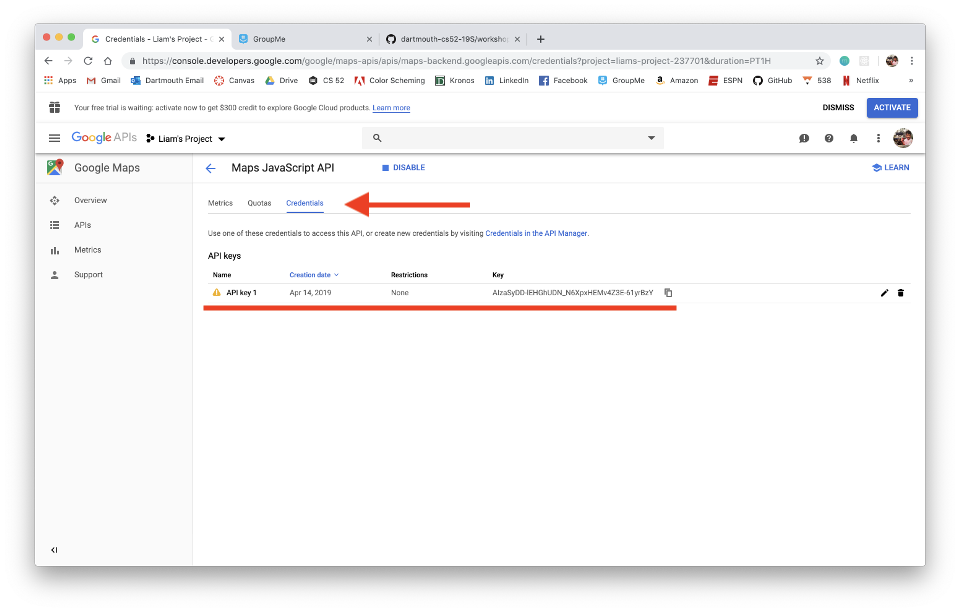
- You'll be taken to a screen that looks something like this. Click on Credentials
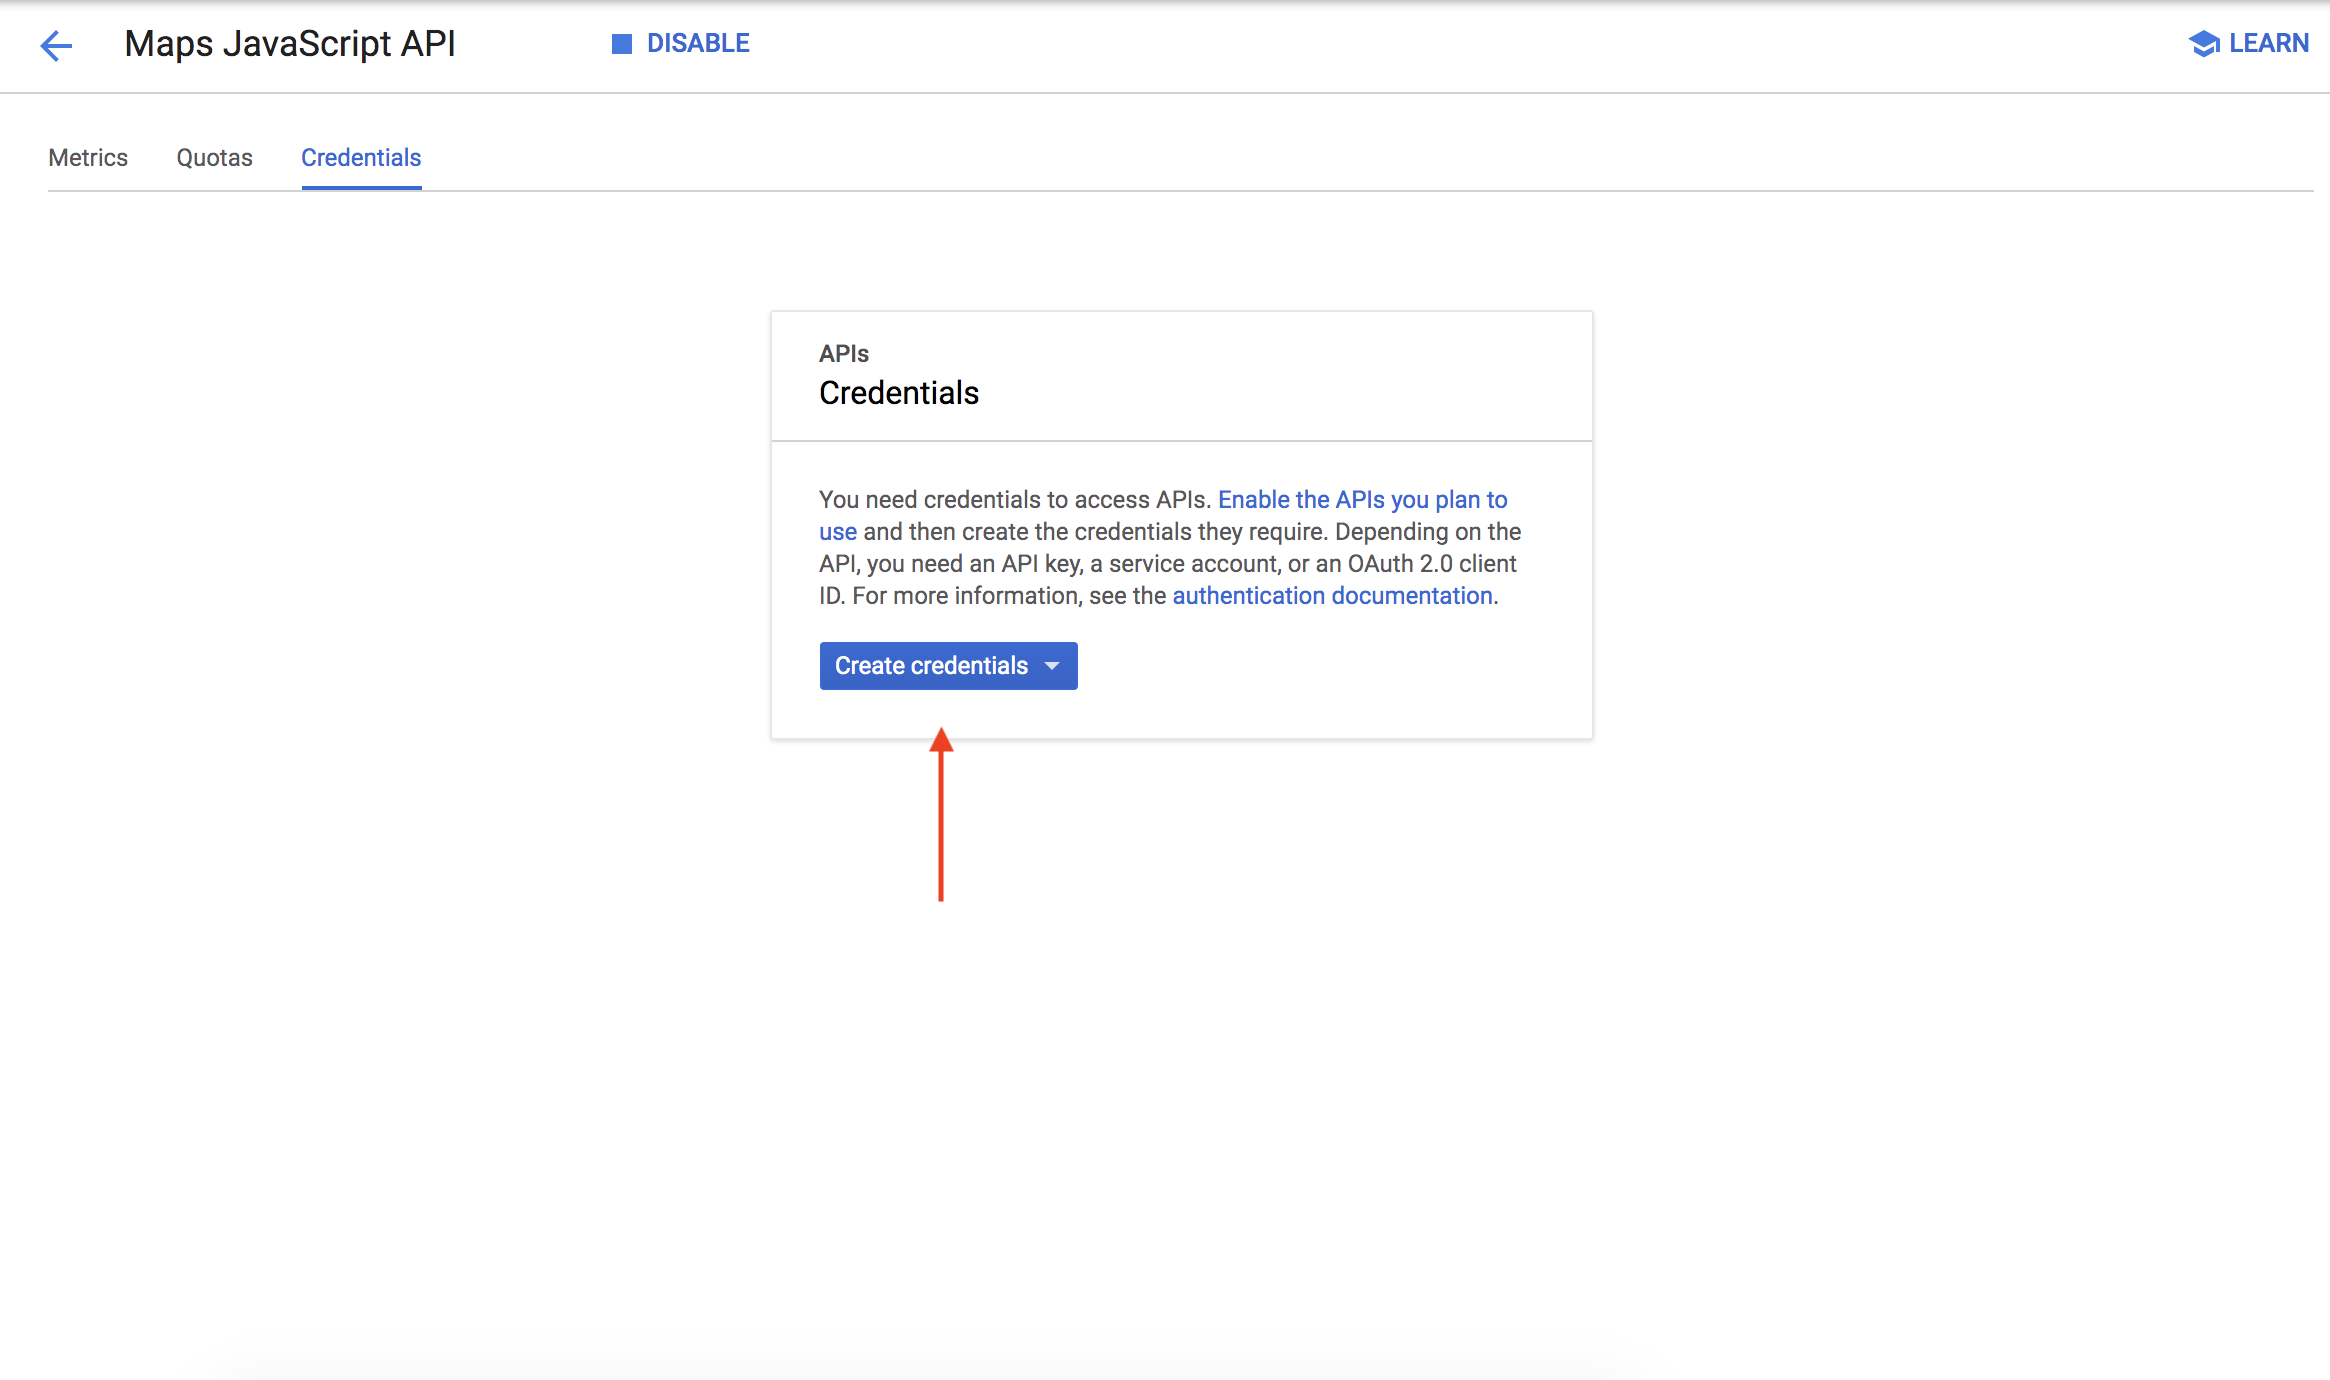
- If you see something like the screen below, click
Create Credentials
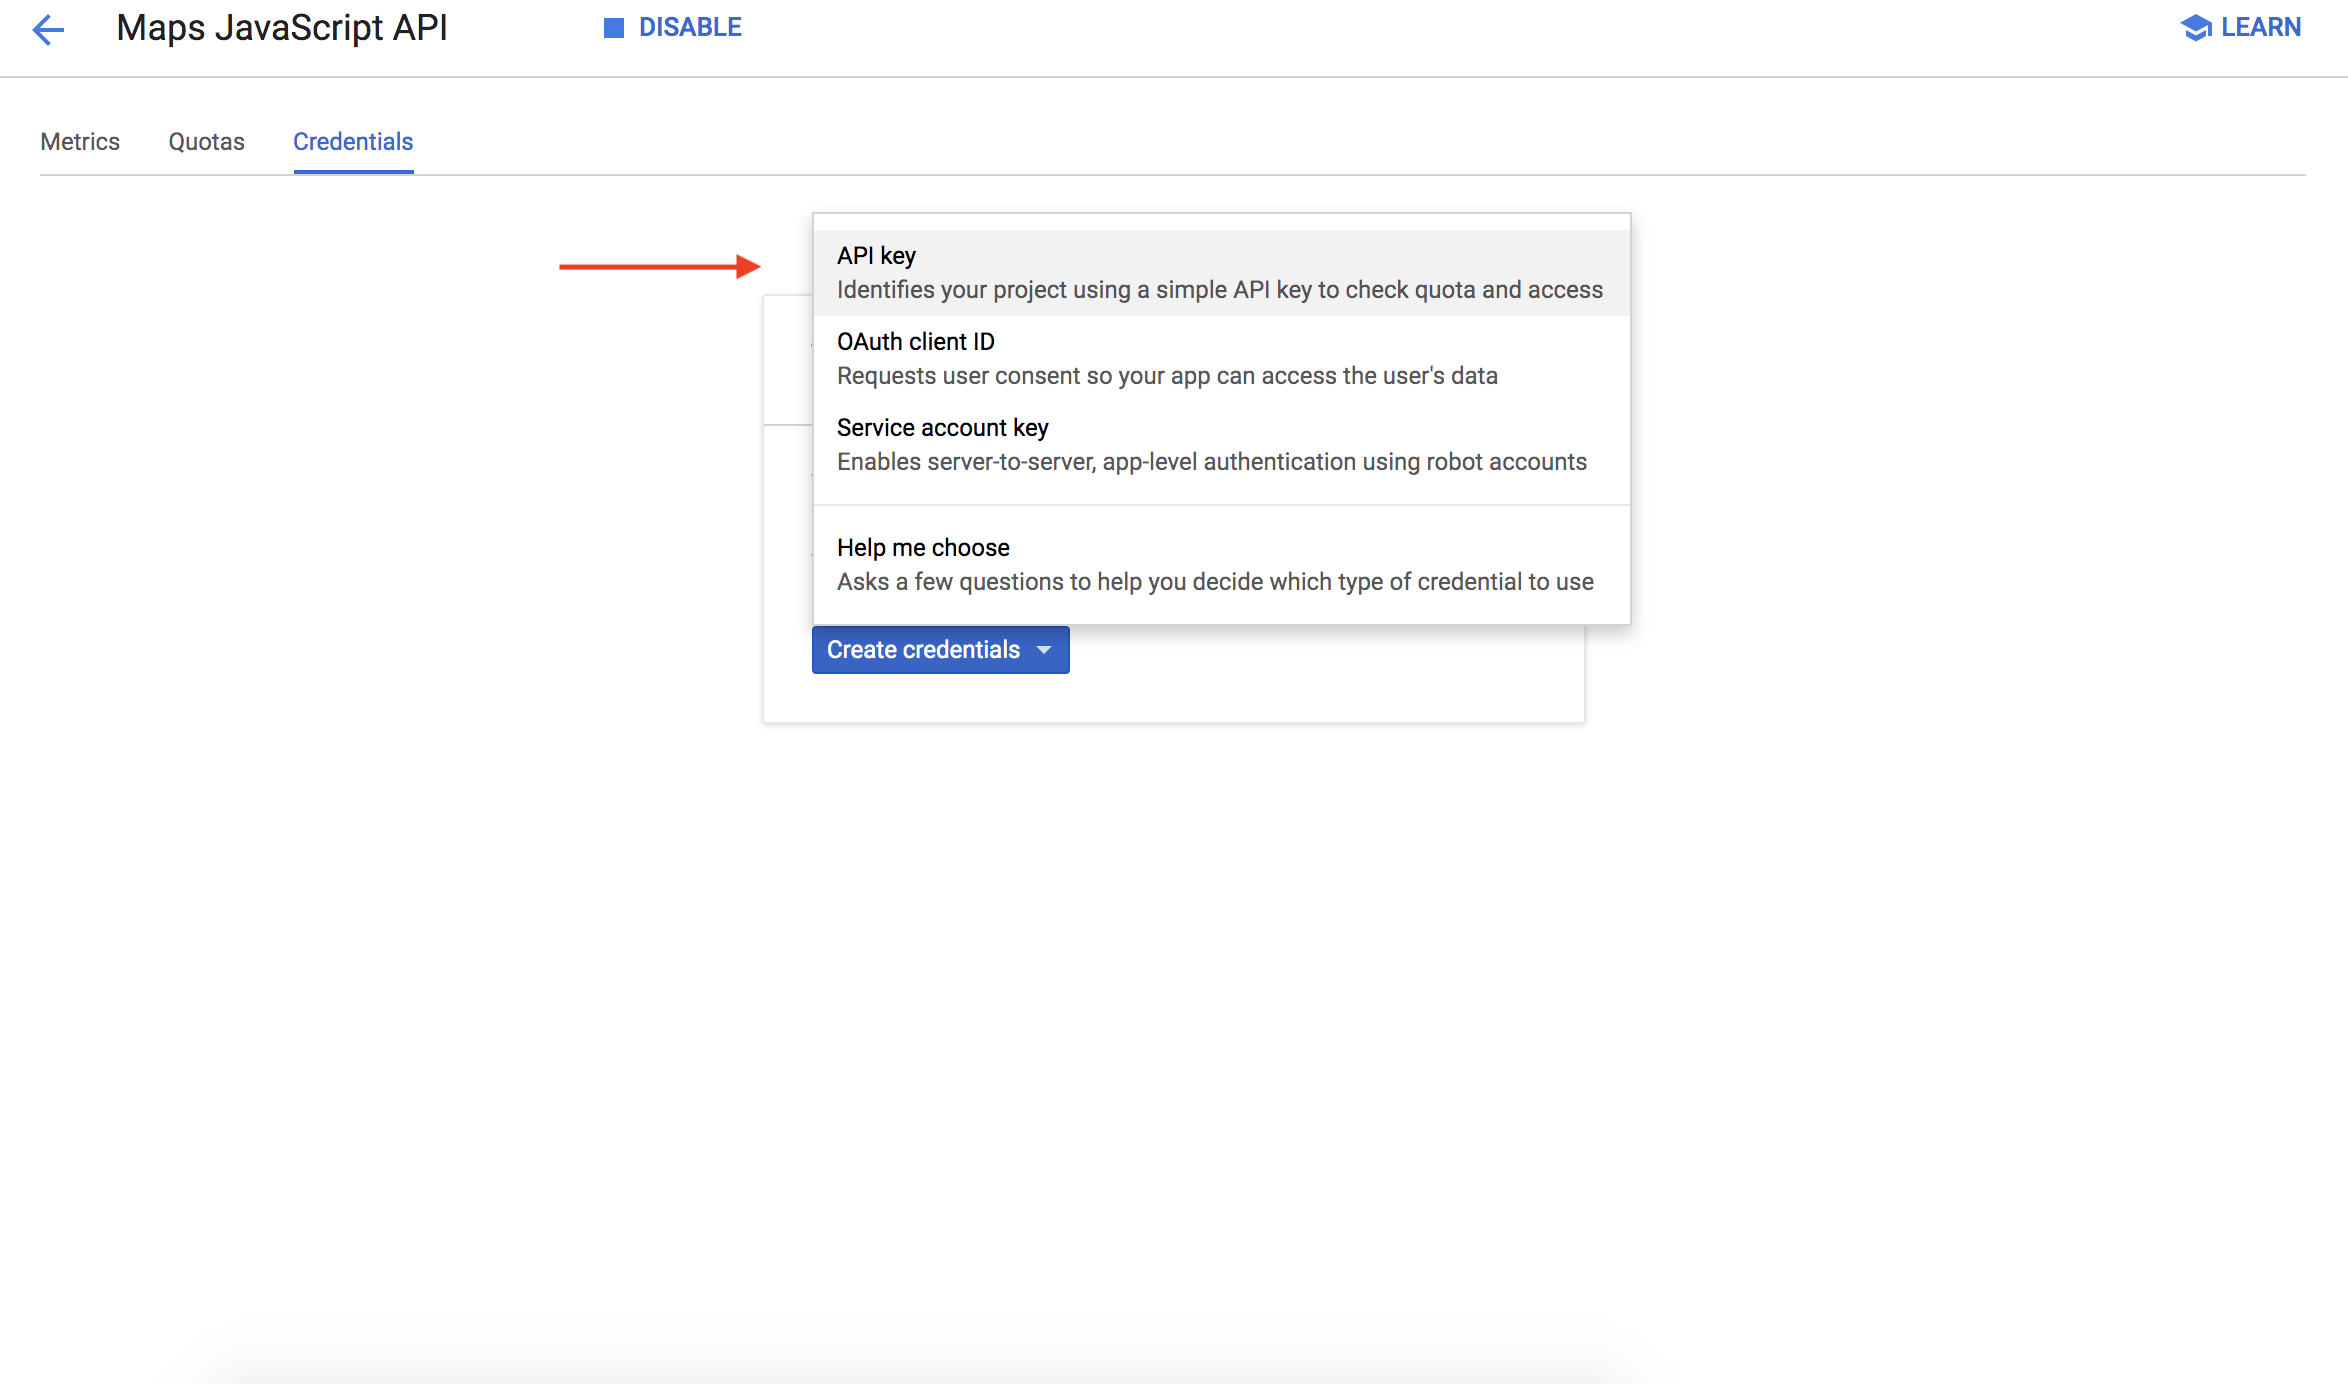
- Last step! Select API Key from this menu and there you have it!
Time to start coding! cd src and open up App.js. This is the main component we will be working with and editing. To start, let's add your API key. Insert your copied key where it says ENTER_YOUR_API_KEY_HERE. This way, you can get access to everything Google Maps has to offer.
Let's start out by getting a basic Google Map to load on the screen, and then we'll start adding features. google react maps already has a component called Map that we'll be using to load our map. We need to import the Map component from google react maps. At the top of your App.js add:
import { Map, GoogleApiWrapper } from 'google-maps-react';Now that everything's set up, we're going to start adding to our application. Throughout building you can run yarn start from workshop-ws-04-23-maps to see your changes in real time!
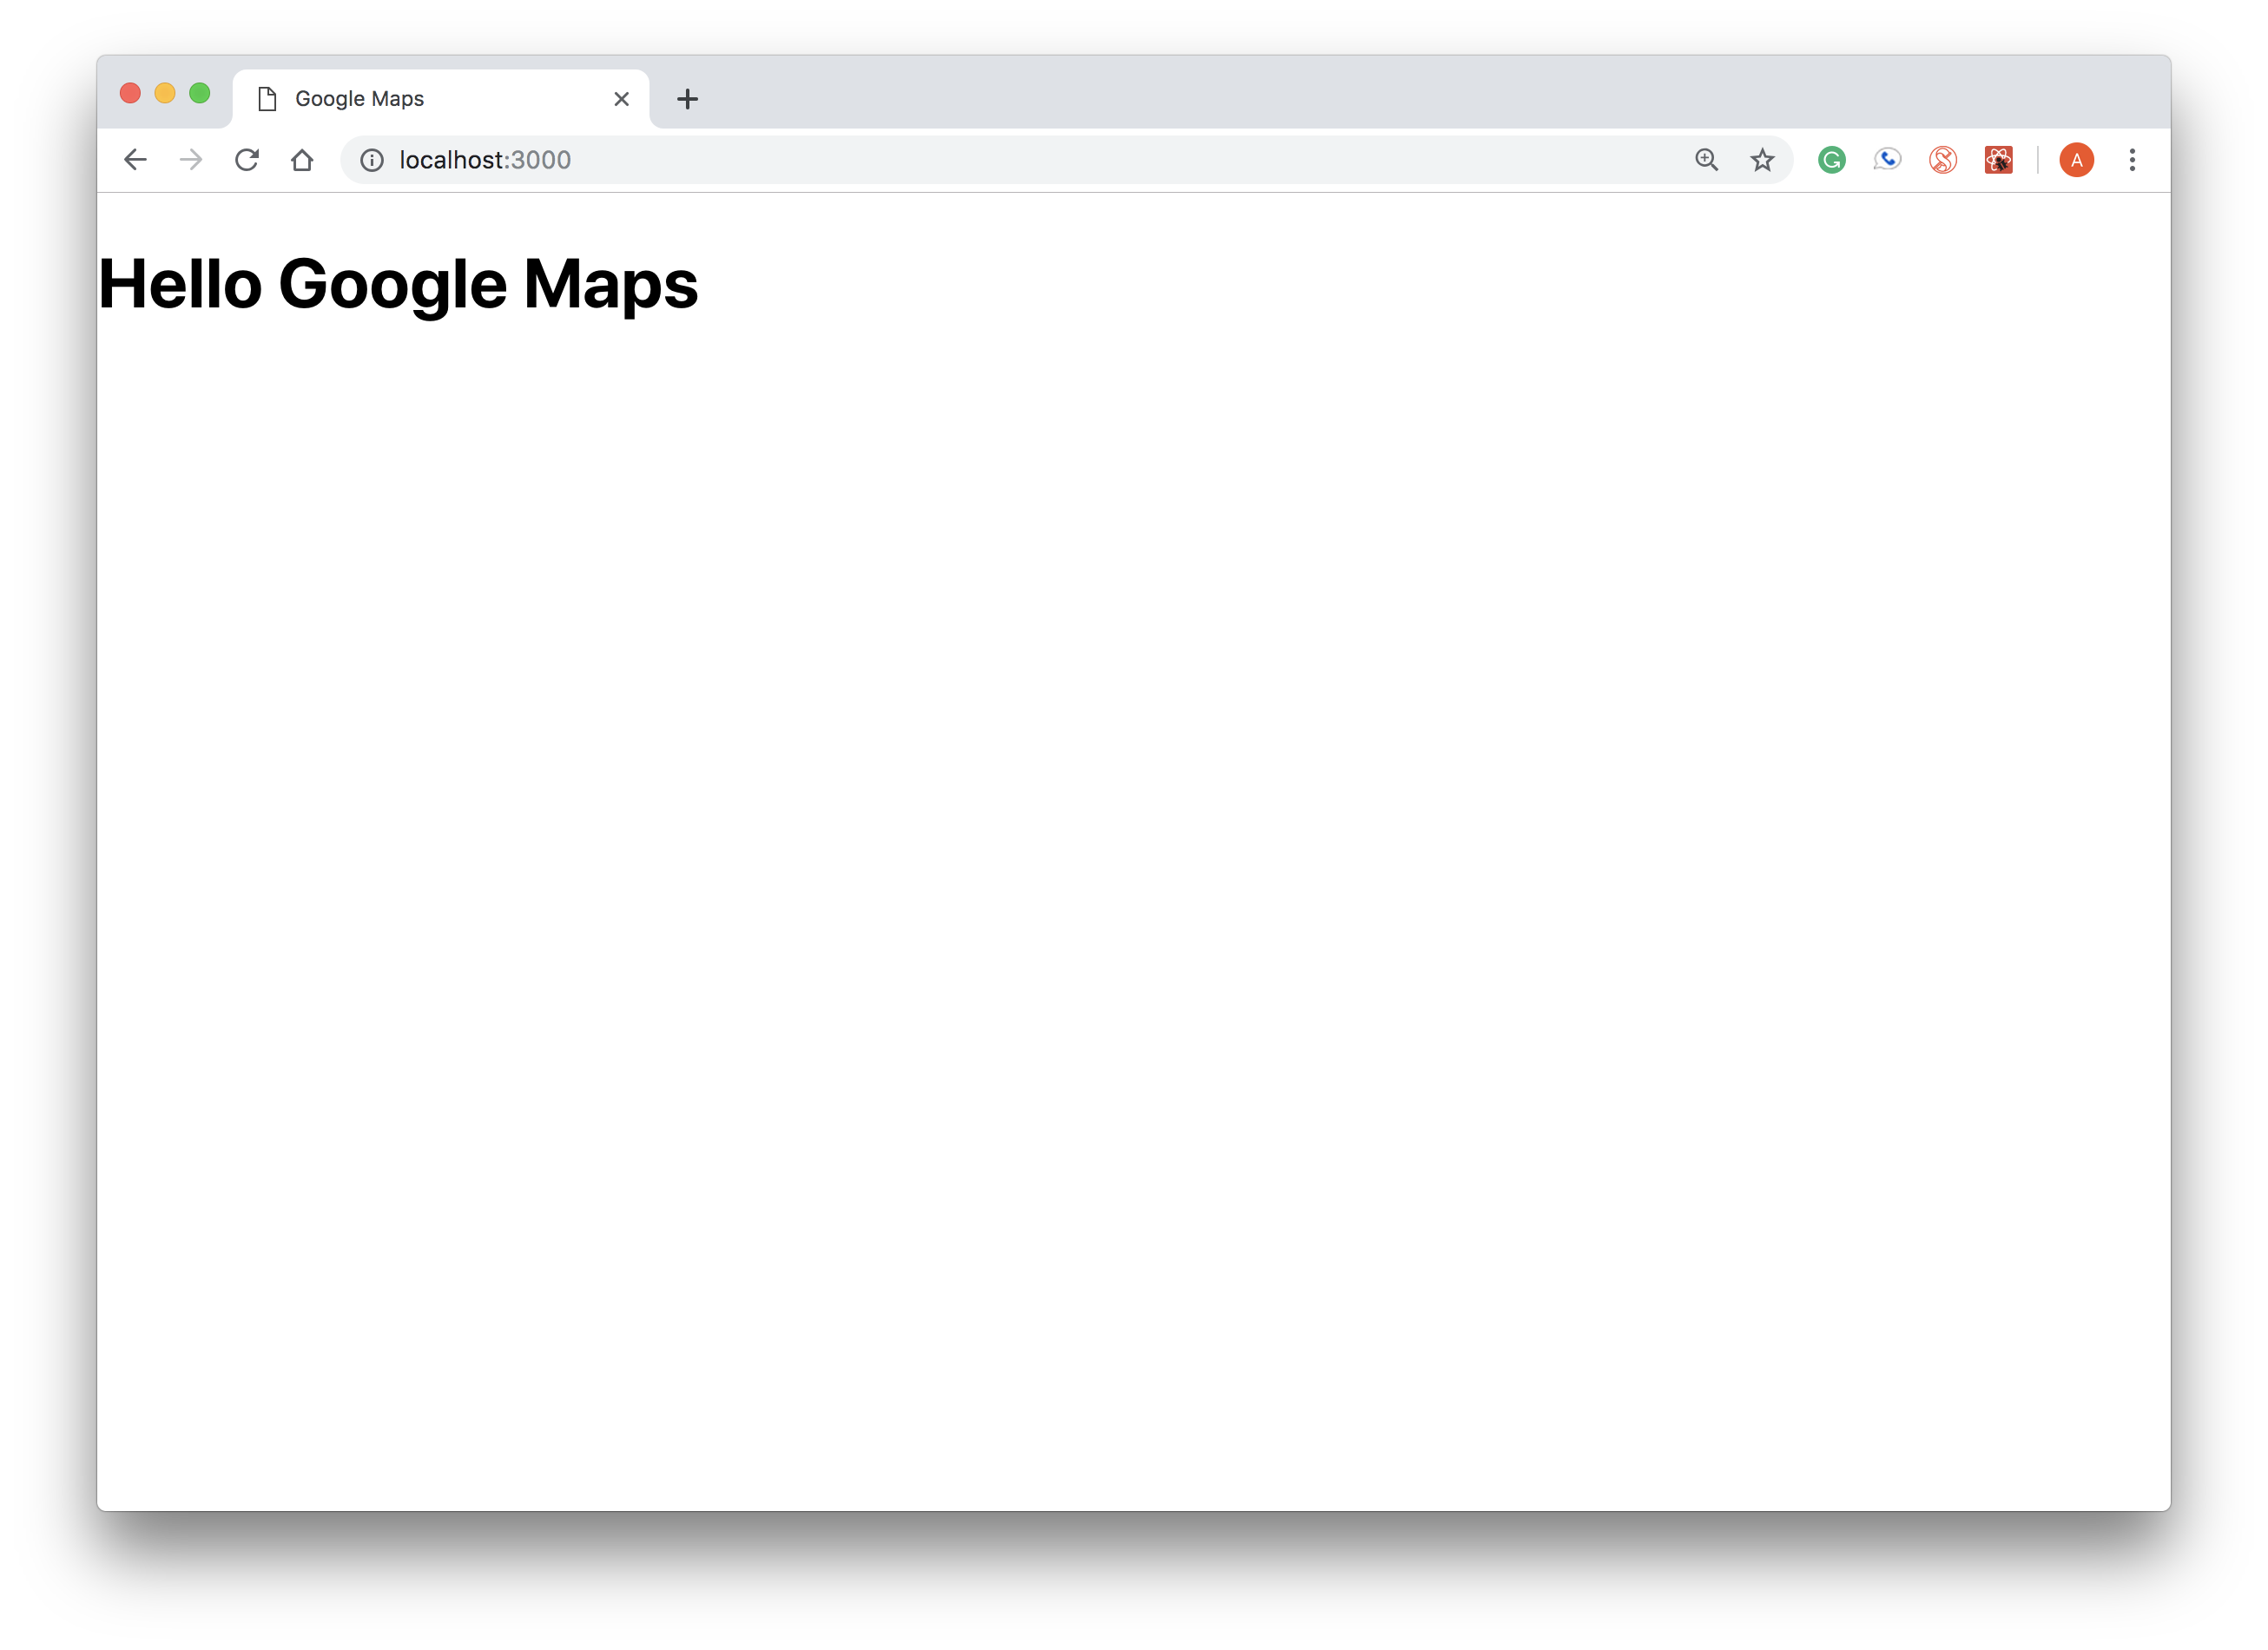
After running yarn start in terminal you should see this image! If you do you're all set to go.
Where's the map?! It's coming just be patient 😁
❗ You might have noticed that linting isn't turned on! This is because we have turned off linting in our special starter pack. I know you miss it but it should be fine for this demo.
Now we're going to render our Map component. In your render method, under the H1 tag, add:
<Map
    google={this.props.google}
>
</Map>
Wait where is this.props.google coming from? GoogleApiWrapper is a Higher Order Component which comes from the google react maps library. At the end of App.js, we pass our class MapContainer into GoogleApiWrapper. GoogleApiWrapper does some magic (i.e. abstracts out a lot of work) with our MapContainer and along the way, will pass it a prop called google.
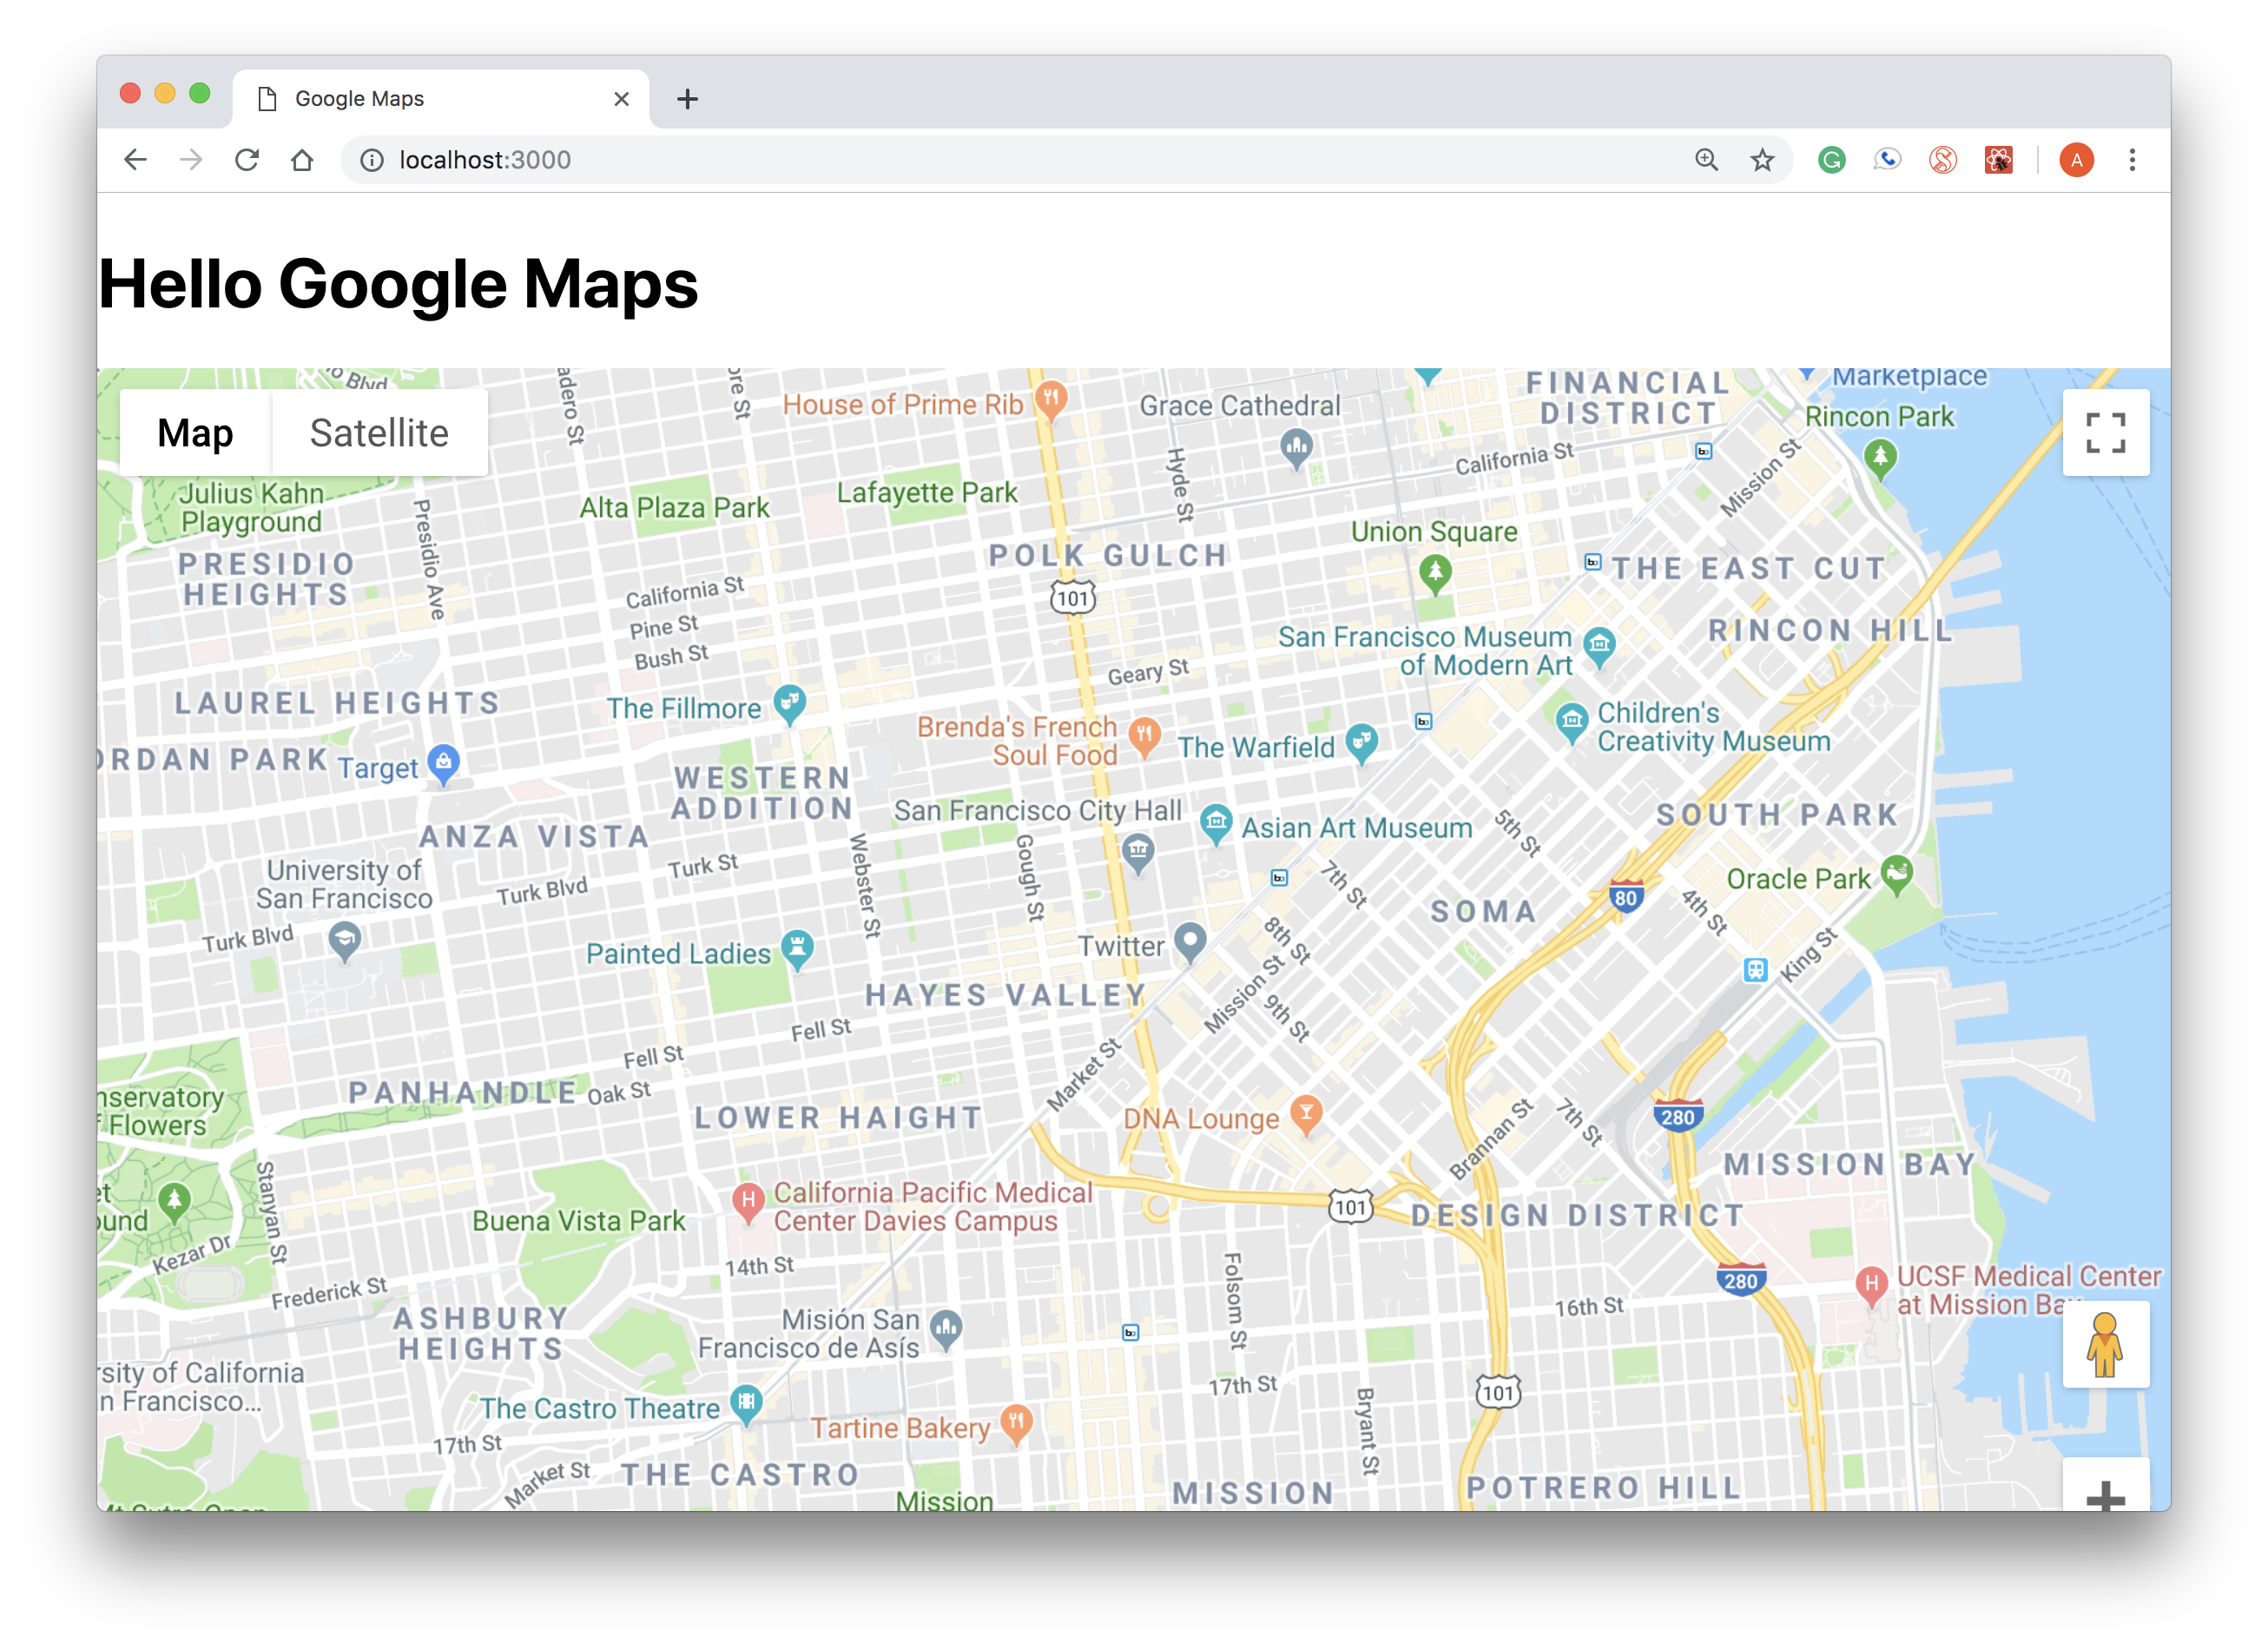
Look at that map! 😱 You should have something that looks like this
Feel free to play with the buttons on the top left corner. They enable you to do things like see the terrain or satellite views. Pretty cool!
SF's cool but let's center it in Hanover! To your Map component we're going to pass it a prop called initial center which will be the latitude and longitude of the center of our map. The latitude and longitude of Dartmouth are: 43.7044, -72.2887.
Right below google={this.props.google} in the Maps tag add
initialCenter={{
    lat: YOUR LATITUDE HERE,
    lng: YOUR LONGITUDE HERE
}}
Now your map should be centered where you wanted. Next, we're going to adjust the zoom to cover all the area you want to see. Right below initial center={{...}} in the Maps tag add
zoom={16}We like the zoom set at 16, but feel free to change it.
In this library, Markers and InfoWindows are their own components. To use them, we need to import them! Add InfoWindow, Marker to import { Map, GoogleApiWrapper } from 'google-maps-react'; (the import statement you already have). Let's drop a marker!
Within your Map component, we're going to add a Marker component, so it'll be the child of <Map />. Add the code bellow between the Map tags.
<Marker
    name={'This is a marker we just made yay!'}
/>
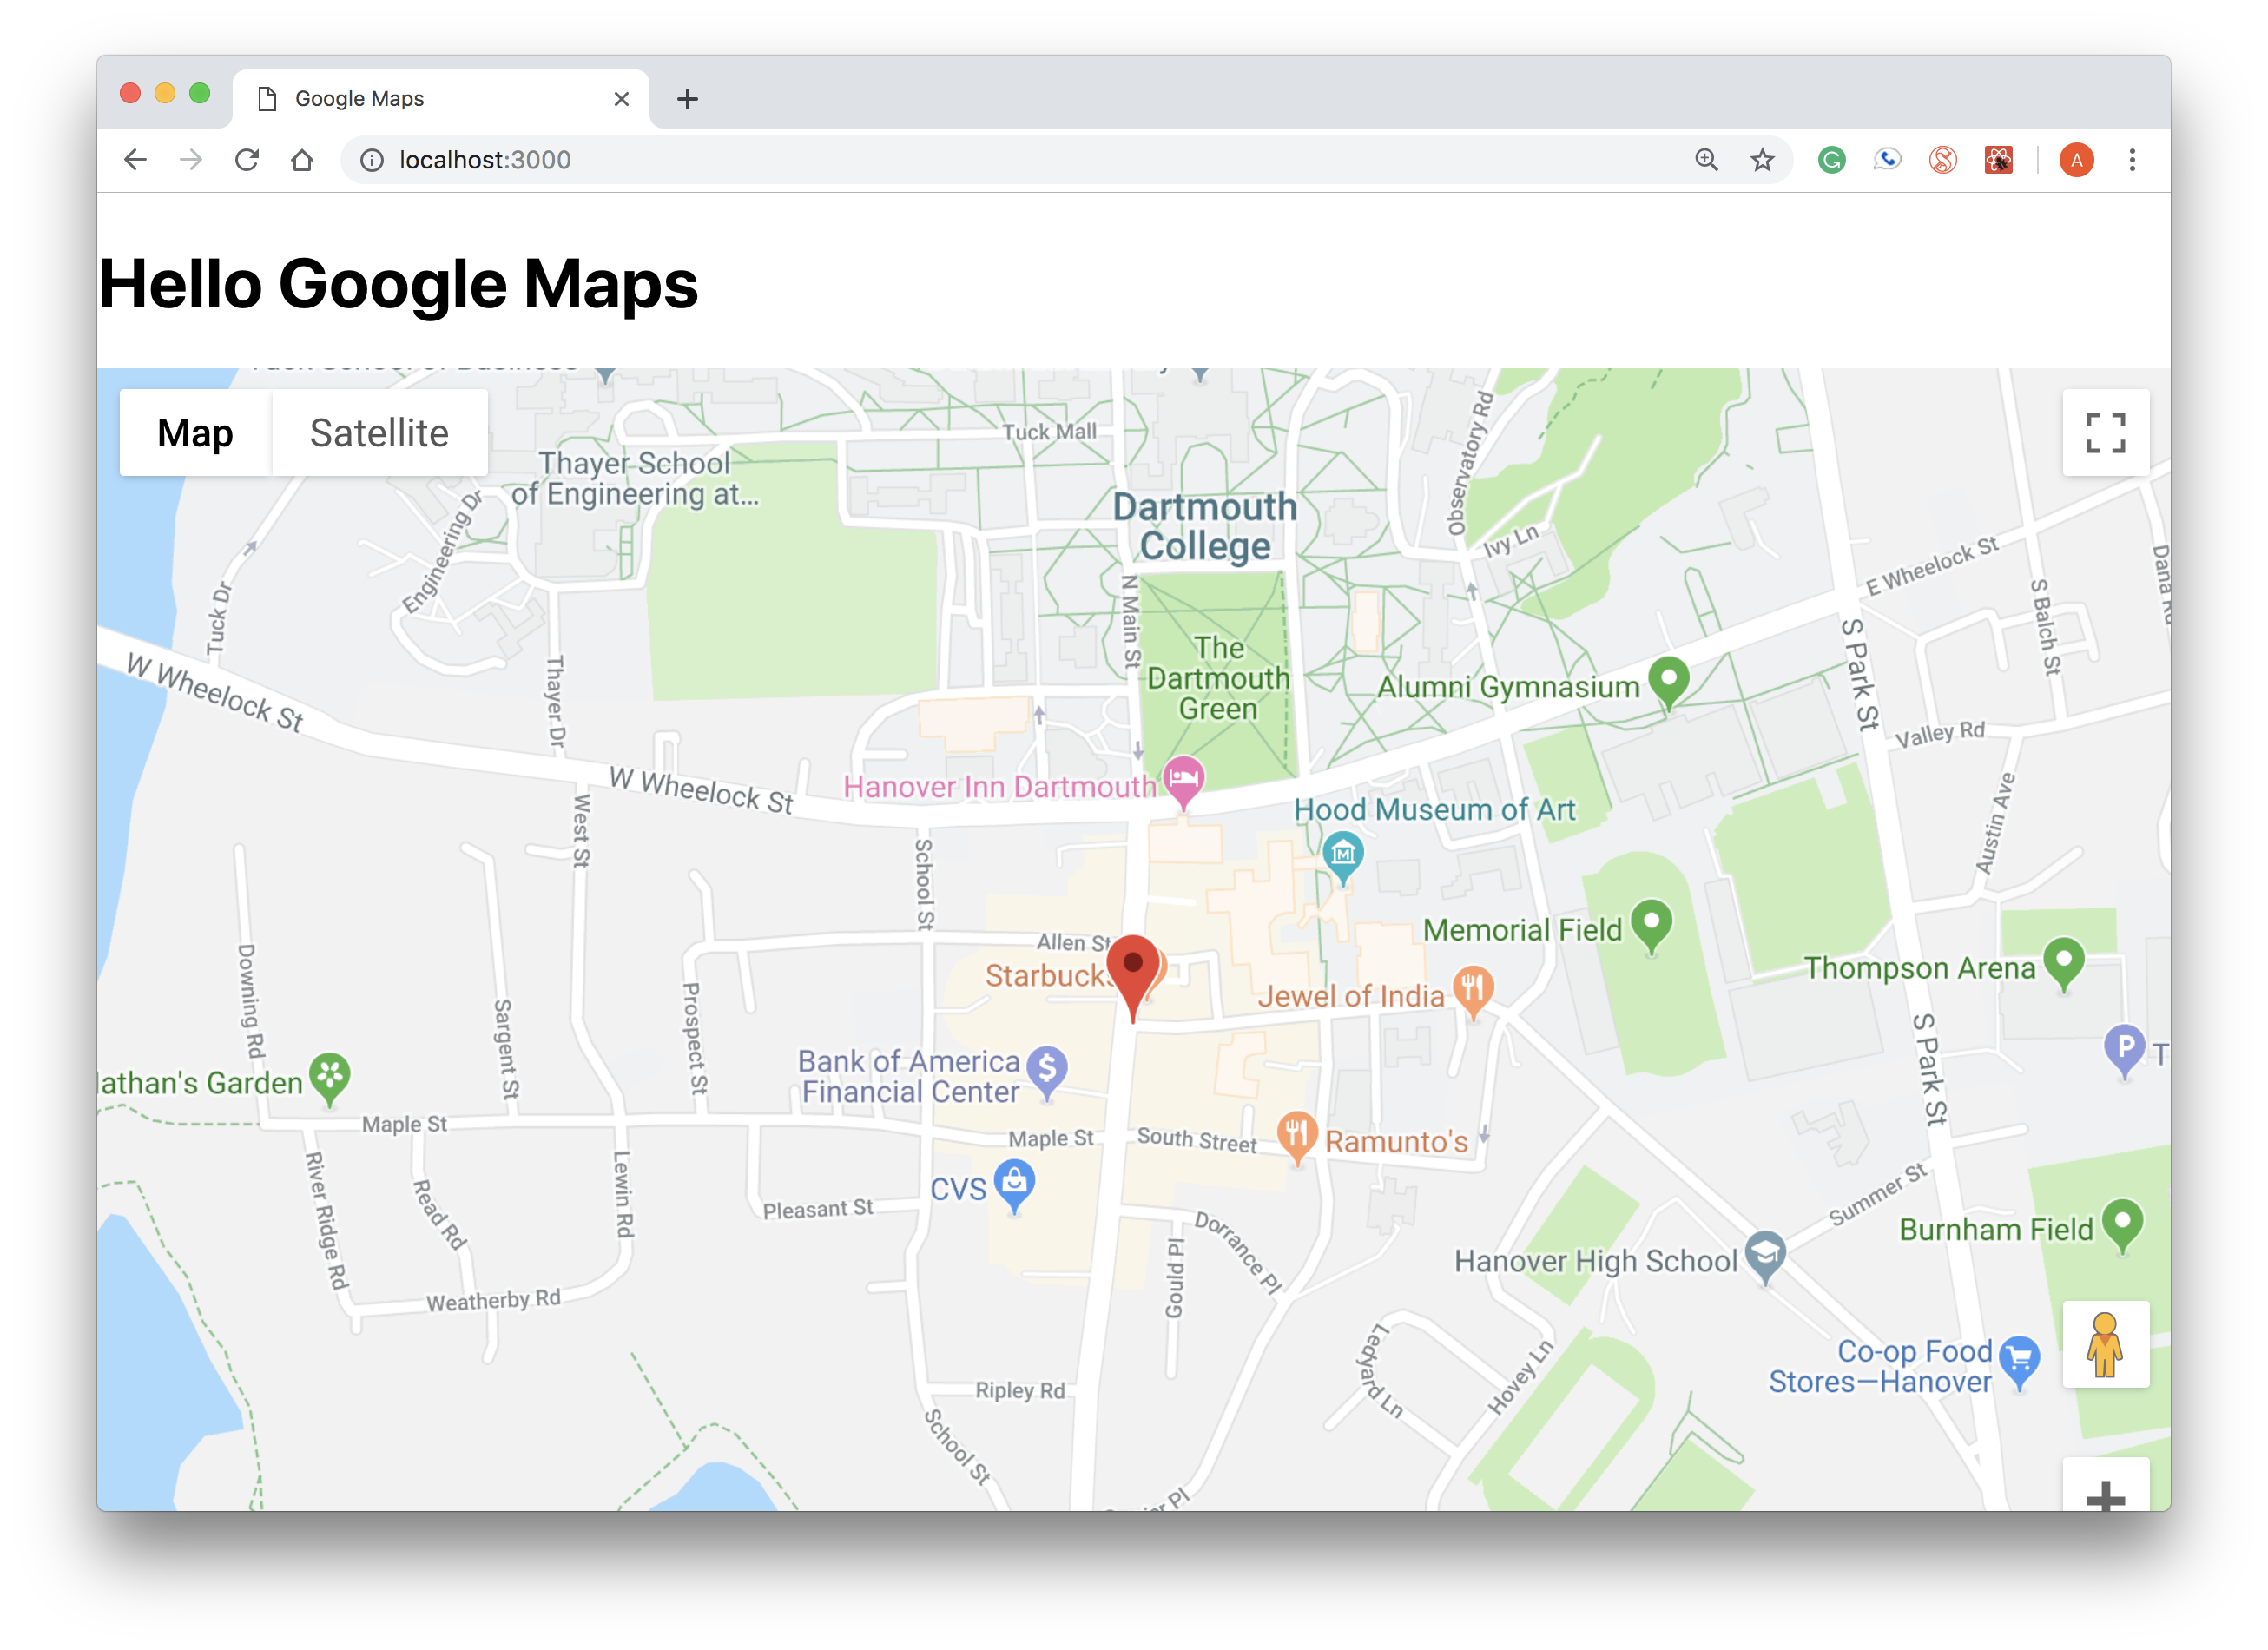
You should see something like the picture below. The marker will drop automatically in the center of the map, but we can change this.
To your Marker tag, you can pass the Marker component the following:
position={{lat: YOUR LAT, lng: YOUR LONG}}We're going to challenge you to find your own coordinates with the site https://www.latlong.net/. Keep in mind that we're centered at Dartmouth right now!
Now, let's make it clickable with an InfoWindow that'll open up and give us a description of our marker. Let's add an InfoWindow component. This will also be a child of the Map component.
After the Marker component, add
<InfoWindow>
</InfoWindow>
It's empty 😱 Don't worry we'll add some event handlers that'll make it functional!
Before we start, we need to add State to our component. Before, it didn't really have to keep track of anything, but now we need State to keep track of whether a marker is clicked.
To do this, let's add a constructor and some state. Above your render function, add the code:
constructor(props) {
    super(props);
    this.state = {
        showingInfoWindow: false, //Hides or the shows the infoWindow
        activeMarker: {}, //Shows the active marker upon click
        selectedPlace: {} //Shows the infoWindow to the selected place upon a marker
    };
}
We are keeping track of three things: showInfoWindow which is a boolean that will tell the component whether to render the infowindow or not, depending on if the marker is clicked, activeMarker which will keep track of the markers that are currently clicked and selectedPlace which will show the infowindow of the selected marker.
Try clicking on the marker. It doesn't do anything! That's because we need to add event handlers to actually modify its state. We're going to need two event handlers, one to open the InfoWindow window when you click the marker, and one to close the InfoWindow when you click the close button.
Underneath your constructor, add the event handler:
onMarkerClick = (props, marker, e) =>
  this.setState({
    selectedPlace: props,
    activeMarker: marker,
    showingInfoWindow: true
});
When the marker is clicked, this will change the state and activate the marker: the info window will pop up! You also need to add an onClick handler your Marker component. Add the code below to your Marker tag.
onClick={this.onMarkerClick}Uh oh! It still doesn't do anything when you click it. That's because we don't have an info window. Let's fix that. First let's add some content to our InfoWindow component. We need to connect our InfoWindow to our marker. In order to do this, we pass our InfoWindow component the following:
marker={this.state.activeMarker}
visible={this.state.showingInfoWindow}
This gives the InfoWindow component the active markers name and tells it to show up!
In between the InfoWindow tags, add the code below to give it some content.
<div>
    <h2>{this.state.selectedPlace.name}</h2>
</div>
YAY! Let's close it and go home, right? Wait, what did the marker say again? Oh no. We can't reopen the textbox! But, why? Why isn't this working? Well, thank you for asking, young grasshopper. It's because we don't have an onClose handler. In the InfoWindow tag, add the following code under the marker and visible variables:
onClose={this.onClose}Again, we need to actually define the onClose function below the constructor to make this work:
onClose = props => {
    if (this.state.showingInfoWindow) {
        this.setState({
        showingInfoWindow: false,
        activeMarker: null
        });
    }
};
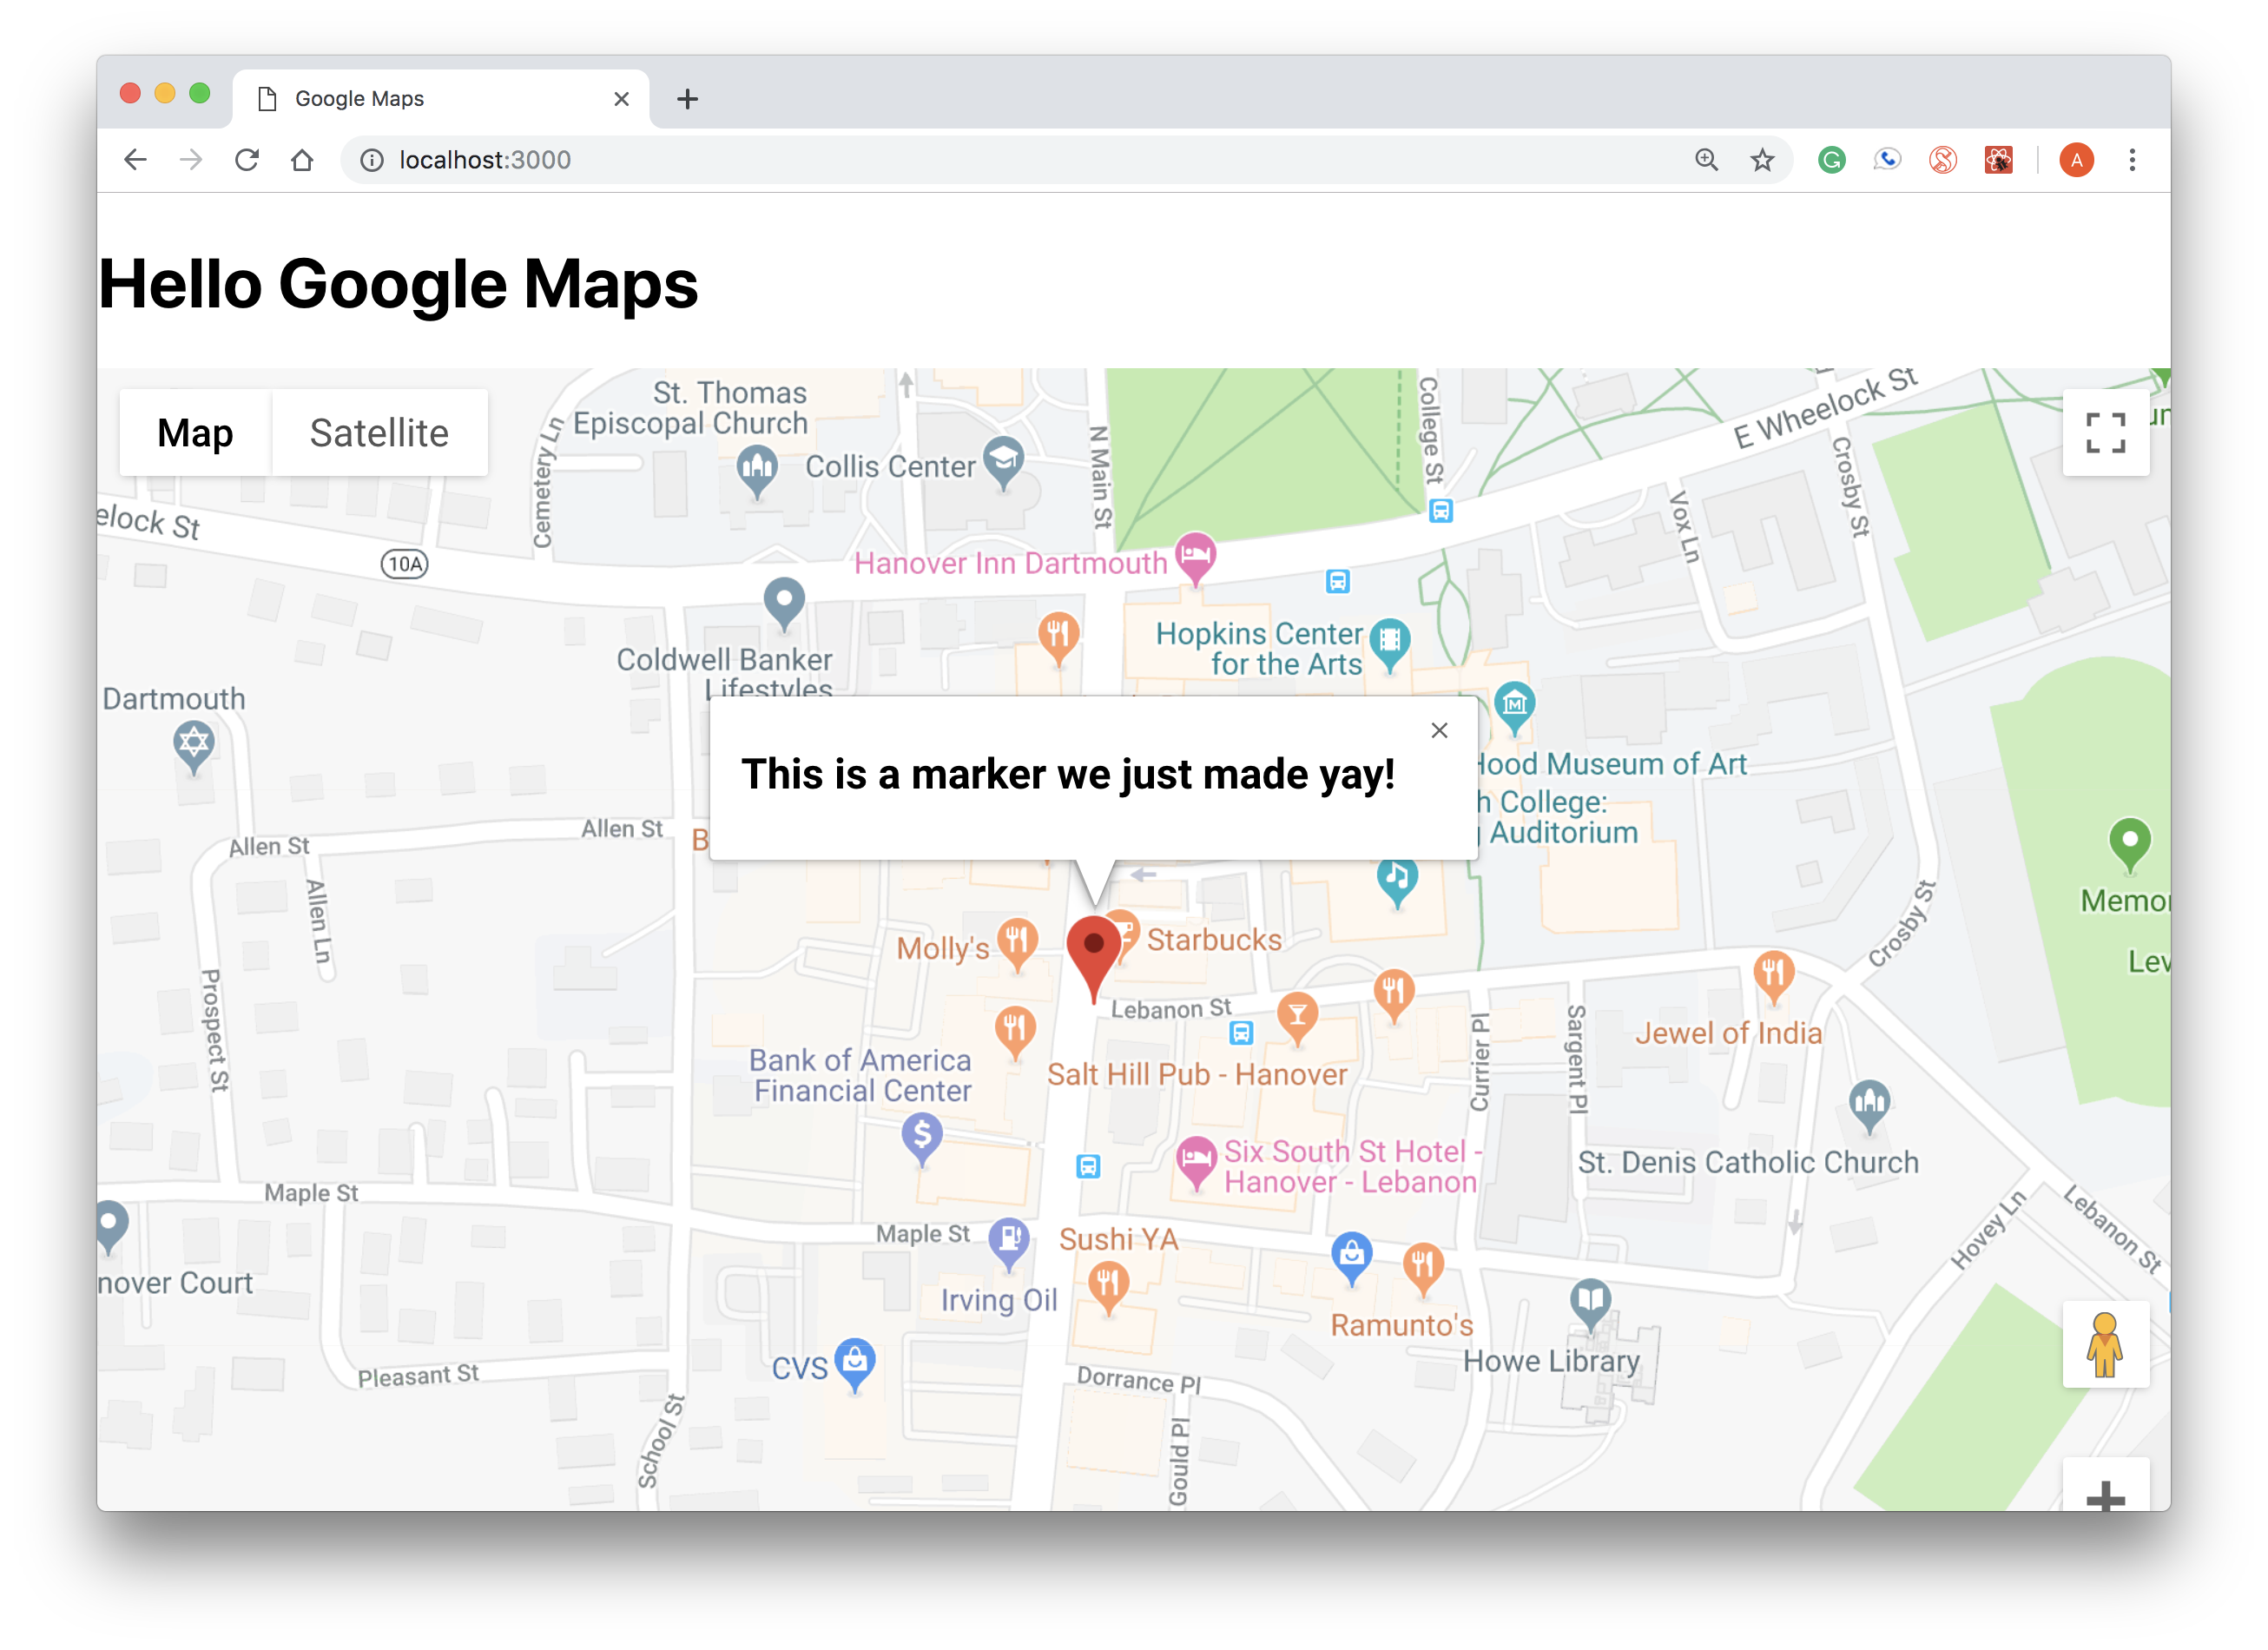
Woohoo! 💃 Now you should see something like this and be able to open and close it as many times as you want! Sick. Can you figure out how to change what's inside the Marker? Make it your own!
Try adding in another marker within the bounds of your map with your own latitude and longitude (again using https://www.latlong.net/)!
Now we have a map with a marker. Heck yah. Let's add a little spicy data to make our map interesting. Before we add a shape, whose edges are the data points we're about to define, we need to get that set of data. Below is the one we used, but feel free to go to https://www.latlong.net/ and chose your own points! Just remember, the first and the last point have to be the same, so the shape comes full circle.
At the top of your render function, add:
const triangleCoords = [
    {lat: 43.7046, lng: -72.2943},
    {lat: 43.7034, lng: -72.2886},
    {lat: 43.7091, lng: -72.2839},
    {lat: 43.7046, lng: -72.2943}
];
Can you see guess points we chose? It's pretty hard so let's actually map them.
In this library, Polygons is the component we'll use to construct our shapes. You know the drill, we have to import it. Add Polygons to the list of components you've already imported.
Now let's add our Polygon component. It'll be another child of Map so make sure to put it between the Map tags. We can add it under the InfoWindow tags.
Under InfoWindow add the code:
<Polygon
    paths={triangleCoords}
    strokeColor="#0000FF"
    strokeOpacity={0.8}
    strokeWeight={2}
    fillColor="#0000FF"
    fillOpacity={0.35}
/>
WOAH! What is all that stuff? paths lets the polygon know which points we want to trace. The rest of the props will style our component. Feel free to switch these up however you want!
Look at your page! You should see something like this:
You just made your own React App that includes the Google Maps API with some cool customization and data visualization. Okay a triangle's cool but why do we care? This lays the groundwork for doing things like overlaying traffic onto your map, searching for directions and implementing other functionalities of Google Maps that might come in handy when you need them!
Because of our starter, we're going to have to deploy in a bit of a different way. You should be in the root directory of your project, workshop-ws-04-23-maps. First let's do
yarn add surge
Next run
yarn run build
This creates a build folder, which contains all the production code you need to deploy your project. Then, cd into the build directory.
Now, just run surge! And you're done!
- Can we make something more complex than a triangle? Let's add some more points into our data set. Add some more points into
triangleCords.
triangleCords works with the order of your coordinates)
{lat: 43.7074, lng: -72.2911}, //choates
{lat: 43.7066, lng: -72.2968}, //ledyard
{lat: 43.7030, lng: -72.2841}, //gym-
Feel free to find the latitude and longitude of somewhere else and put that in if you want! This website makes it easy to find those values https://www.latlong.net/ Then, you can create your own shape within the new location you chose.
-
Style your map! Change the styling in
Polygonto make it your own!
What your site has:
- A map, that is centered around a certain point and zoomed in to a level you like
- At least one marker of a point of your choosing, with a custom info window
- Event handlers that enable you to click on your marker and see your info window
- A shape whose points are those you selected that is overlayed on the map
Extra Credit A more complicated polygon, your graph centers around somewhere that isn't Dartmouth and/or style your map to make it your own 😎
What you learned:
- What an API is and what map APIs are capable of
- The pros and cons of the different map API options (Leaflet, Mapbox, Google Maps)
- Adding a map to your React app and customizing the location, zoom and markers
- Leveraging a data set to produce cool data visualizations with the Google Maps API
💡 Remember to submit these on canvas!
- Why are we using google react maps instead of the original library written by Google? What are the benefits?
- Can you think of any instances where you would use a map API in a web or mobile app? For one of those examples, which API (Leaflet, Mapbox, Google Maps) would you choose and why?
- https://developers.google.com/maps/documentation/
- https://trends.builtwith.com/websitelist/Google-Maps-API
- https://www.datanyze.com/market-share/mapping-and-gis/United%20States/google-maps-api-market-share
- https://jungleworks.com/google-vs-mapbox/
- https://leafletjs.com/
- https://www.mapbox.com/
- https://www.fullstackreact.com/articles/how-to-write-a-google-maps-react-component/#the-map-container-component
- https://medium.freecodecamp.org/what-is-an-api-in-english-please-b880a3214a82
- https://scotch.io/tutorials/react-apps-with-the-google-maps-api-and-google-maps-react
https://docs.google.com/presentation/d/1kFYbvW4CdcYt7os8FXeKOqM1Vs_y9IbsqyPxfru8Y6E/edit?usp=sharing

