To visualize tree in demo_client.py go here
$ python3 demo_client.py 1 1

digraph {
    node [rx=5 ry=5 labelStyle="font: 300 14px 'Helvetica Neue', Helvetica"]
    edge [labelStyle="font: 300 14px 'Helvetica Neue', Helvetica"]

	1 [label="A : 1" style="fill: #ffffff"];
	2 [label="X : 2" style="fill: #ffffff"];
	3 [label="H : 3" style="fill: #ffffff"];
	4 [label="G : 4" style="fill: #B073A1"];
	5 [label="E : 5" style="fill: #849BC0"];
	6 [label="G : 6" style="fill: #B073A1"];
	7 [label="E : 7" style="fill: #ffffff"];
	8 [label="H : 8" style="fill: #B3A582"];
	9 [label="A : 9" style="fill: #606EB3"];
	10 [label="B : 10" style="fill: #6C68C8"];
	11 [label="C : 11" style="fill: #9559B1"];
	12 [label="H : 12" style="fill: #B3A582"];
	13 [label="A : 13" style="fill: #606EB3"];
	14 [label="C : 14" style="fill: #9559B1"];
	15 [label="B : 15" style="fill: #6C68C8"];
	16 [label="E : 16" style="fill: #849BC0"];
	17 [label="E : 17" style="fill: #ACA062"];
	18 [label="E : 18" style="fill: #849BC0"];
	19 [label="E : 19" style="fill: #ACA062"];
	20 [label="A : 20" style="fill: #606EB3"];
	21 [label="B : 21" style="fill: #6C68C8"];
	22 [label="C : 22" style="fill: #9559B1"];
	23 [label="A : 23" style="fill: #606EB3"];
	24 [label="B : 24" style="fill: #6C68C8"];
	25 [label="C : 25" style="fill: #9559B1"];
	26 [label="D : 26" style="fill: #91D16E"];
	27 [label="A : 27" style="fill: #606EB3"];
	28 [label="B : 28" style="fill: #6C68C8"];
	29 [label="C : 29" style="fill: #9559B1"];
	30 [label="A : 30" style="fill: #606EB3"];
	31 [label="B : 31" style="fill: #6C68C8"];
	32 [label="C : 32" style="fill: #9559B1"];
	33 [label="D : 33" style="fill: #91D16E"];
	1 -> 2;
	1 -> 3;
	1 -> 4;
	3 -> 5;
	3 -> 6;
	3 -> 7;
	4 -> 8;
	5 -> 9;
	5 -> 10;
	5 -> 11;
	6 -> 12;
	7 -> 13;
	7 -> 14;
	7 -> 15;
	8 -> 16;
	8 -> 17;
	12 -> 18;
	12 -> 19;
	16 -> 20;
	16 -> 21;
	16 -> 22;
	17 -> 23;
	17 -> 24;
	17 -> 25;
	17 -> 26;
	18 -> 27;
	18 -> 28;
	18 -> 29;
	19 -> 30;
	19 -> 31;
	19 -> 32;
	19 -> 33;
}
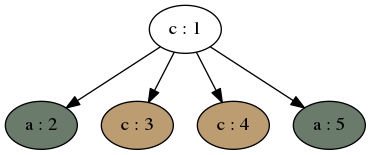
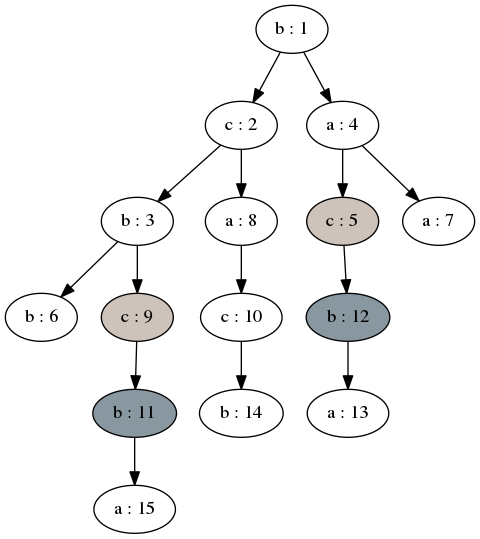
Nodes with the same color are duplicates.
$ python3 random_tree_demo.py -h
usage: random_tree_demo.py [-h] [-c] [--minh MINHEIGHT] [--maxh MAXHEIGHT]
                           [--maxb MAXBREADTH] [--ent ENTROPY] [--nohtml] [-v]
                           N

Demo tree generator

positional arguments:
  N                  number of nodes in generated tree

optional arguments:
  -h, --help         show this help message and exit
  -c, --compvals     compare values while colorizing tree
  --minh MINHEIGHT   min height of tree to be compared, default 1
  --maxh MAXHEIGHT   max height for each node (except root), default N
  --maxb MAXBREADTH  max number of childs for each node, default N
  --ent ENTROPY      dataset size. Default dataset is ascii letters. If
                     expected dataset size is bigger then ascii letters set
                     then it is extended with D_{n} where n is int
  --nohtml           if provided generates graphviz compatible serialization
  -v, --verbose      print to stderr time required to serialize tree (tree
                     generation step excluded)
Note: delete --nohtml flag from commands bellow and copy-paste output here to visualize generated graphs, or install graphviz to vizualize graph locally
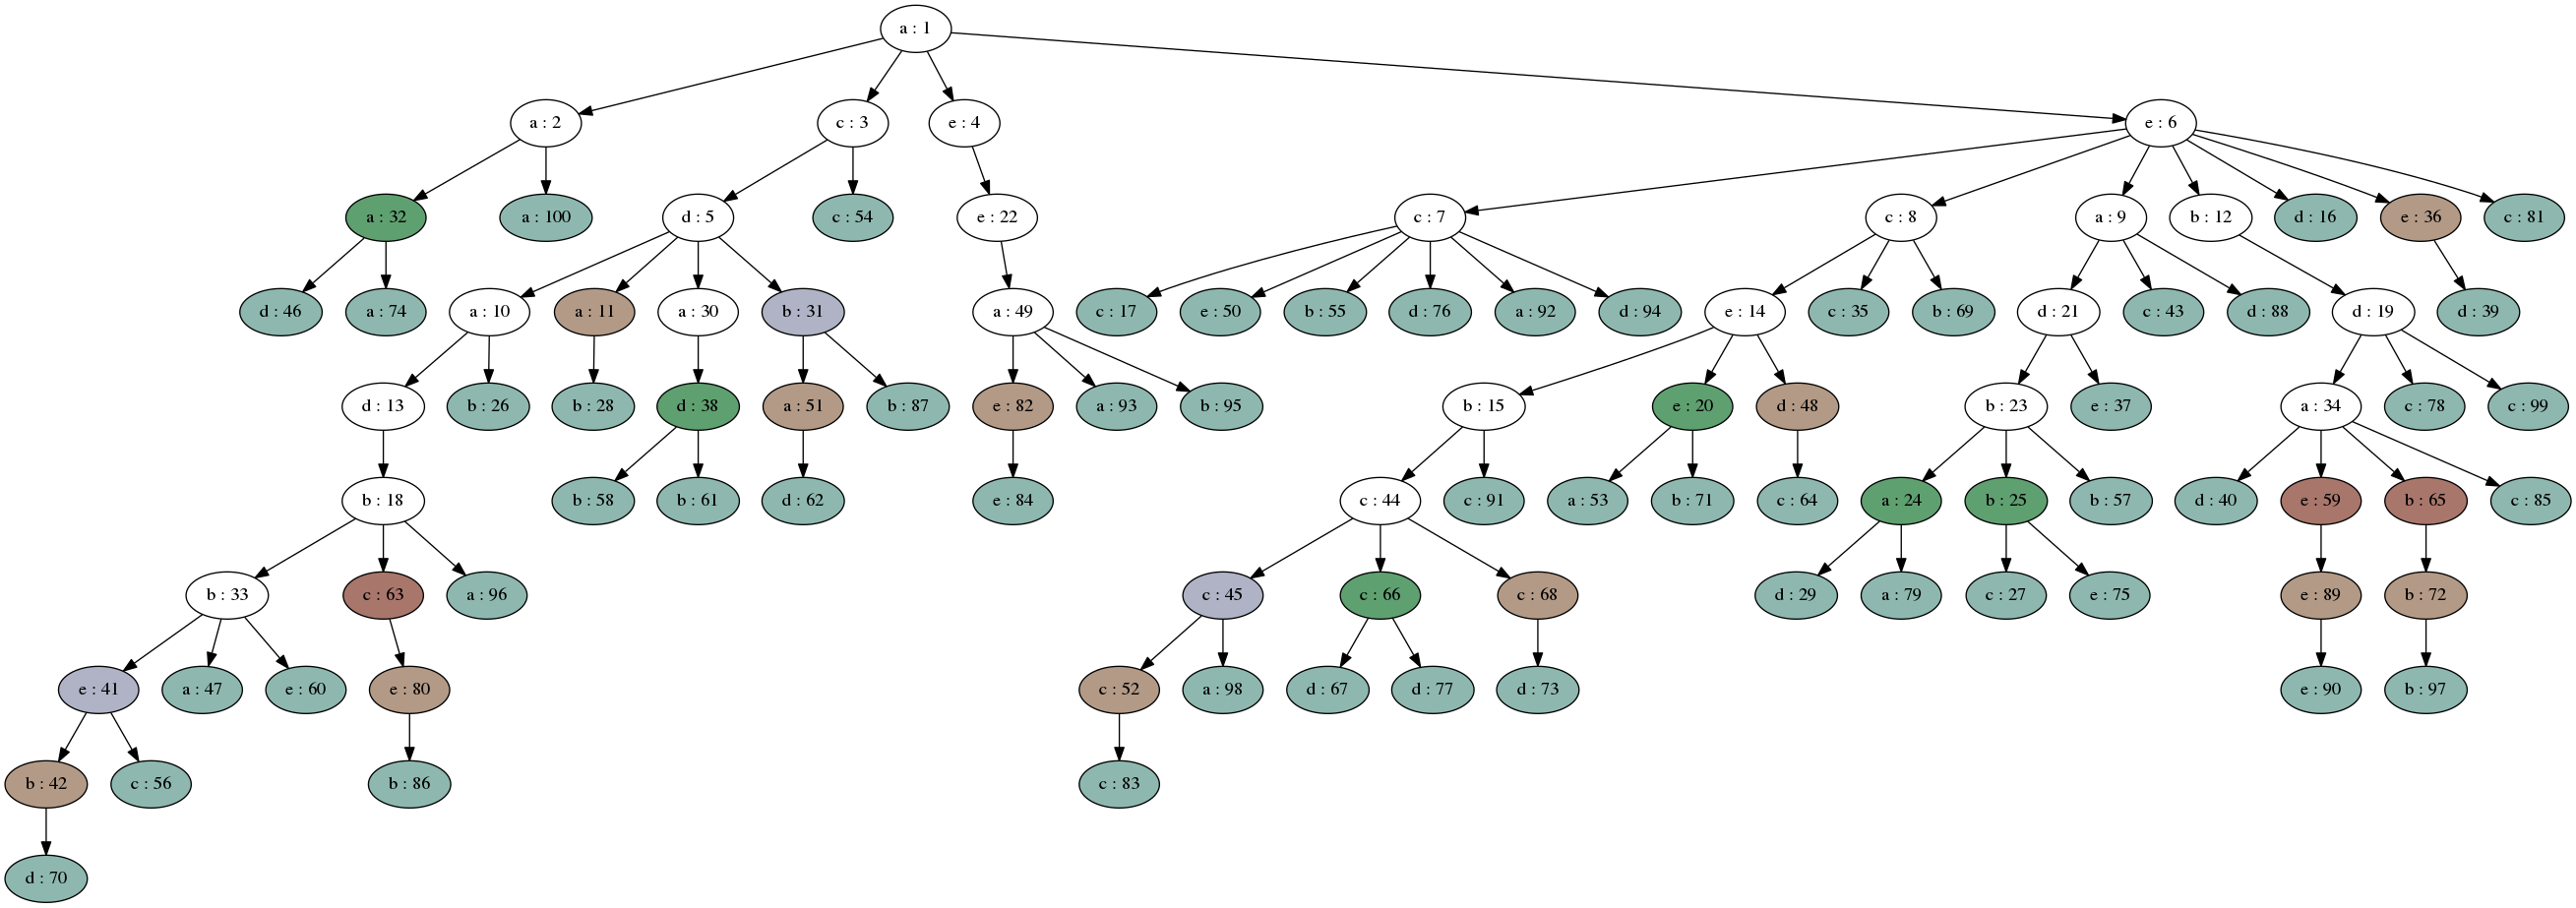
$ python3 random_tree_demo.py 100 -v --nohtml | dot -Tpng -o rendered/example1.png
0.001024007797241211
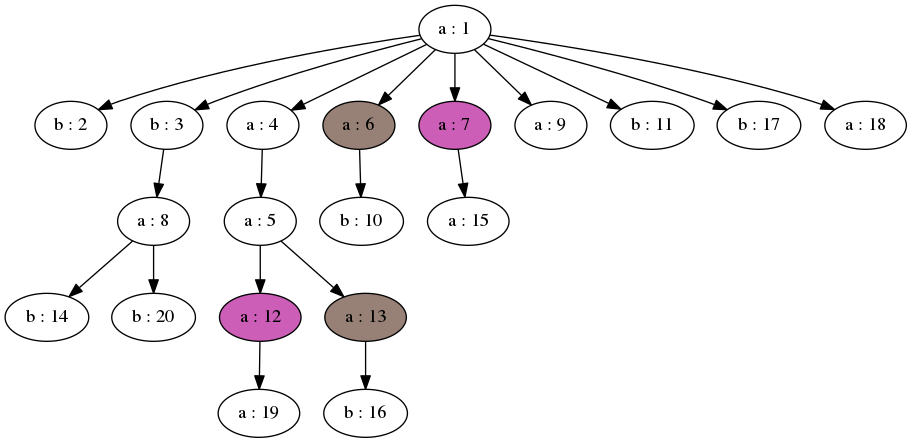
$ python3 random_tree_demo.py 20 -v --compvals --ent 3 --nohtml | dot -Tpng -o rendered/example2.png
0.00048041343688964844
$ python3 random_tree_demo.py 20 -v --compvals --ent 2 --minh 2 --nohtml | dot -Tpng -o rendered/example3.png
0.0003173351287841797
# flat tree
$ python3 random_tree_demo.py 5 -v --compvals --ent 3 --minh 1 --maxh 1 --nohtml | dot -Tpng -o rendered/example4.png
0.00017189979553222656
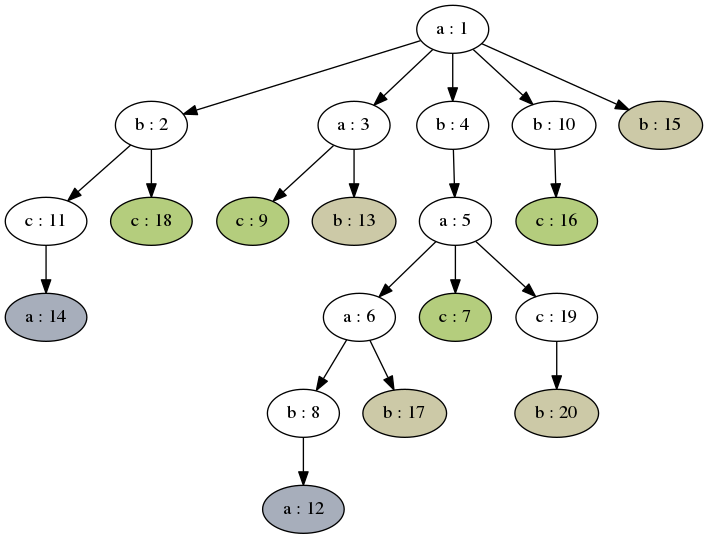
# bin tree
$ python3 random_tree_demo.py 15 -v --compvals --ent 3 --minh 2 --maxb 2 --nohtml | dot -Tpng -o rendered/example5.png
0.00027060508728027344
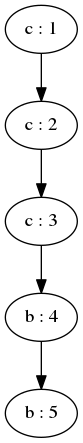
# linked list
$ python3 random_tree_demo.py 5 -v --compvals --ent 3 --minh 2 --maxb 1 --nohtml | dot -Tpng -o rendered/example6.png
0.0001900196075439453