This is a simple benchmarking test comparing performance of Node.js and nginx.
Disclaimer These are some preliminary tests I have conducted on a weekend. I still have to prepare a more thorough test series that takes into account more real-world scenarios.
The test clearly shows that putting nginx in front of a Node.JS (or Meteor) application greatly increases response times for initial requests to the root path and static assets.
However, Node.JS performs much better for serving a single image than for serving the root path.
Naturally, having a multi-core system where nginx can take advantage of all cores will bring better results compared to Meteor which runs on a single core by default.
Two servers:
- meteor
- comet
Meteor runs Node.js, MongoDB, and nginx. Comet acts as a client. These tests have been conducted on a single core, single processor machine. Here are the results with 2 cores (all other specs remain).
Deployment via mup, all requests go directly to Meteor at http://meteor:3000
Use the configuration for nginx as a proxy. Nginx forwards all requests to the upstream Node.JS server at Port 3000.
Similar to setup 2 - proxy all requests to / to Port 3000 (Node.JS), but all requests for CSS, JS, and images are served by Nginx directly.
Similar to the tests before, only this time ab requests an image (100k jpg file). Served from Node.js.
Serving the image from Nginx, with a configuration to pass requests to Node.JS.
Added static files as locations to Nginx config, serving from Nginx rather than Node.JS.
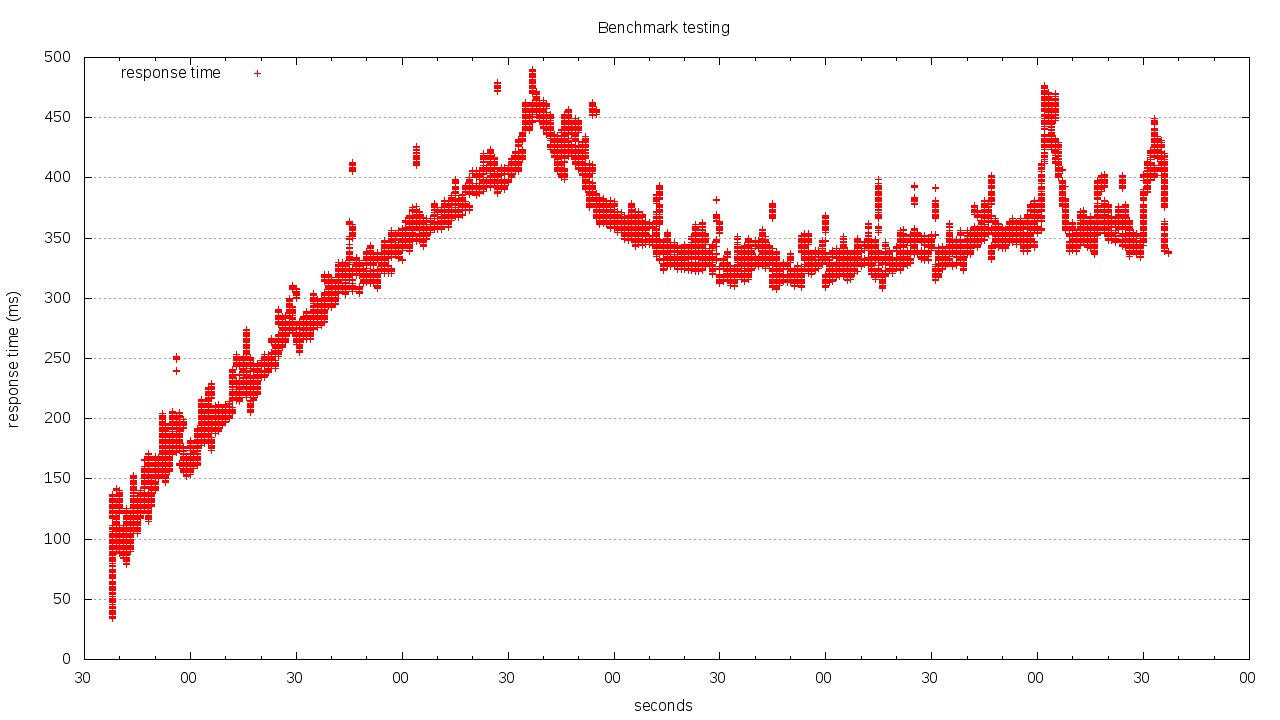
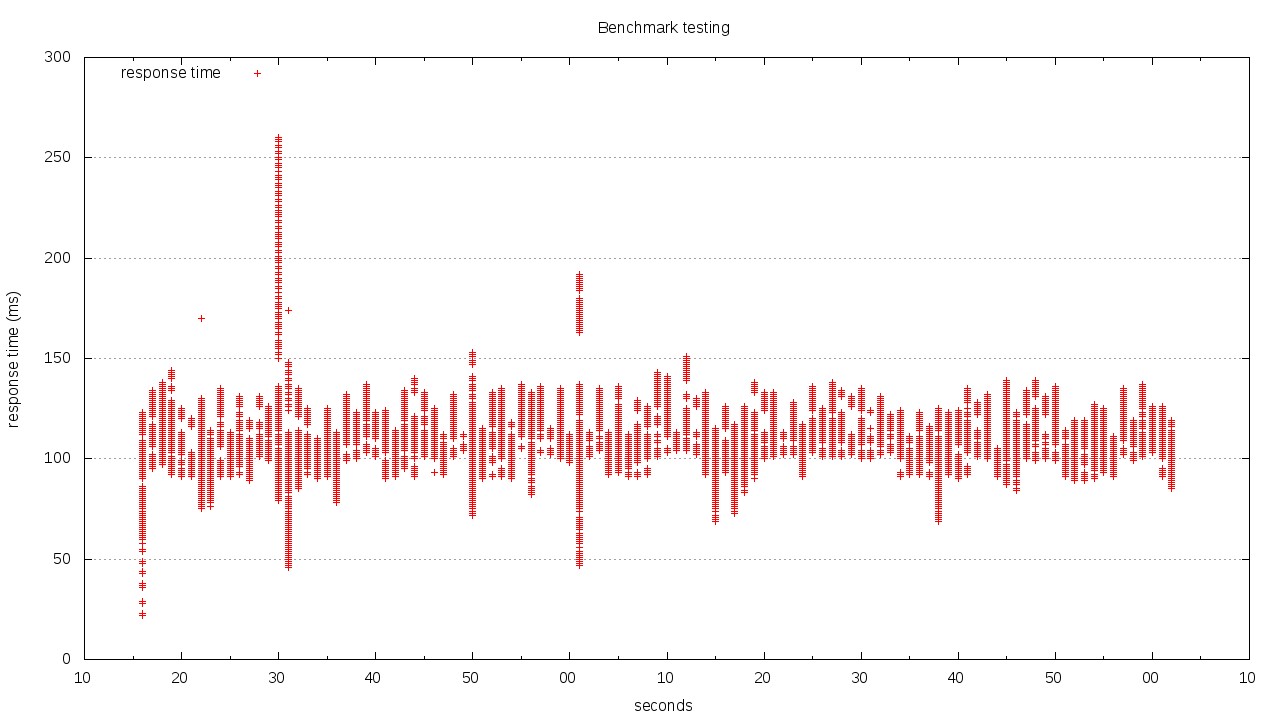
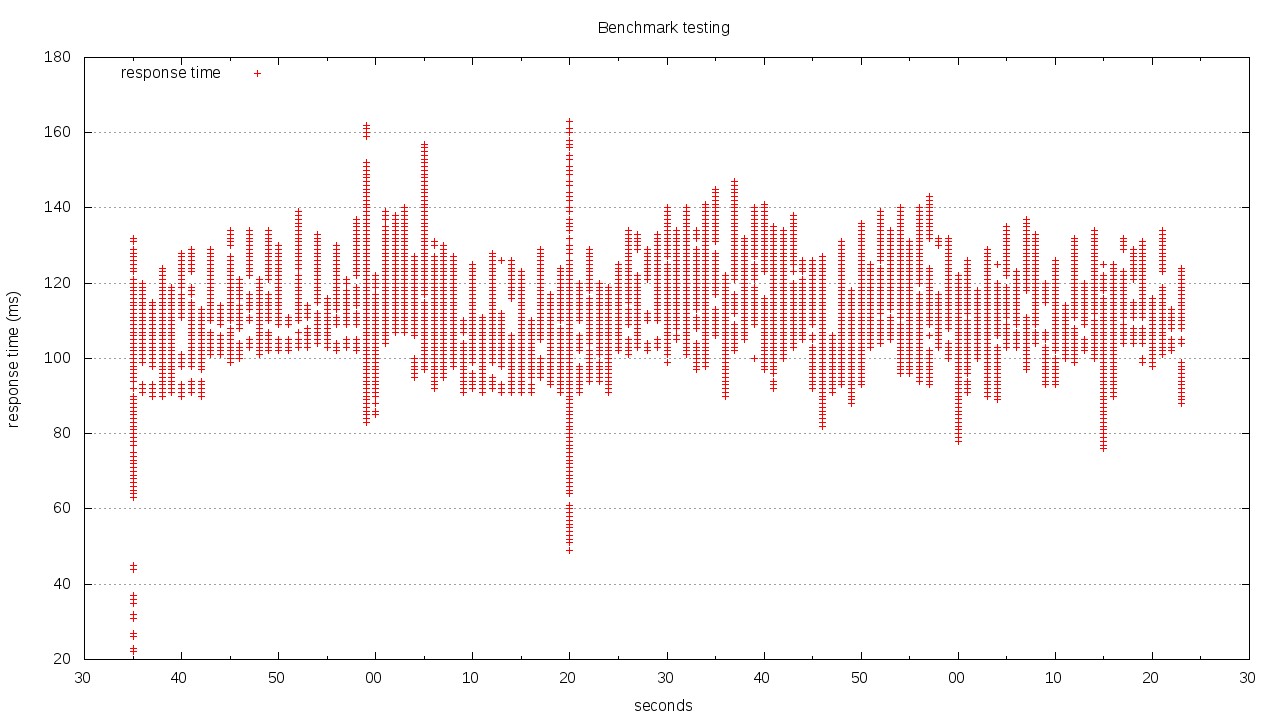
Requesting the root path using Apache Bench (ab) with
ab -n100000 -c100 -g plotdata.tsv http://meteor/
| Result | Node.JS | Nginx (just proxy) | Nginx (serving static assets) |
|---|---|---|---|
| Requests | 100000 | 100000 | 100000 |
| Time taken (s) | 299.050 | 106.313 | 108.380 |
| Requests per second | 334.39 | 940.62 | 922.68 |
| Time per request (ms) (mean, across all concurrent requests) | 2.991 | 1.063 | 1.084 |
| Transfer rate (Kbytes/sec) | 269.41 | 806.51 | 791.12 |
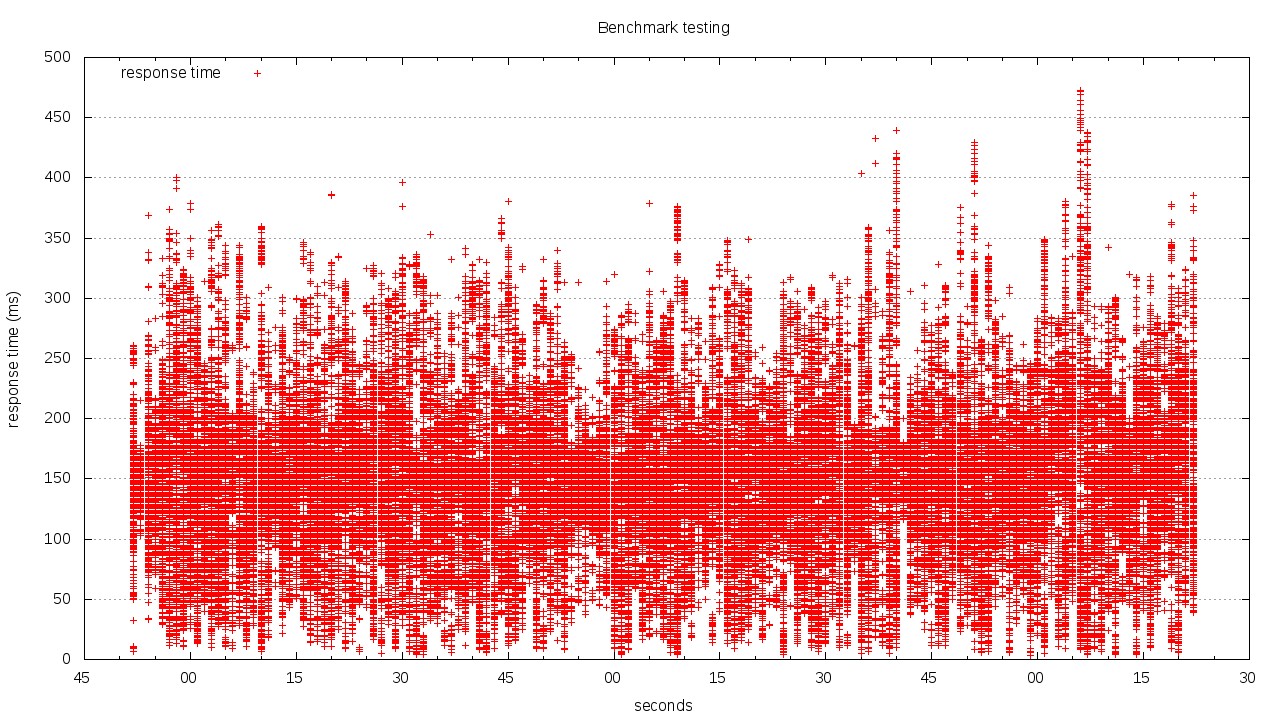
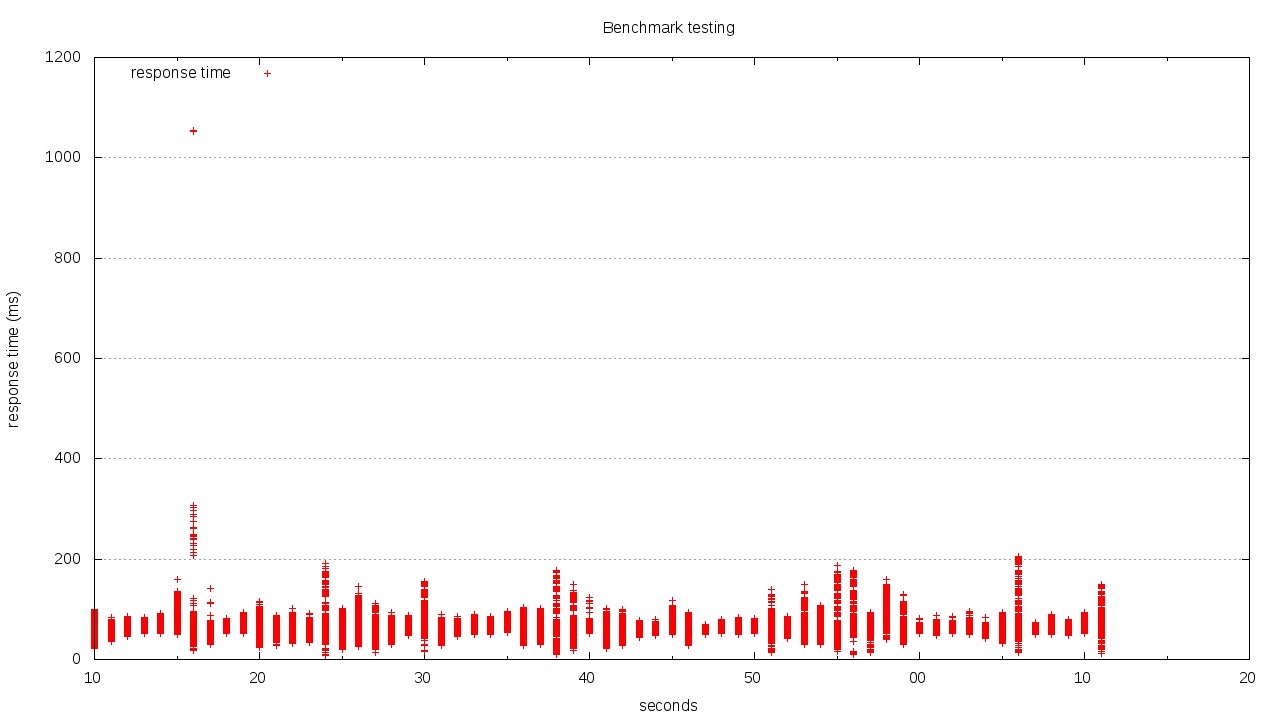
Apache Bench Results | Raw Timeseries Data
Apache Bench Results | Raw Timeseries Data
Apache Bench Results | Raw Timeseries Data
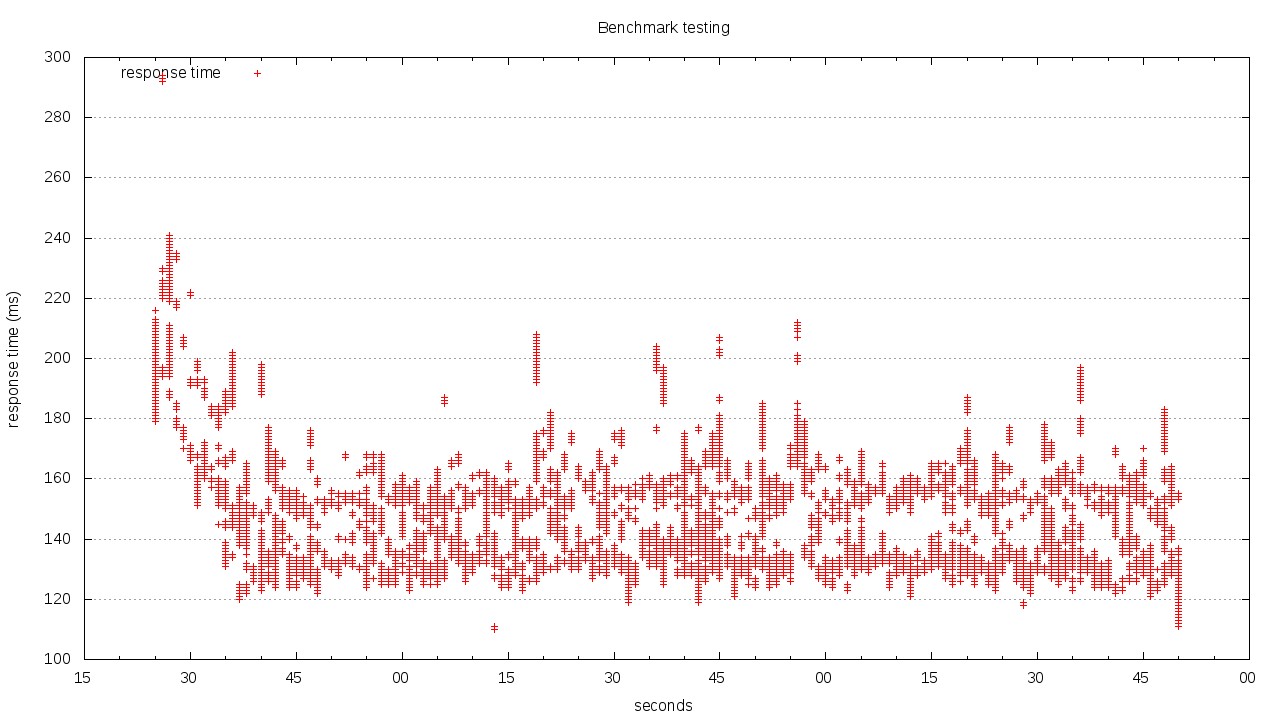
Requesting an image (100018 bytes) with
ab -n100000 -c100 -g plotdata.tsv http://meteor/image.jpg
| Result | Node.JS | Nginx (just proxy) | Nginx (serving static assets) |
|---|---|---|---|
| Requests | 100000 | 100000 | 100000 |
| Time taken (s) | 144.642 | 150.812 | 61.633 |
| Requests per second | 691.36 | 663.08 | 1622.52 |
| Time per request (ms) (mean, across all concurrent requests) | 1.446 | 1.508 | 0.616 |
| Transfer rate (Kbytes/sec) | 67719.94 | 64968.57 | 159044.71 |
Apache Bench Results | Raw Timeseries Data
Apache Bench Results | Raw Timeseries Data
| Result | 1a) Node.js (/) | 2a) Node.js (image.jpg) | 1b) Nginx (/, proxy) | 2b) Nginx (image.jpg, proxy) | 3a) Nginx (/, optimized) | 3b) Nginx (image.jpg, optimized) |
|---|---|---|---|---|---|---|
| Time for test | 299 | 145 | 106 | 151 | 108 | 62 |
| Reqs/s | 334 | 691 | 940 | 663 | 923 | 1623 |
| Time per req (ms) | 2.991 | 1.446 | 1.063 | 1.508 | 1.084 | 0.616 |
| Conn times min (ms) | 33 | 110 | 21 | 3 | 22 | 7 |
| Conn times mean (ms) | 299 | 145 | 106 | 151 | 108 | 62 |
| Conn times max (ms) | 490 | 294 | 260 | 473 | 163 | 1055 |
Percentage of reqs served in certain time
| Result | 1a) Node.js (/) | 2a) Node.js (image.jpg) | 1b) Nginx (/, proxy) | 2b) Nginx (image.jpg, proxy) | 3a) Nginx (/, optimized) | 3b) Nginx (image.jpg, optimized) |
|---|---|---|---|---|---|---|
| 50% | 331 | 139 | 105 | 149 | 107 | 60 |
| 66% | 346 | 151 | 110 | 167 | 111 | 63 |
| 75% | 357 | 154 | 112 | 181 | 114 | 66 |
| 80% | 364 | 156 | 113 | 191 | 116 | 67 |
| 90% | 397 | 164 | 118 | 223 | 122 | 73 |
| 95% | 420 | 175 | 124 | 255 | 127 | 80 |
| 98% | 447 | 194 | 131 | 293 | 132 | 90 |
| 99% | 459 | 206 | 134 | 315 | 135 | 98 |
| 100% | 490 | 294 | 260 | 473 | 163 | 1055 |
Both machines are equally equipped:
- Same underlying host
- KVM machines with
- 2 GB RAM
- 1 Proc with 1 Core (virtual)
- Intel E1000 NIC (virtual)
Plotting of the graphs was done using Gnuplot with inspiration from Brad Landers. Use the gnuplot script like this:
$ gnuplot gnuPlotScript
