Simple statistics from OpenDataCam using R
In order to use the script you need to install the following packages:
install.packages("tidyverse")
install.packages("plyr")As a prerequisite, counter data generated by OpenDataCam is expected to be placed inside the /input folder. Just put the csv file(s) you downloaded from the data section on the web interface. It is possible to place multiple files into the /input folder.
The column structure in the csv file is
| Position in csv | Fieldname | Allowed values |
|---|---|---|
| 1 | frameId | int |
| 2 | Timestamp | |
| 3 | Counter ID | Name assigned to the counter (e.g. "grenze") |
| 4 | name | class of the object (e.g. "car", "truck", "person") |
| 5 | id | int |
| 6 | bearing | [0-360] Direction where the object is heading (in degree, ex: 0 degree means heading toward top of the frame, 180 towards bottom) |
| 7 | Direction | "bidirectional", "leftright_topbottom", "rightleft_bottomtop" |
| 8 | angleWithCountingLine | [0-360] |
Sample in csv:
1133,"2021-12-05T13:45:25.245Z","grenze","car",73,90.97102193107916,"rightleft_bottomtop",88.17329797295241
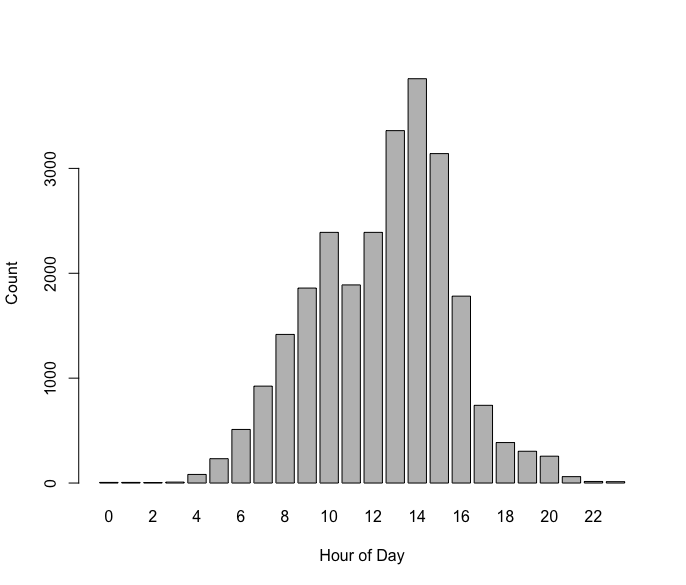
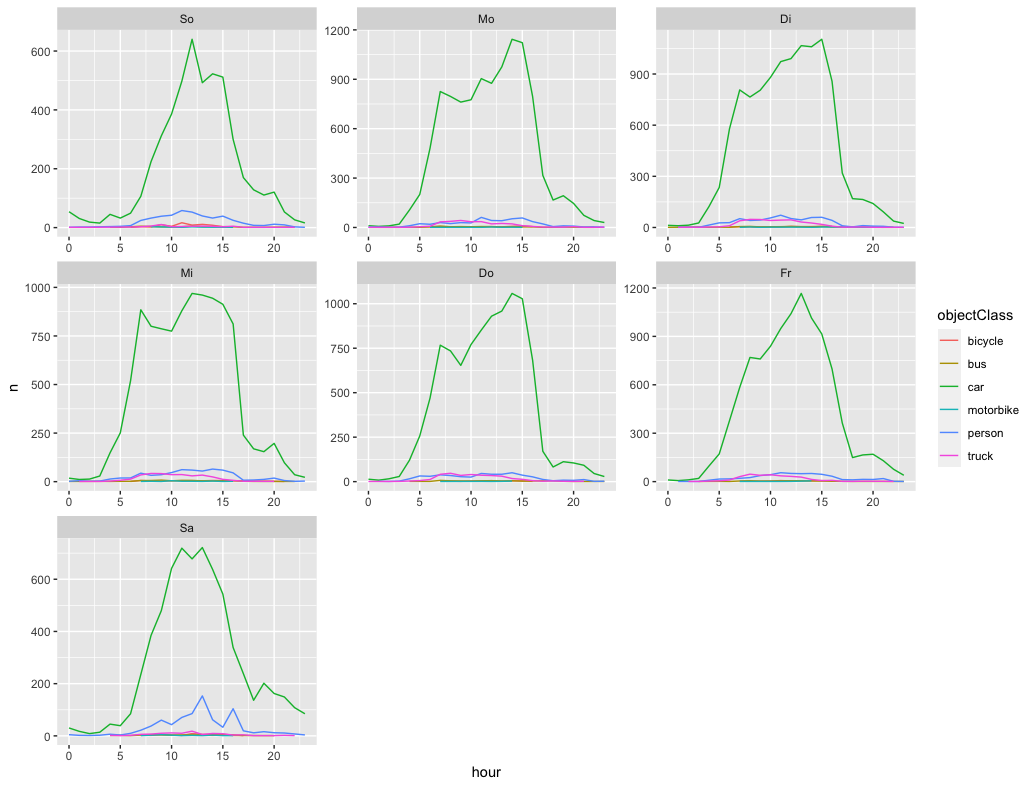
We're going to import the csv, transform (well, basically enhance) the data by adding new variables (i.e. columns), and plot the counter statistics into a pretty chart. Use the scripts/odc-process.R script file in RStudio in order to generate the csv file used for plotting.
Using scripts/odc-plot.R you can import the csv that was produced by the processing script and generate histograms for each day of the week.
If you know R and have suggestions on prettier plots and graphs, please don't hesitate and send a pull request.

