Demo: https://labs.mbed.com/simulator
While we have worked hard to improve embedded development tooling in Mbed (e.g. via the Online Compiler), the development for microcontrollers is still very similar to how it was in the 90s. Compilation is slow, and flashing is even slower. When fixing a bug, you need to get the device into the exact state as before encountering the bug. This makes for a very slow feedback loop, which hinders productivity and often pulls you out of the zone.
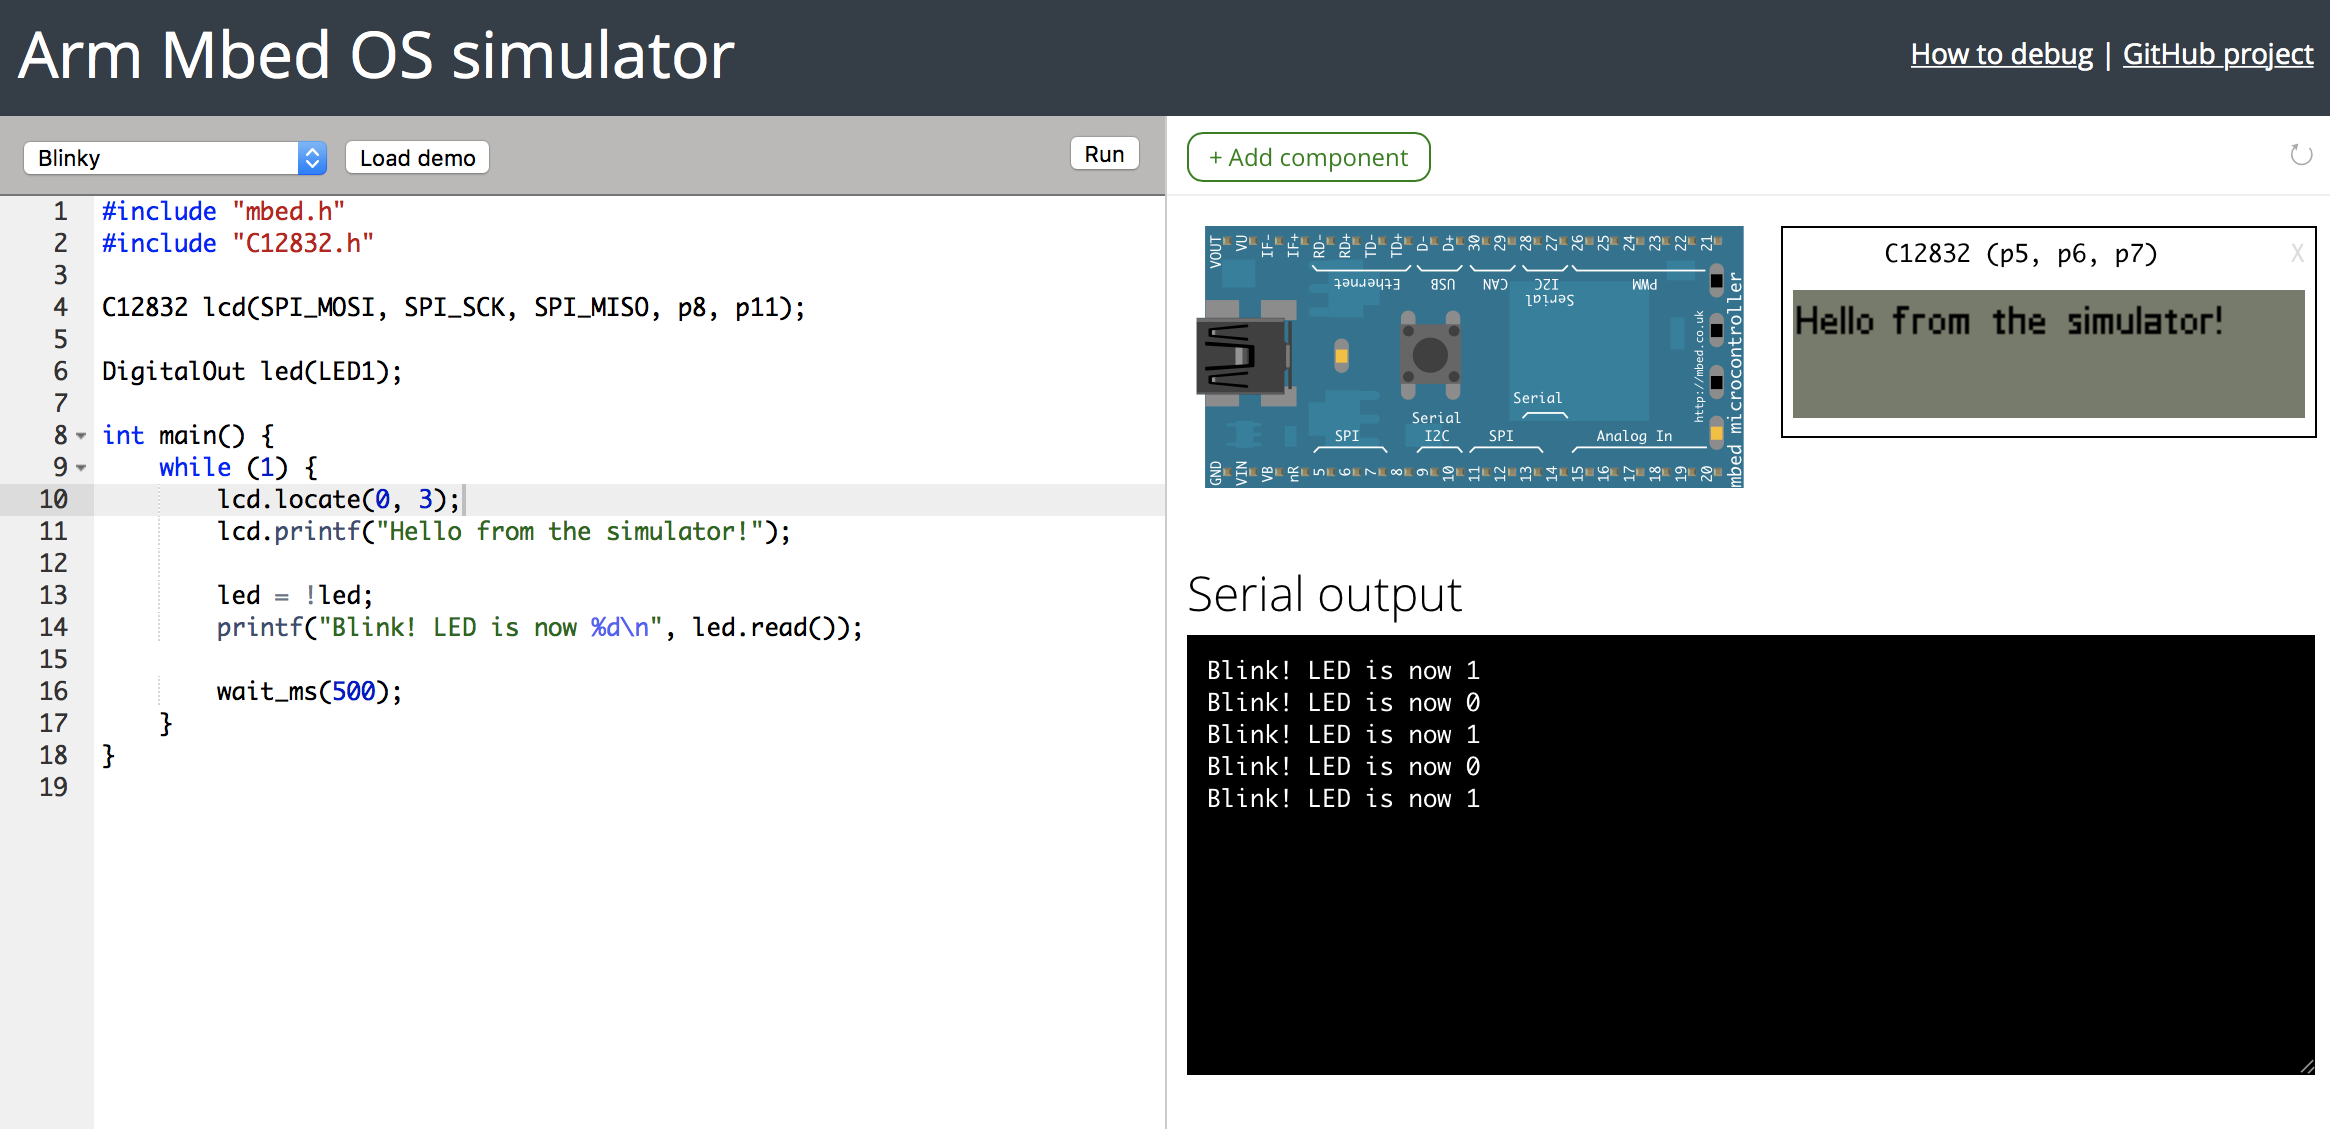
To make this feedback loop much shorter, we're releasing an alpha version of the Mbed Simulator. The simulator allows you to run your Mbed OS 5 applications directly on your computer, so that you can quickly test and verify applications without flashing them on a real board. This is a valuable learning tool, as you quickly learn how Mbed works. It is also very useful for developing complex applications. Within Arm, we have been using the simulator for work on mbed-http, the Mbed LoRaWAN stack and uTensor.
Note: The Mbed Simulator is part of Mbed Labs. The Mbed Labs projects showcase interesting side projects developed by Mbed engineers. However, these projects are not actively supported by Arm, and may be added, removed or break at any time.
More information in the introductionary blog post
The C++ HAL is in mbed-simulator-hal. This HAL uses a fork of Mbed OS 5.9.1 (living here: #mbed-os-5.9-simulator), where a new target was added (TARGET_SIMULATOR) similar to physical targets. The target handles calls coming in from the Mbed C++ HAL and passes them through to the JS HAL.
The JS HAL lives in viewer/js-hal, and dispatches events around between JS UI components and C++ HAL. It implements an event bus to let the UI subscribe to events from C++. For instance, see js-hal/gpio.js for GPIO and IRQ handling.
UI lives in viewer/js-ui, and handles UI events, and only communicates with JS HAL.
Device features need to be enabled in targets/TARGET_SIMULATOR/device.h.
-
Install a recent version of node.js.
-
Install Mbed CLI.
-
Install the Emscripten SDK - and make sure
emccis in your PATH. -
Run:
$ sh build-demos.sh -
Then, start a web server:
$ node server.js -
Open http://localhost:7829 in your browser.
-
Blinky runs!
The simulator comes with a CLI to run any Mbed OS 5 project under the simulator.
Installation
Install the simulator via:
$ npm install mbed-simulator -g
Or if you cloned the project, via:
$ npm install /path/to/simulator -g
This will create a new mbed-simulator binary somewhere in your PATH.
Running
Then run from an Mbed OS 5 project:
$ mbed-simulator -i . --launch
The project will build and a web browser window will open for you.
To see if your program runs in the simulator, check the TARGET_SIMULATOR macro.
simconfig.json
You can specify simulator options via a simconfig.json object, this is useful because you can check it in. In here you can specify compiler options and ignore paths. Just create the file in your project folder according to the following structure:
{
    "compiler-args": [
        "-std=c++11",
        "--preload-file", "sdcard@/fs"
    ],
    "emterpretify": true,
    "ignore": [
        "./BSP_DISCO_F413ZH",
        "./F413ZH_SD_BlockDevice"
    ],
    "peripherals": [
        { "component": "ST7789H2", "args": {} }
    ],
    "components": {
        "jshal": [
            "./ui/js-hal.js"
        ],
        "jsui": [
            "./ui/js-ui.js"
        ]
    },
    "disableTlsNullEntropy": true
}
It will automatically be picked up by the simulator CLI.
Loading peripherals
The simulator comes with peripherals (such as LCD displays, LEDs, etc.). To load these for your project add a peripherals section to your simconfig file. You can pass in the pin names via "PinNames.p5", these will be automatically resolved on startup. Note that you can change the peripheral config at runtime by clicking Add component. This is then cached by the browser. To clean the cache run sessionStorage.removeItem('model-dirty') from your browsers console.
Adding new peripherals
For an example of how a peripheral looks like, see mbed-simulator-hal/peripherals/Sht31.
A peripheral consists of a C++ implementation, a JS HAL file and a JS UI file. Peripherals in the mbed-simulator-hal/peripherals folder are automatically picked up at compile time. In your own project you can add a section to simconfig:
    "components": {
        "jshal": [
            "./ui/js-hal.js"
        ],
        "jsui": [
            "./ui/js-ui.js"
        ]
    }
The C++ component is automatically picked up. The JS files are loaded when you run the project. Note that all jshal and jsui files will be copied to the BUILD directory, so to change things on the fly, edit those files (or create a symlink).
You can communicate between C++ and JS through ES_ASM macros (C++ -> JS), or via ccall (JS -> C++). See the components that ship with the simulator for examples.
File system
A file system is automatically mounted for you, so you don't need to declare a BlockDevice or a FATFileSystem. Just call fopen and friends. To populate the file system at compile time pass in:
# the part after the @ is the mount location (in this case /fs)

$ mbed-simulator -i . --preload-file folder-to-load/@/fs
C++11
To use C++11 (or a different version), pass in -c "-std=c++11".
Emterpretify
If you see that compilation hangs this might be due to a bug in asyncify. To switch to Emterpretify for async operations, pass in --emterpretify. This is f.e. used for uTensor.
Null entropy
By default no entropy sources are defined. If you see an error by the build process about this (e.g. #error "MBEDTLS_TEST_NULL_ENTROPY defined, but not all prerequisites"), you can add "disableTlsNullEntropy": true to your simconfig.
After changing anything in the simulator HAL, you need to recompile the libmbed library:
-
Run:
$ rm mbed-simulator-hal/libmbed.bc -
Rebuild your application. libmbed will automatically be generated.
In the out folder a number of pre-built demos are listed. To upgrade them:
$ sh build-demos.sh
Simulator applications can be debugged using your browser's debugger, because they contain source maps. To debug an application:
Chrome

- Open the Developer Tools via View > Developer > Developer Tools.
- Click Sources.
- Under 'Network', select the name of the application (see the browser hash).
- Now locate
main.cpp.- On a pre-built demo, go to the
outfolder, select the name of the demo (e.g.blinky) and selectmain.cpp. - On a user-compiled app, go to the orange folder, go to the
outfolder, and selectmain.cpp.
- On a pre-built demo, go to the
- Click in the gutter to add a breakpoint.
- Click the ↻ icon in the simulator to restart the debug session.
Firefox

- Open the Developer Tools via Tools > Web Developer > Toggle Tools.
- Click Debugger.
- Now locate
main.cpp.- On a pre-built demo, go to the
outfolder, select the name of the demo (e.g.demos/blinky) and selectmain.cpp. - On a user-compiled app, go to the folder that starts with
/home/ubuntu, go to theoutfolder, and selectuser_XXX.cpp.
- On a pre-built demo, go to the
- Click in the gutter to add a breakpoint.
- Click the ↻ icon in the simulator to restart the debug session.
size_tis 8 bytes, not 4 bytes wide. Please note this when dealing with existing code. See also emscripten#6973.
viewer/img/controller_mbed.svg- created by Fritzing, licensed under Creative Commons Attribution-ShareALike 3.0 Unported.- Thermometer by https://codepen.io/mirceageorgescu/pen/Ceylz. Licensed under MIT.
- LED icons from https://pixabay.com/en/led-icon-logo-business-light-1715226/, Licensed under CC0 Creative Commons.