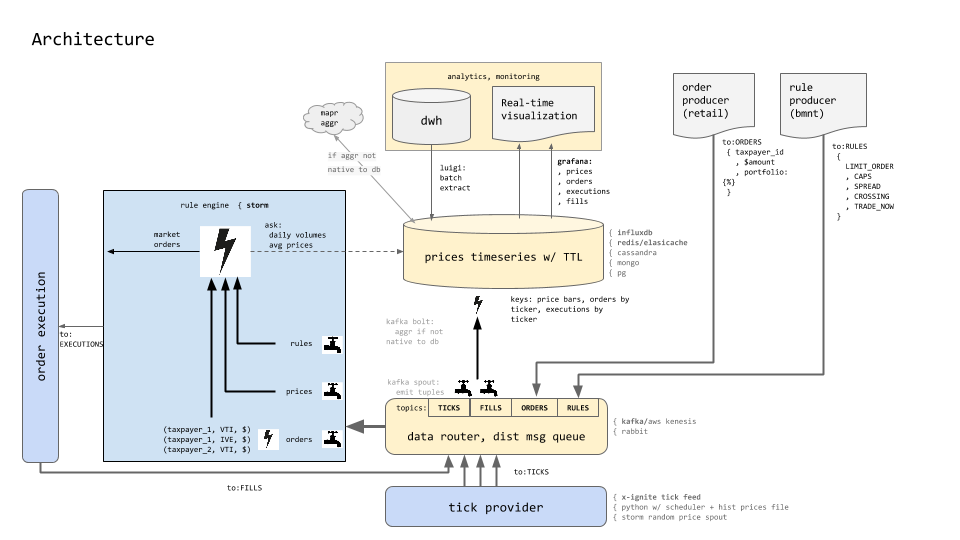
An architectural pattern for real-time Ticks and Trading using a durable msg queue (Kafka), a distributed realtime computation system (Storm w/ python streamparse), and a time-series database (influxdb).
To illustrate:
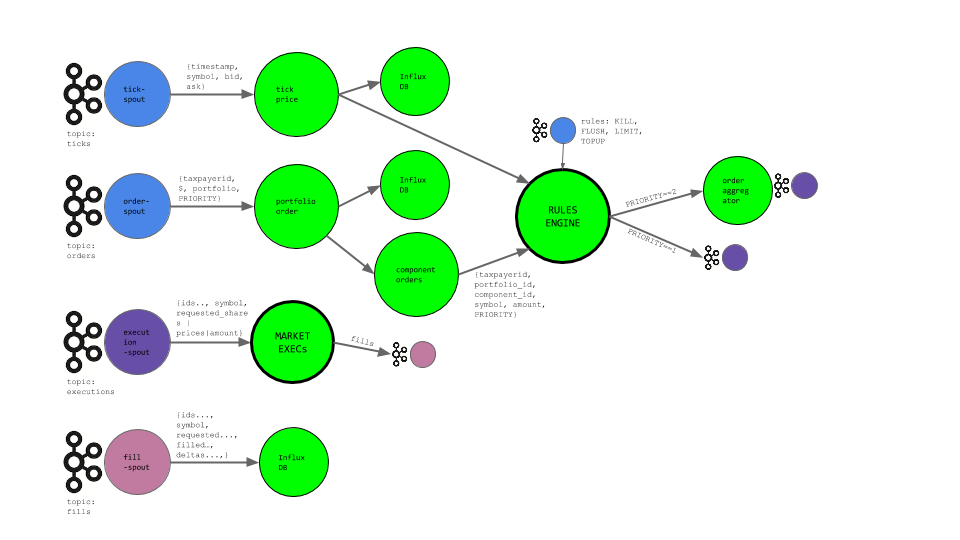
A segment of our Storm topology reads Ticks from the ticks Kafka topic. The
Kafka spout is JVM-based and defined in src/clj/fintank/spouts/tick_spout.clj.
The tuples emitted by this spout are JSON-formatted strings and so a Python
bolt handles deserializing the JSON. Technically, this isn't needed as the
Kafka spout is entirely capable of performing this deserialization itself using
a custom Scheme instead of the current StringScheme. Implementing this is a TODO.
Once deserialized, Ticks are emited to an InfluxDB bolt for persisting the tick and, in parallel, on to the Trading Rule Engine responsible for matching latest prices to orders - as the business rules permit.
At the core of this implementation is Streamparse - allowing us to write Python code against Storm streams. Gratitude to the Parse.ly team for their fantastic tutorials and documentation - much of the scaffolding here is an elaboration on their kafka-jvm tutorial.
Install Vagrant and Virtualbox.
Install omnibus plugin:
cd ~/src/storm
vagrant plugin install vagrant-omnibus
Run vagrant up to create a virtual machine.
This can take > 10 minutes and appears to hang at Loading project definition from /vagrant/kafka-manager/project. Be patient.
This uses chef-solo to automatically provision it with:
- Java (openjdk 7)
- Python (2.7.5)
- pip (latest)
- virtualenv (latest)
- supervisord (latest)
- Apache Zookeeper
- Apache Storm (0.9.4)
- Kafka (0.8.1.1)
- Kafka Manager (latest)
- InfluxDB (latest)
- Grafana (latest)
This will take a few minutes to fully provision the server. Once provisioned,
this server will have the following services accessible at 192.168.50.50:
- Zookeeper: 2181
- Storm UI: 8080 http://192.168.50.50:8080/index.html
- Storm Nimbus (Thrift): 6627
- Storm DRPC: 3772
- Storm DRPC Invocations: 3773
- Storm Logviewer: 8000 http://192.168.50.50:8000
- Kafka: 9092
- Kafka Manager (yahoo): 9000 http://192.168.50.50:9000
- InfluxDB: 8083 (ui) http://192.168.50.50:8083, 8086 (api)
- Grafana: 3000
In order to ensure that the settings within the VM work for both the
sparse run and sparse submit commands, you'll need to modify your
/etc/hosts file and add the following line:
192.168.50.50 streamparse-box
In order to sparse submit topologies to the Storm cluster running in your
virtual machine, streamparse requires ssh access to the box. Unfortunately,
vagrant uses some clever tricks when it executes vagrant ssh that we need to
copy. In order to allow streamparse to ssh into the box, we need to modify your
ssh config. Note that if you only wish to run this example via sparse run,
this step isn't necessary.
Run this command to append the necessary info to your local ~/.ssh/config.
echo >> ~/.ssh/config && vagrant ssh-config | sed -e 's/Host default/Host streamparse-box/' -e 's/HostName 127.0.0.1/HostName 192.168.50.50/' -e 's/Port 2222/Port 22/' -e 's/LogLevel FATAL/LogLevel INFO/' >> ~/.ssh/config
You can confirm that ssh is configured properly by running ssh streamparse-box
which should allow you to ssh into your new virtual machine without Vagrant.
SSH-ing into the box seemed to indicate a restart was required:
vagrant halt && vagrant up && vagrant provision
http://streamparse-box:9000/addCluster
- Cluster Name:
kafka_development - Cluster Zookeeper Hosts:
localhost:2181
First, install necessary requirements via pip
(preferrably inside a virtualenv).
brew install python
pip install virtualenv
cd ~/src/storm
export PIP_REQUIRE_VIRTUALENV=true
virtualenv pyenv
cd pyenv
source bin/activate
pip install -r ../requirements.txt
Next, seed the ticks topic in Kafka with some sample data by running the
following command from outside of your VM:
cd ~/src/storm
source pyenv/bin/activate
invoke queue_ticks
By default, this will seed the topic with 100,000 randomized ticks. Ticks are JSON-formatted strings that look something like this:
{"ask": 94.190756, "timestamp": 1438539936.355217, "symbol": "IVE", "bid": 93.97388, "exchange": "NASDAQ"}You may have to seed each Kafka topic. The first time a message is submitted to a non-existing topic, Kafka may fail and abort. Try again - the topic will be automatically created. When the command is working properly, you'll see a message like this:
Seeding Kafka (streamparse-box:9092) topic 'ticks' with 100,000 fake ticks.
Done.
cd ~/src/storm
source pyenv/bin/activate
invoke queue_orders
If you get an error:
kafka.common.LeaderNotAvailableError: TopicMetadata(topic='orders', error=5, partitions=[])
then retry invoke queue_orders.
cd ~/src/storm
source pyenv/bin/activate
invoke executionsIf not already installed, install lein:
brew install leiningen
Test the topology locally with:
cd ~/src/storm
source pyenv/bin/activate
sparse run --debug -t 15
It's helpful just to see the end result of this topology, so you can filter the debug output to only those tuples emitted from the final bolt:
sparse run --debug -t 60 | grep "Emitting: tick-deserializer default"If everything worked properly, you should soon see messages like:
31098 [Thread-27] INFO backtype.storm.daemon.task - Emitting: tick-deserializer default ["ask": 109.899805, "timestamp": 1437423417.163825, "symbol": "VTI", "bid": 109.872953, "exchange": "NASDAQ"]
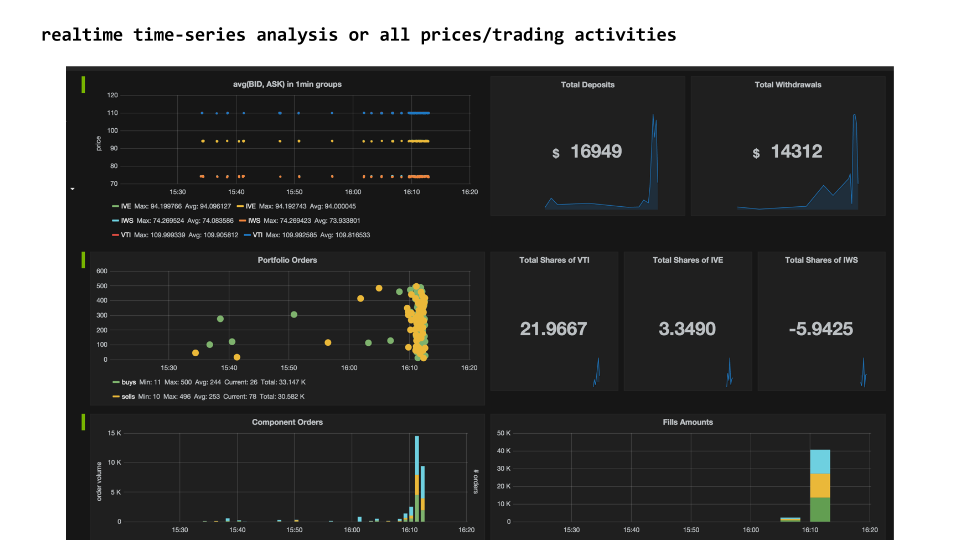
Visit http://streamparse-box:3000/. You should see a grafana dashboard. Import the order-flow dashboard configuration from dashboards/Order Flow-1437489850276.json
Seeing as your VM also has a Storm cluster, you can submit the topology to the
Storm cluster using sparse submit. Navigate to the
Storm UI to check out it's progress!
Is deployed to: http://streamparse-box:9000/. Visit http://streamparse-box:9000/clusters/kafka_development/topics via the top-level menu and make sure you have the following topics created:
- executions
- fills
- orders
- ticks
This POC uses an open-source distributed time-series db, InfluxDB - but other DB (redis, cassandra, even PG) can be plugged in instead. InfluxDB was chosen for its feature-fulness and the elegance of its query syntax. For example:
SELECT mean(ask), mean(bid) FROM "bid_ask" WHERE "symbol" = 'IVE' AND time > now - 1h GROUP BY time(1m) fill(null) ORDER BY asc
shows the ease with which we can display avg bid and ask prices for the last hour of tick data, over 1minute groupings.
InfluxDB comes with a web-ui: http://streamparse-box:8083/ that supports interactive querying. For command-line interfaces, visit InfluxDB Tools Page


