This directory has information for the Design Challenge
The subdirectories are:
RealisticData: Data files that are more realistic - these are the ones you should visualize for your final versions.
Python: Python 3.6 example code (including examples of file reading, and a simple SVG visualization)
SimpleData: Some example files that are very simple (you cannot use these as the data you visualize for your final version)
D3: An example webpage using D3 to make a visualization of an example gradebook file.
The program here is utilized for grading purpose of CS765 UW-Madison as a Desgin Chanllenge
pleaes visit the report through:
https://docs.google.com/document/d/1upXnJ8Oh-nUnWOAXGYLU8QmI01b3_wiNmEbrwMYXXRM/edit?usp=sharing
Please use the http-server to open the web-browser to view.
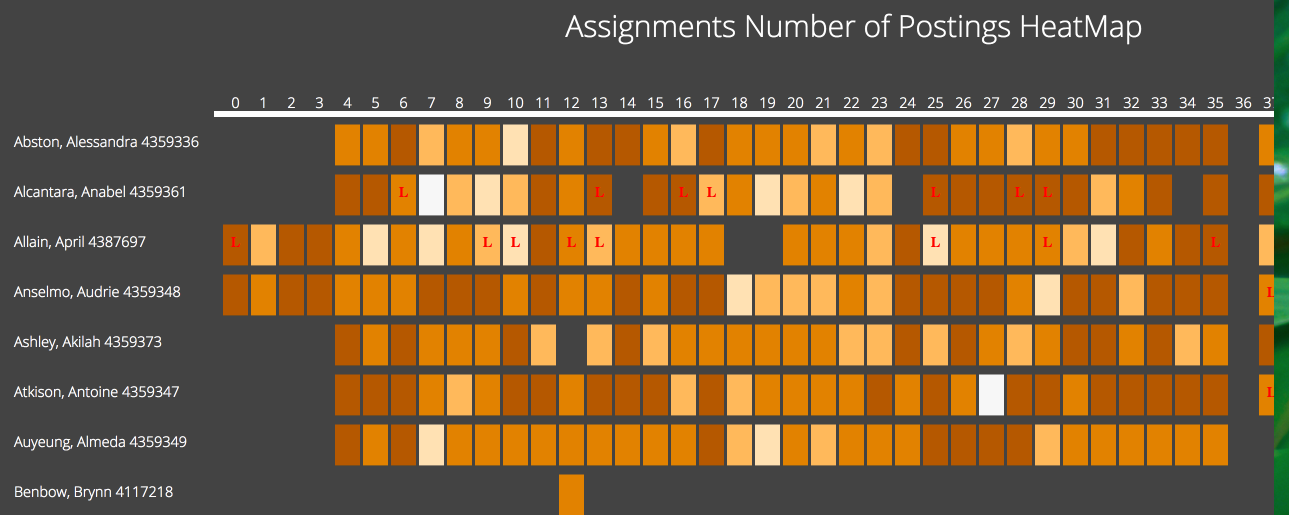
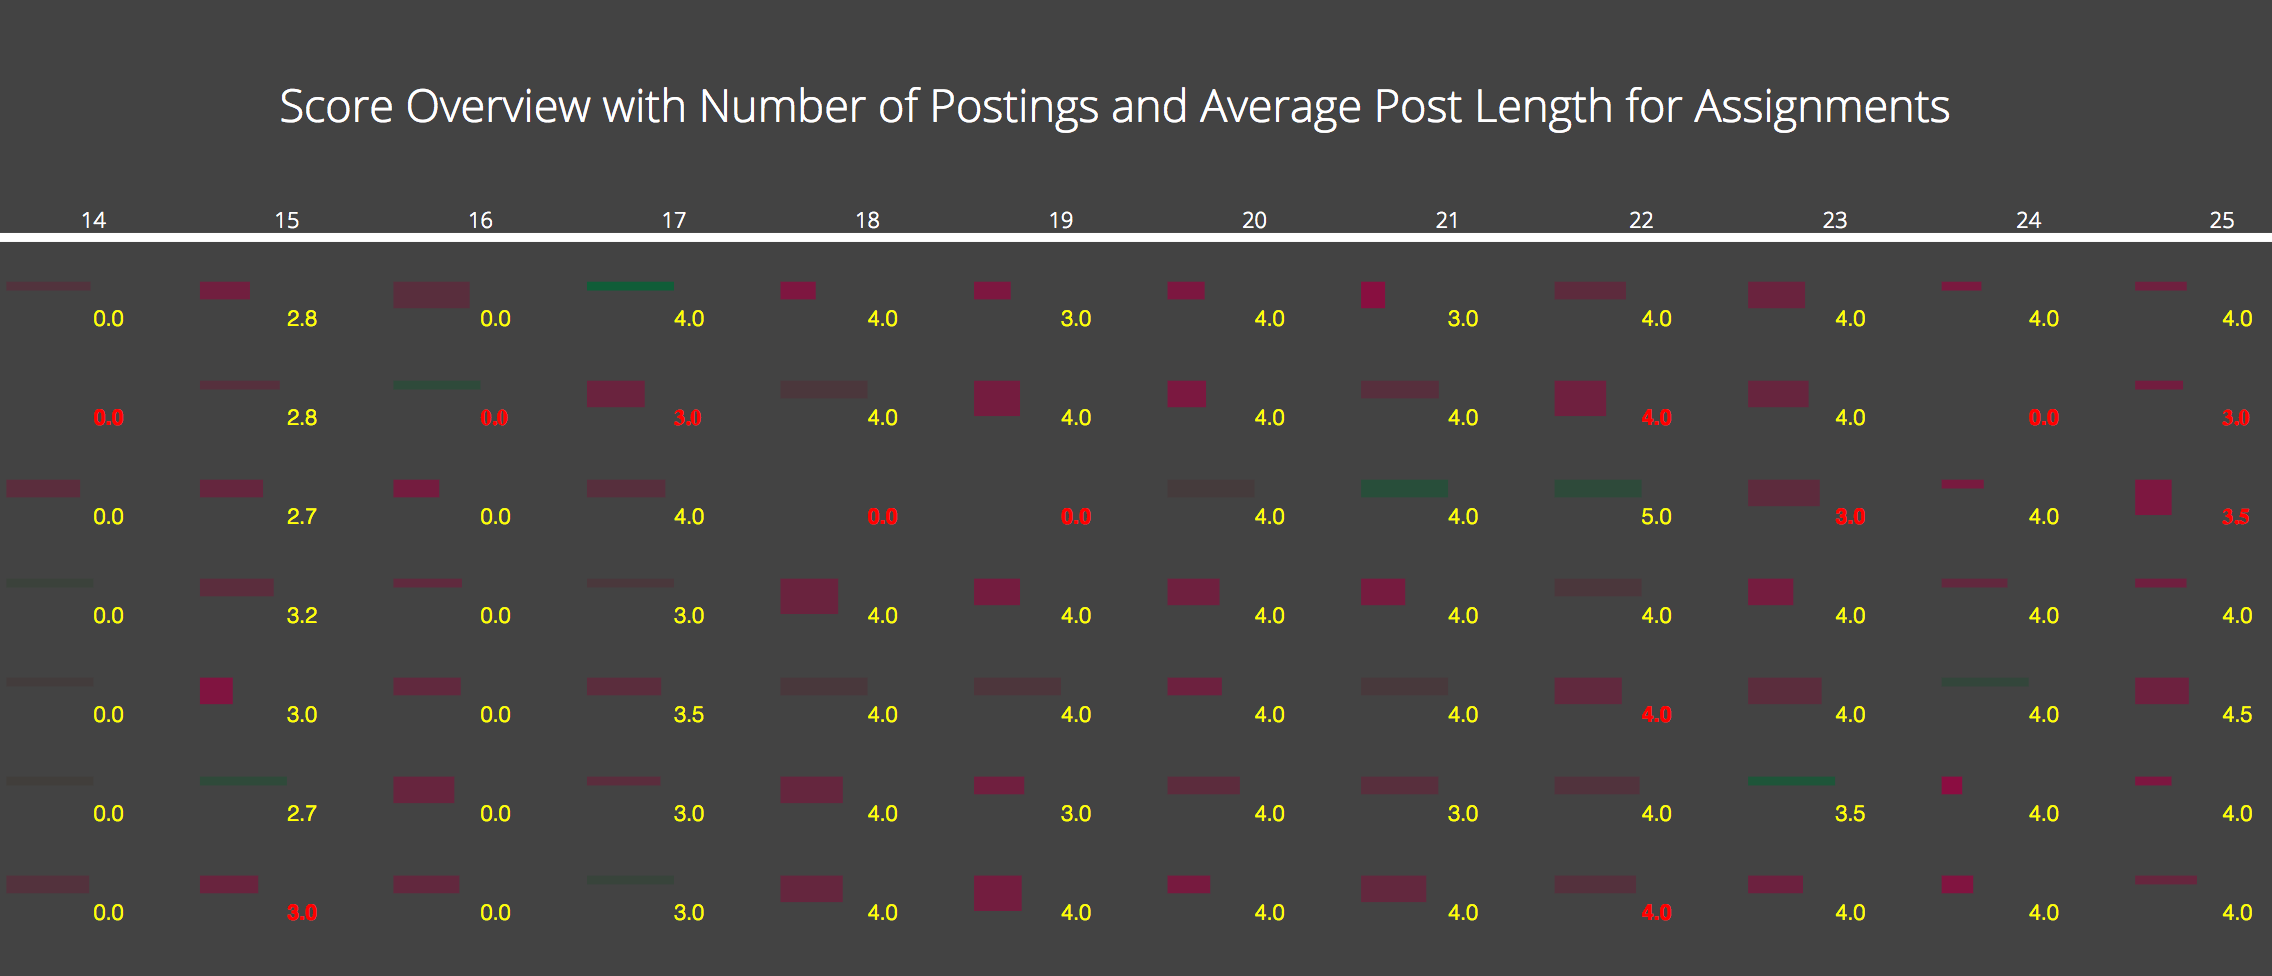
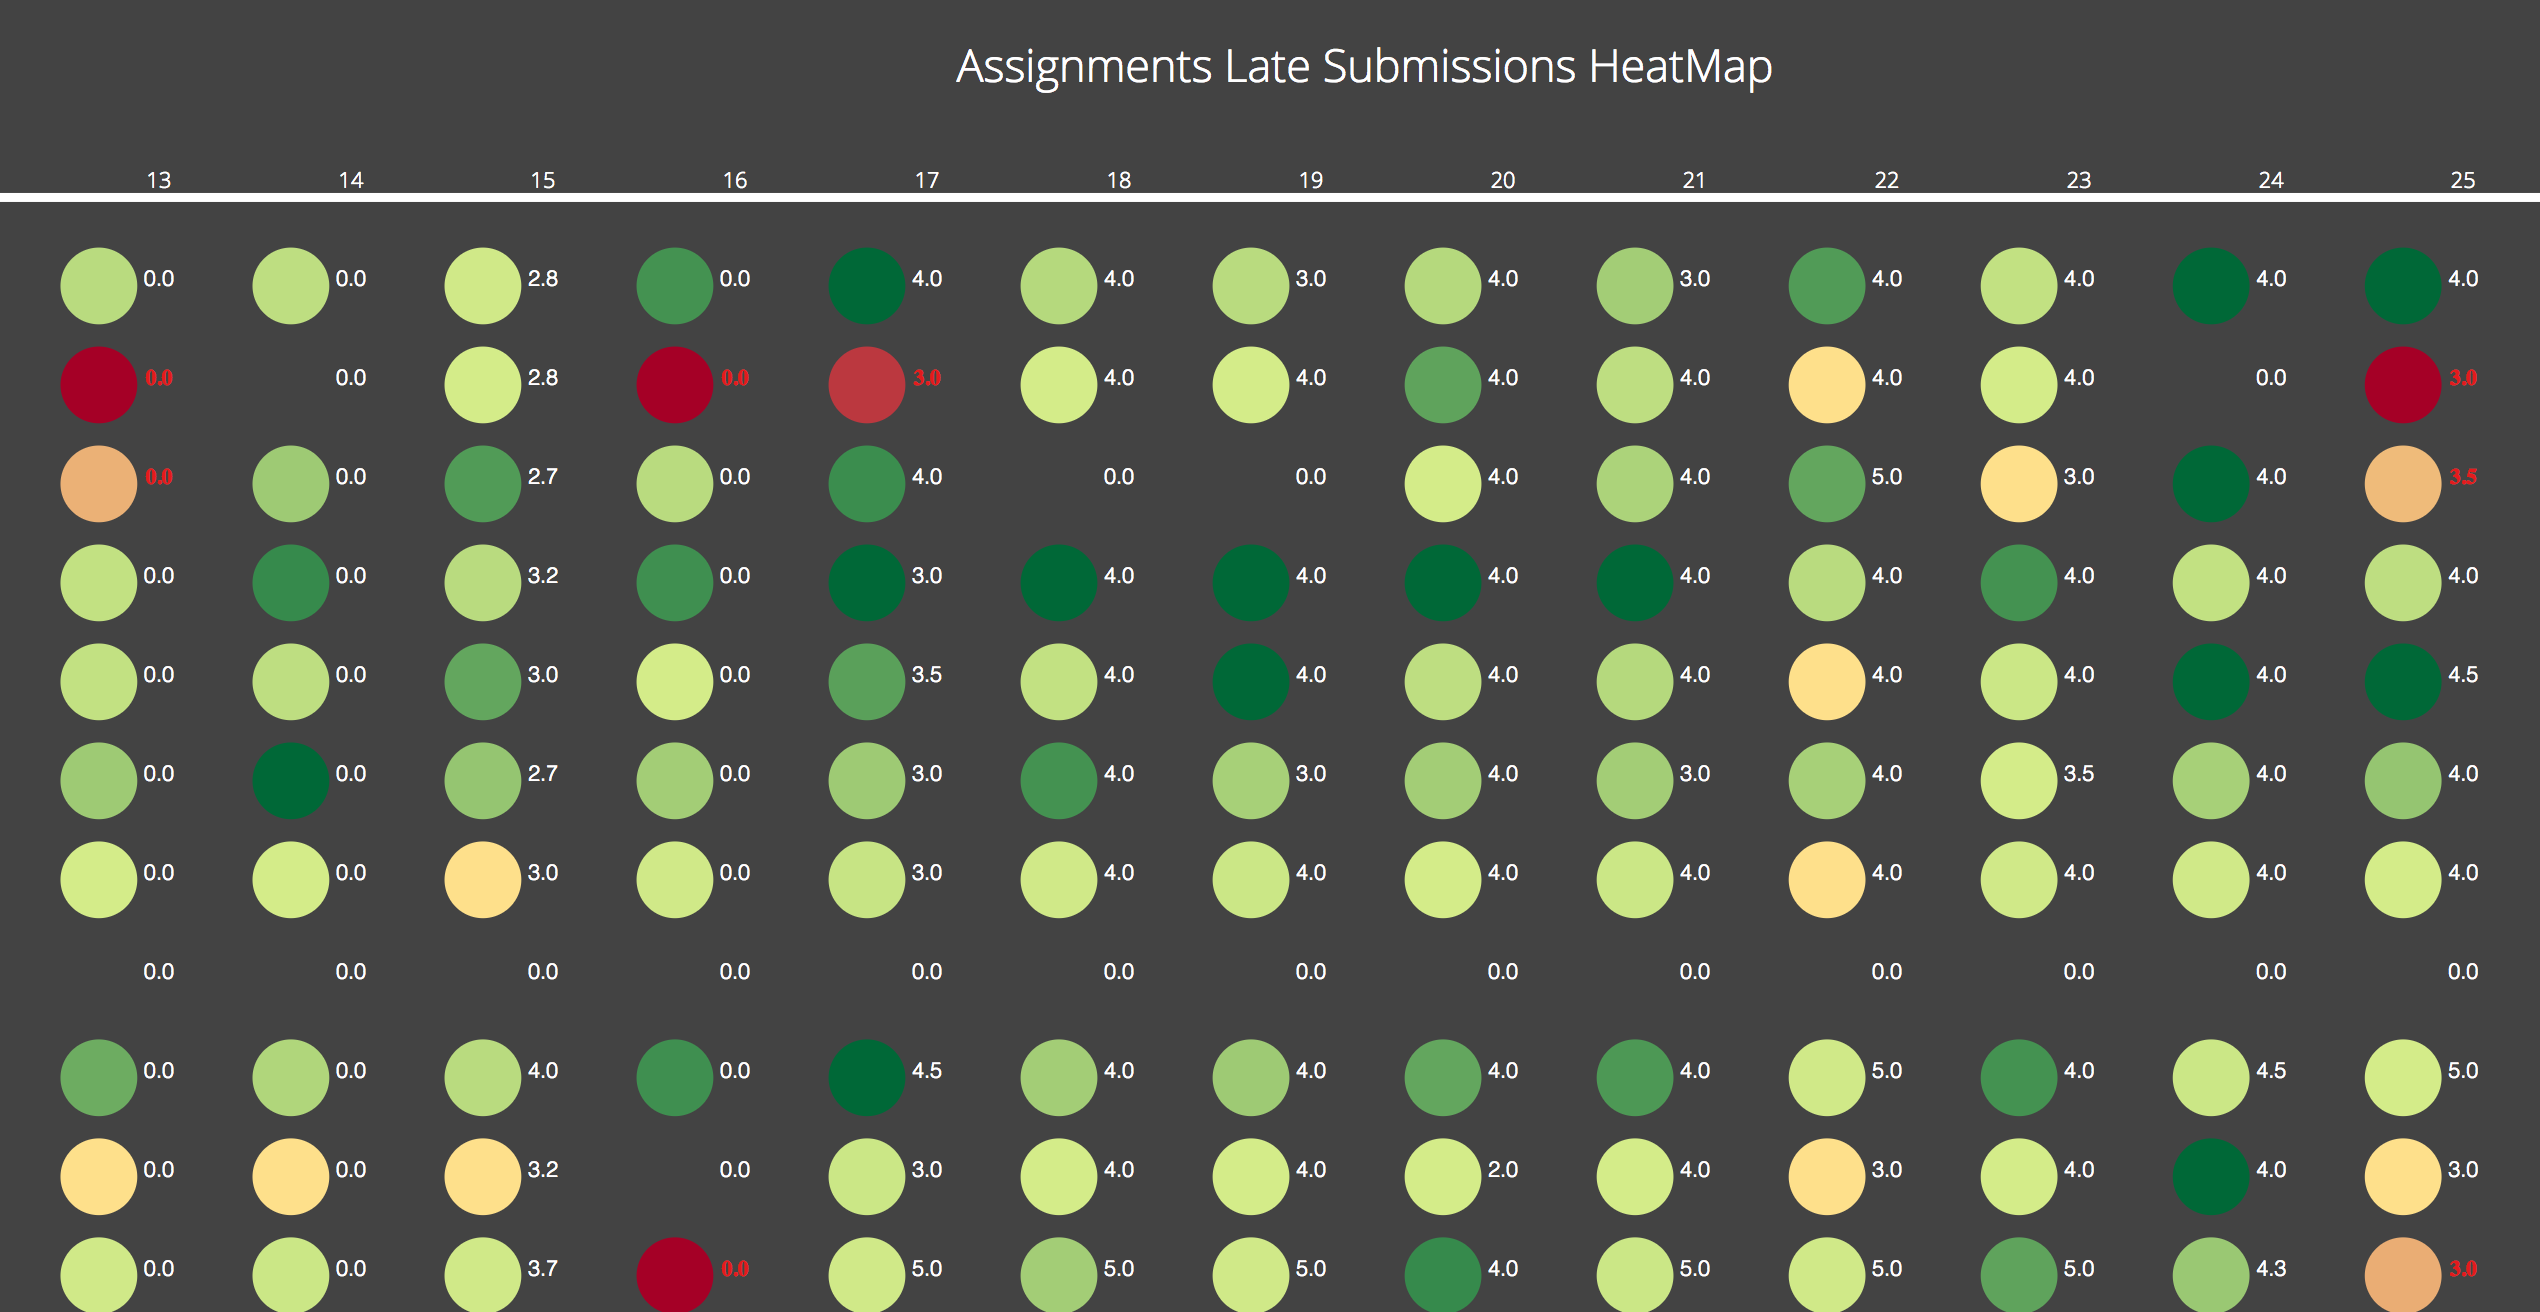
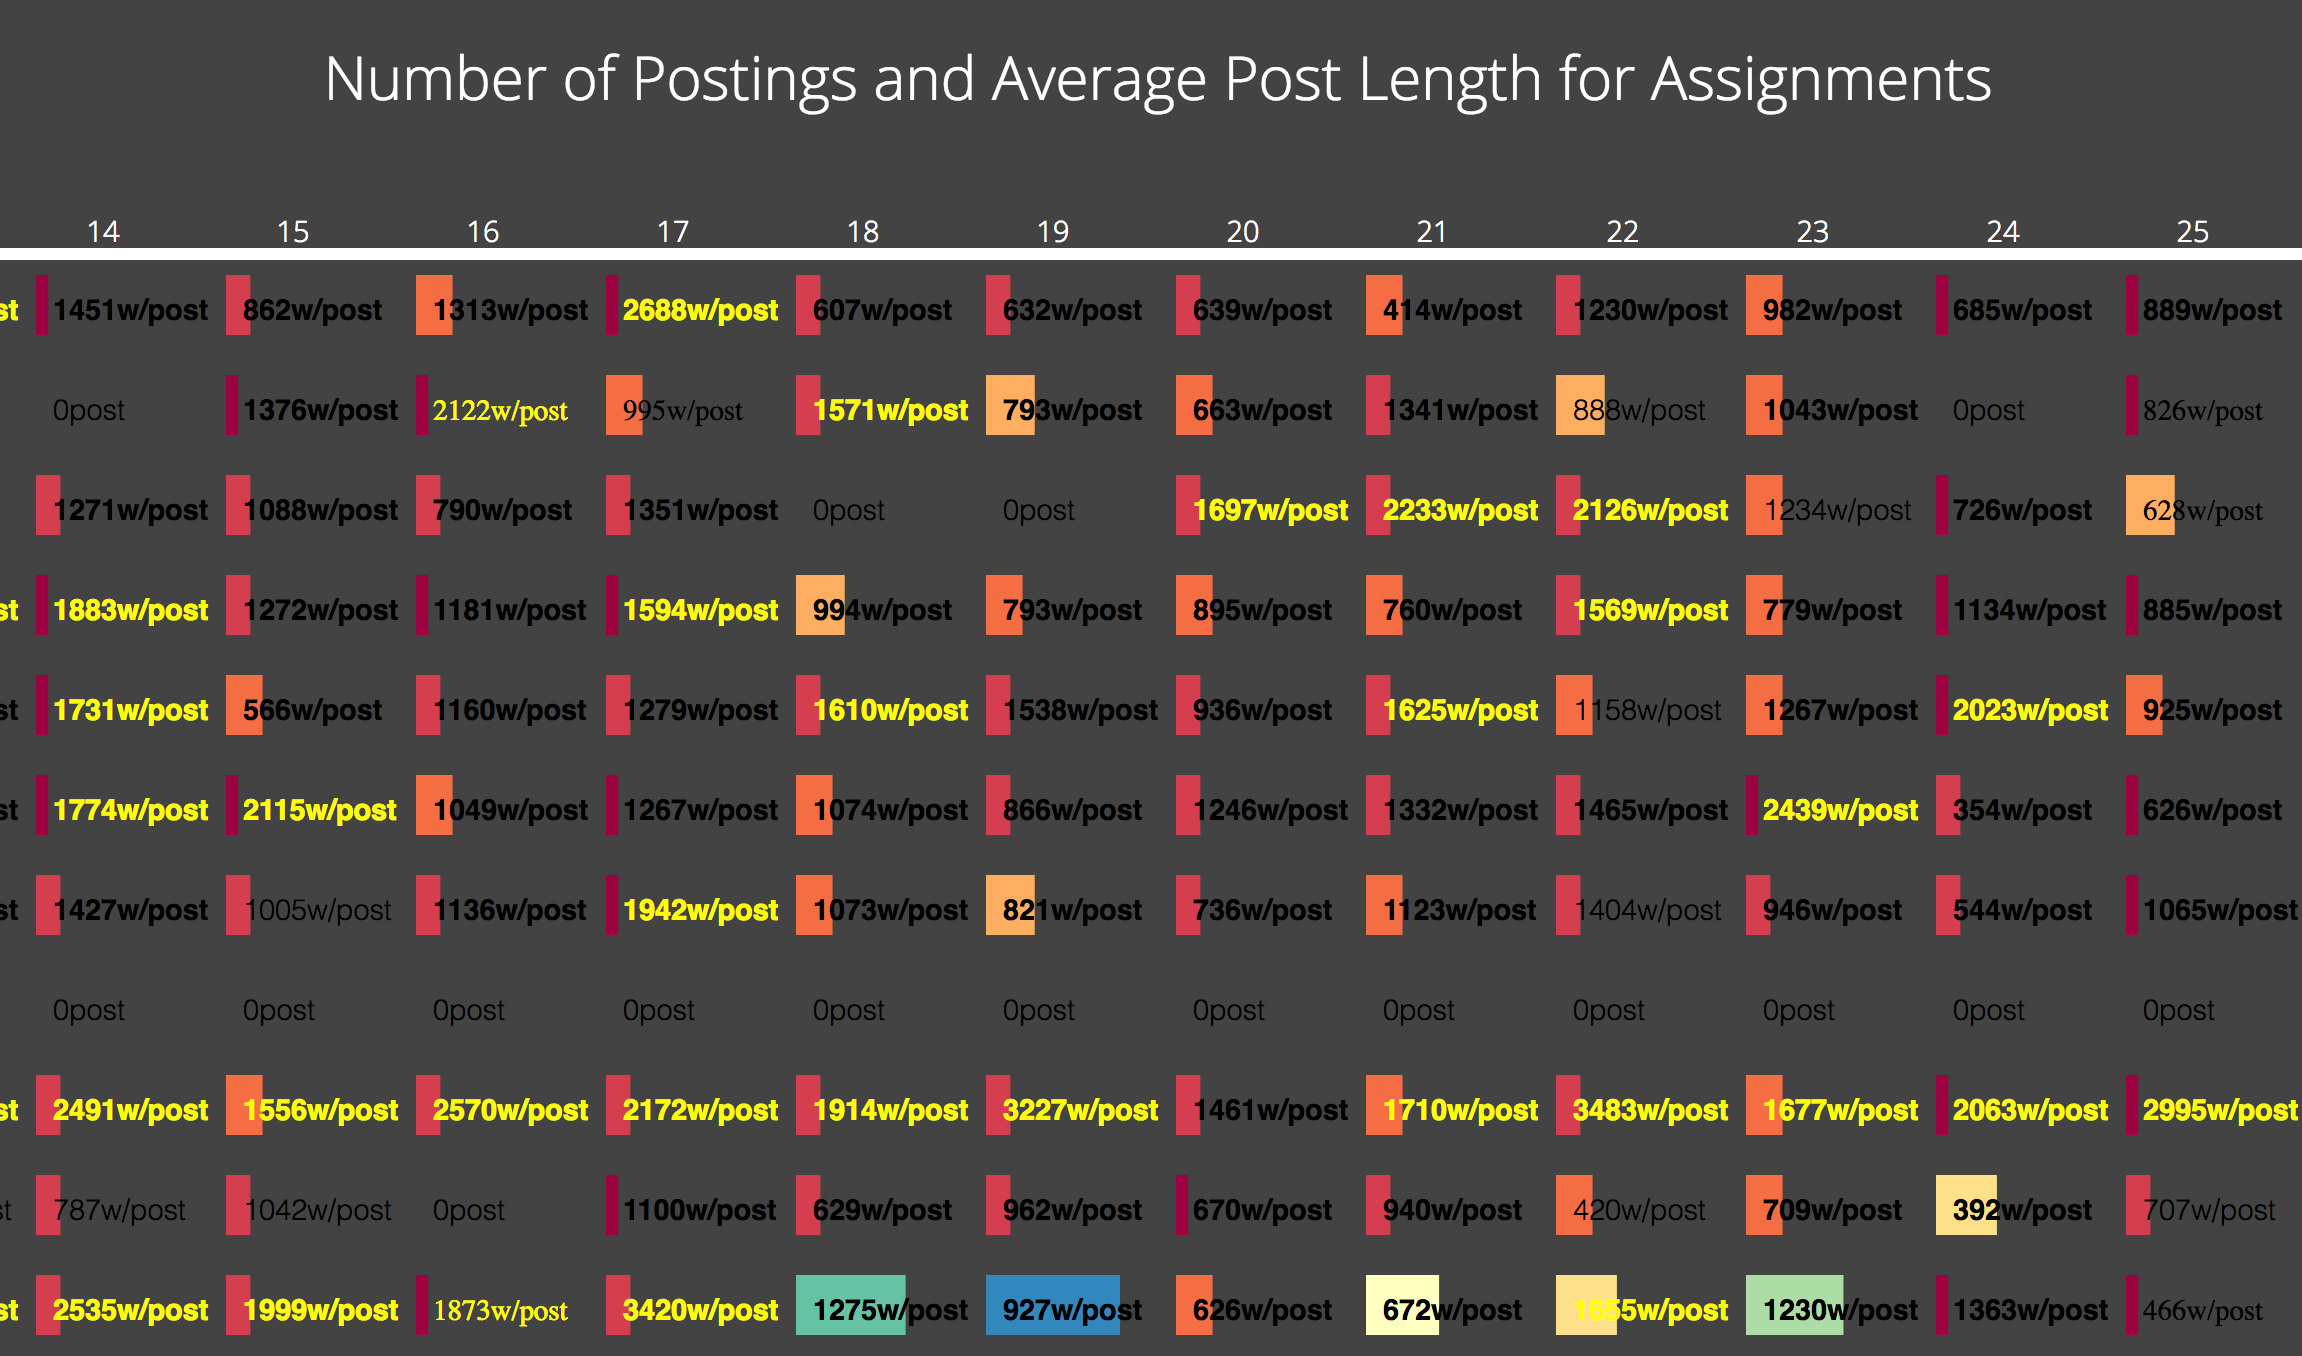
Some sampled output are listed here for review:


