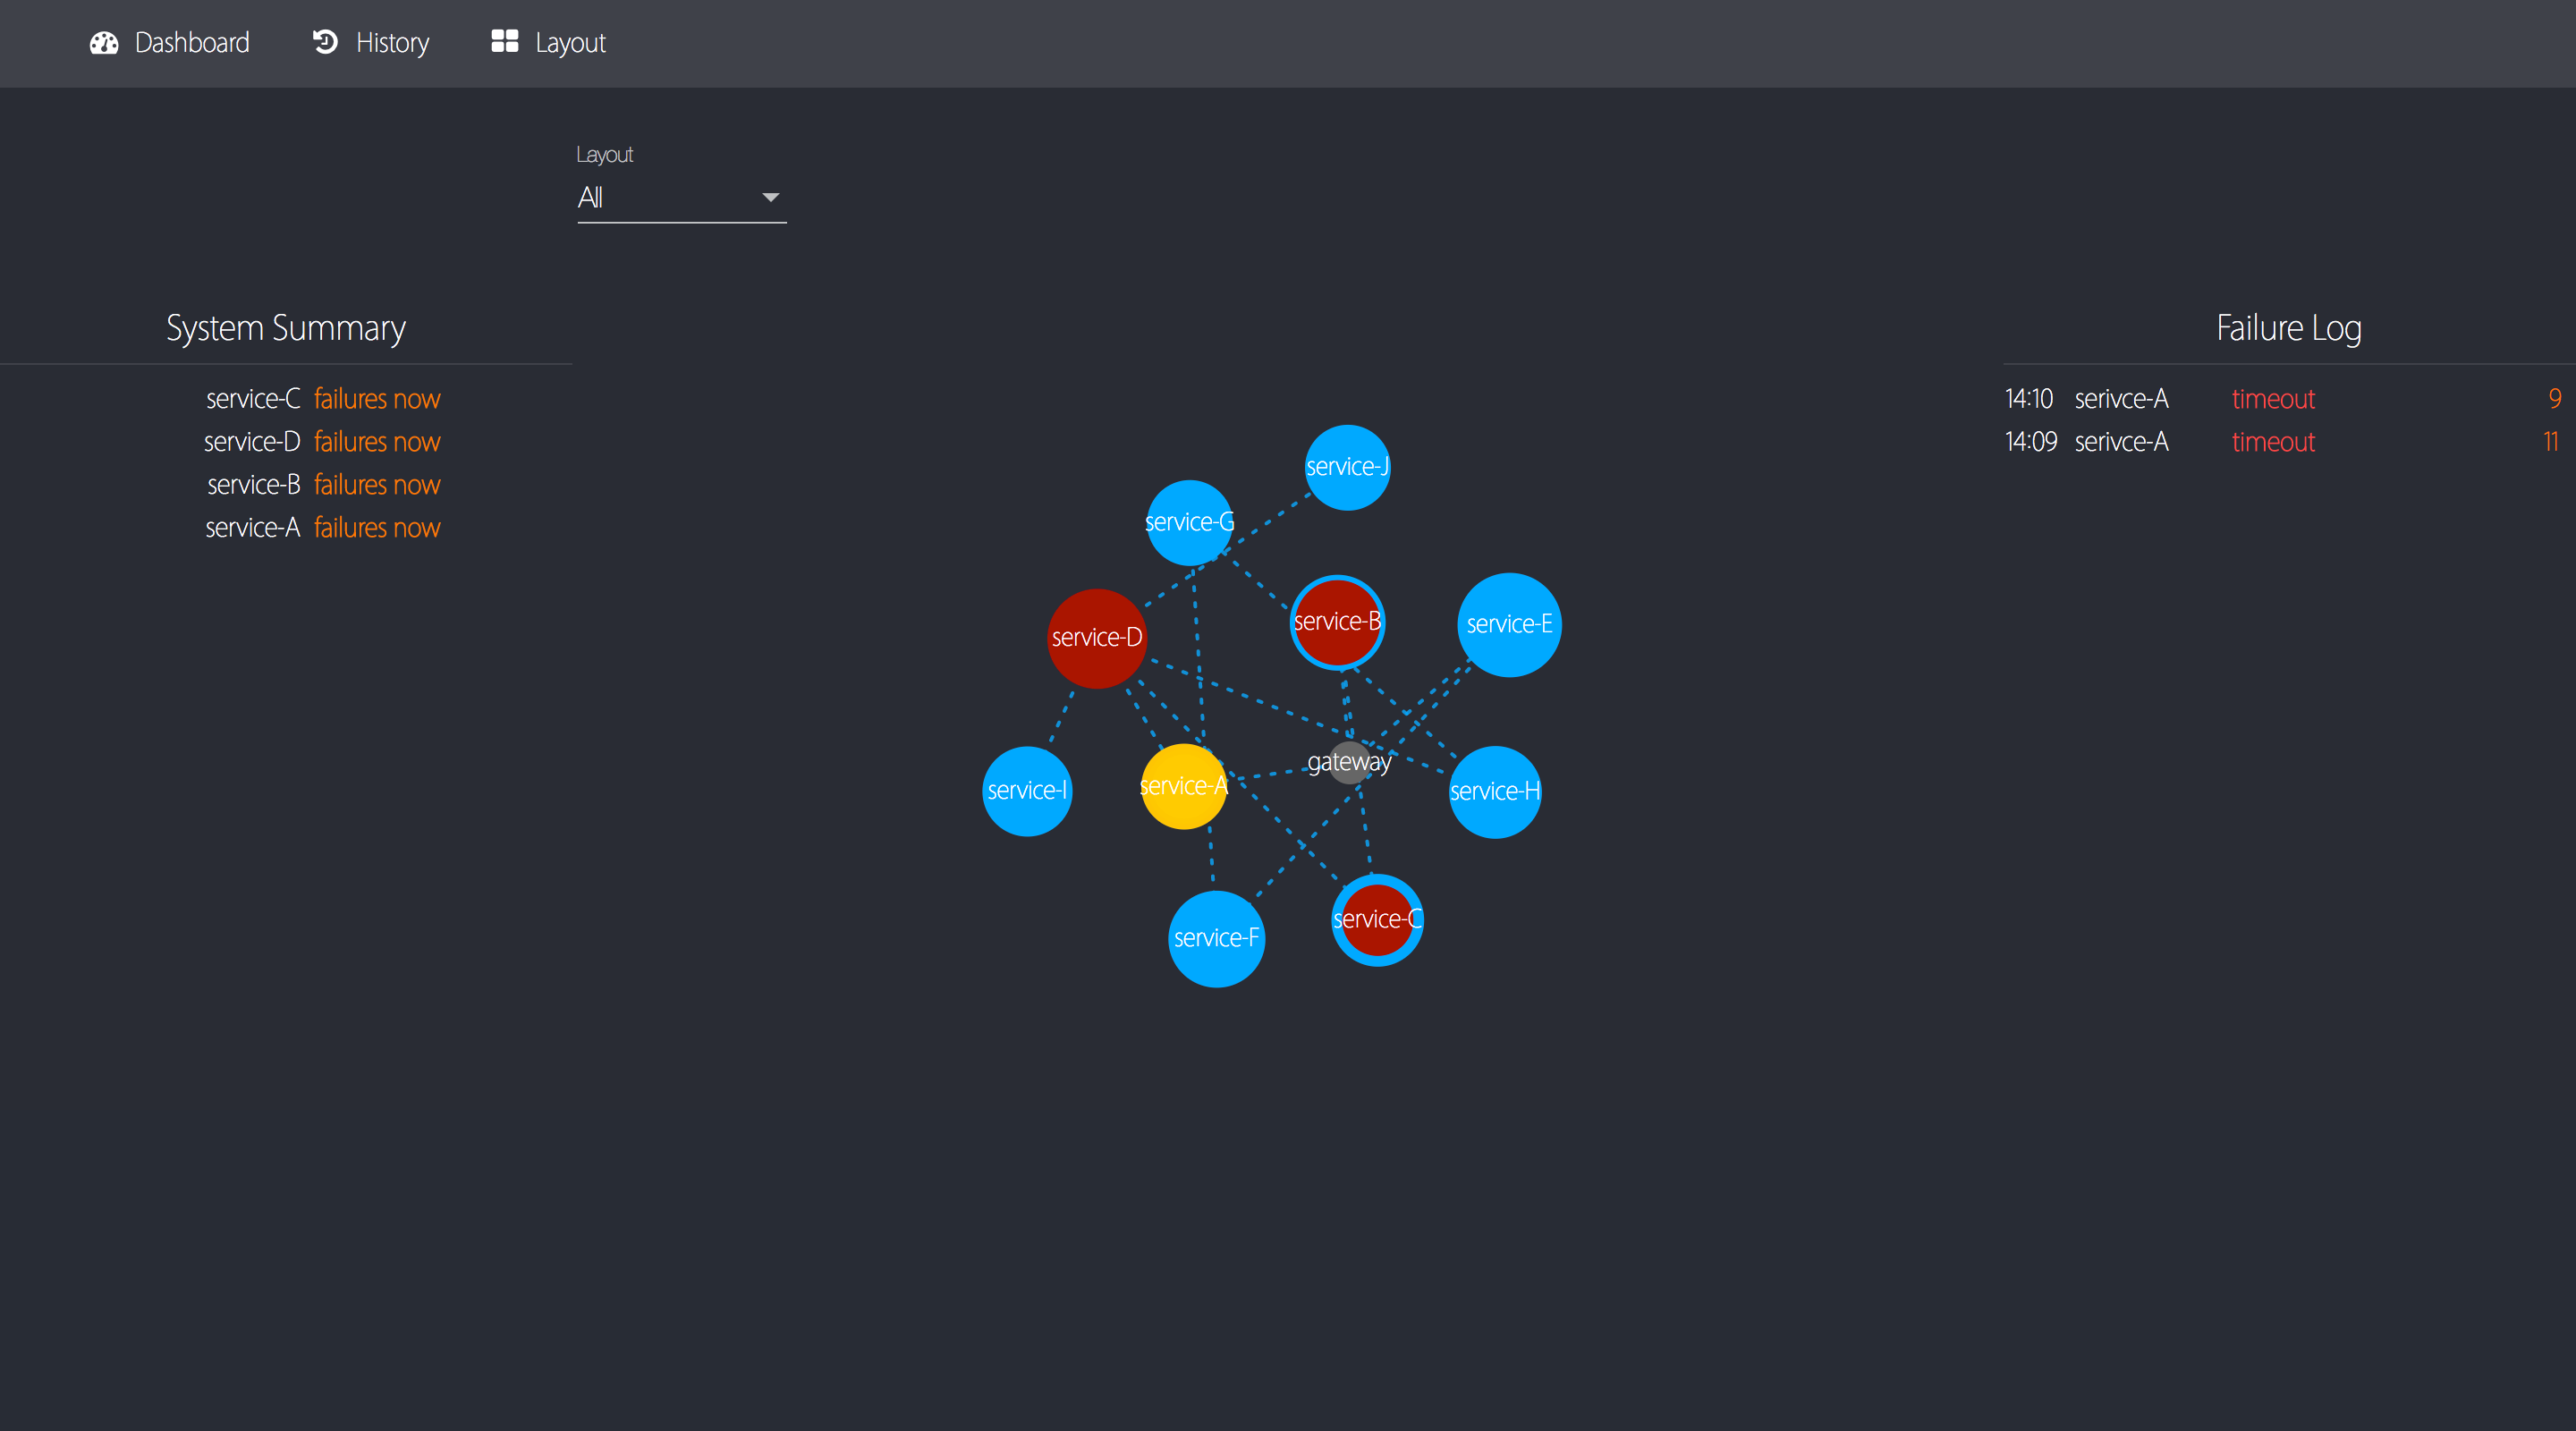
Overwatch is a general RPC monitoring system for distributed systems, utilizing D3 force layout as main diagram.
Overwatch provides an overview of the current state of the entire system, making it super easy for system administrators to understand the ongoing RPC events and pinpoint the source of failure in the system.
Unlike common monitoring systems, a well-designed graph (with D3 force layout) is used to visualize data.
- every circle represents a system
- every line represents a dependency between two systems
- rpm = requests per minute, fpm = failure per minute
- circle size indicates rpm of the system
- line dash density indicates rpm between two systems
- circle color indicates the health of the system in the last 1 minute
- two additional ring outside the circle inicates the health of the system in the past 5 minutes and 15 minutes
Download release version (not available yet...)
Or use install.sh to build from source
- NodeJS / NPM
- RDBMS (MySQL is recommended)
- Redis (Optional)
After proper installation, you have to
-
modify config files server/app/config.json & web/src/environments/environment.ts
-
start server: under server run
$ npm start
- build & serve web content: under web run
for testing:
$ npm start
then visit localhost:4200
for production:
$ npm run build
then serve static directory web/dist with Nginx (or whatever)
This is recommended for testing.
Demo: SocketIODemo.java
This is recommended for small-scale systems to publish stats.
Demo: RedisDemo.java
This is the recommended method for large & complex systems to publish aggregated stats.
Demo: rest-demo.sh
Please see LICENSE for more info.
Please see CONTRIBUTING for more info.
