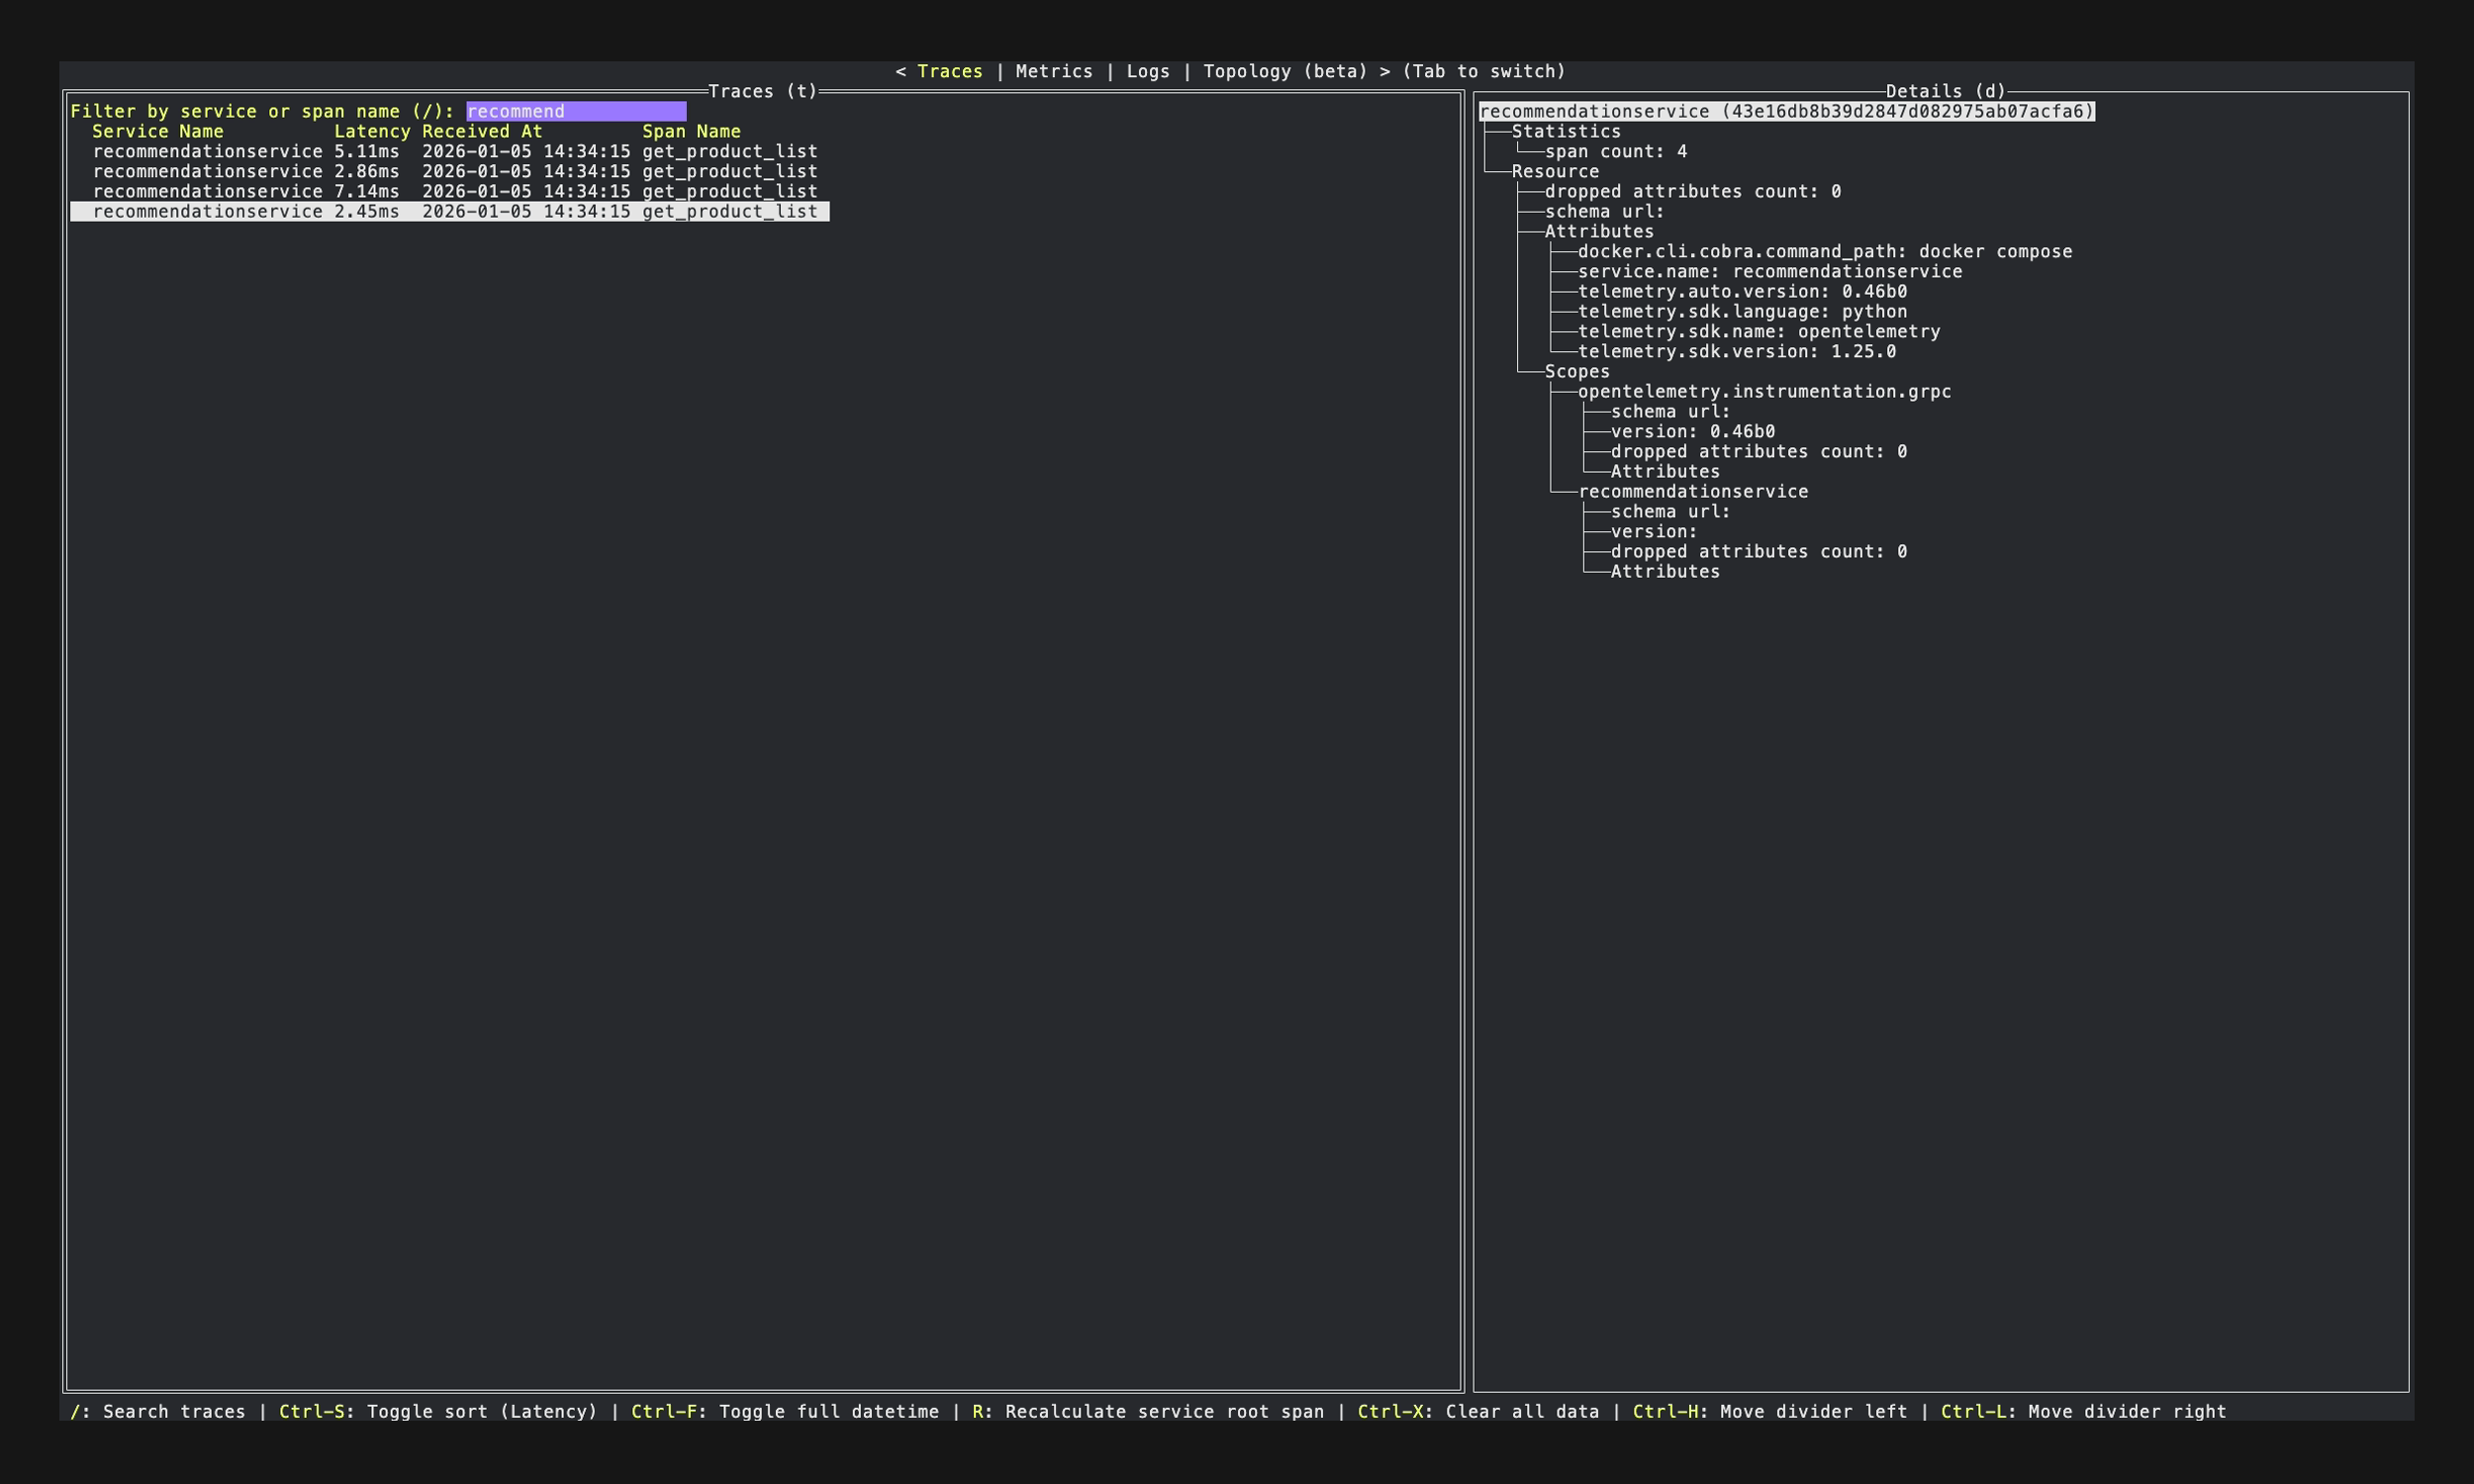
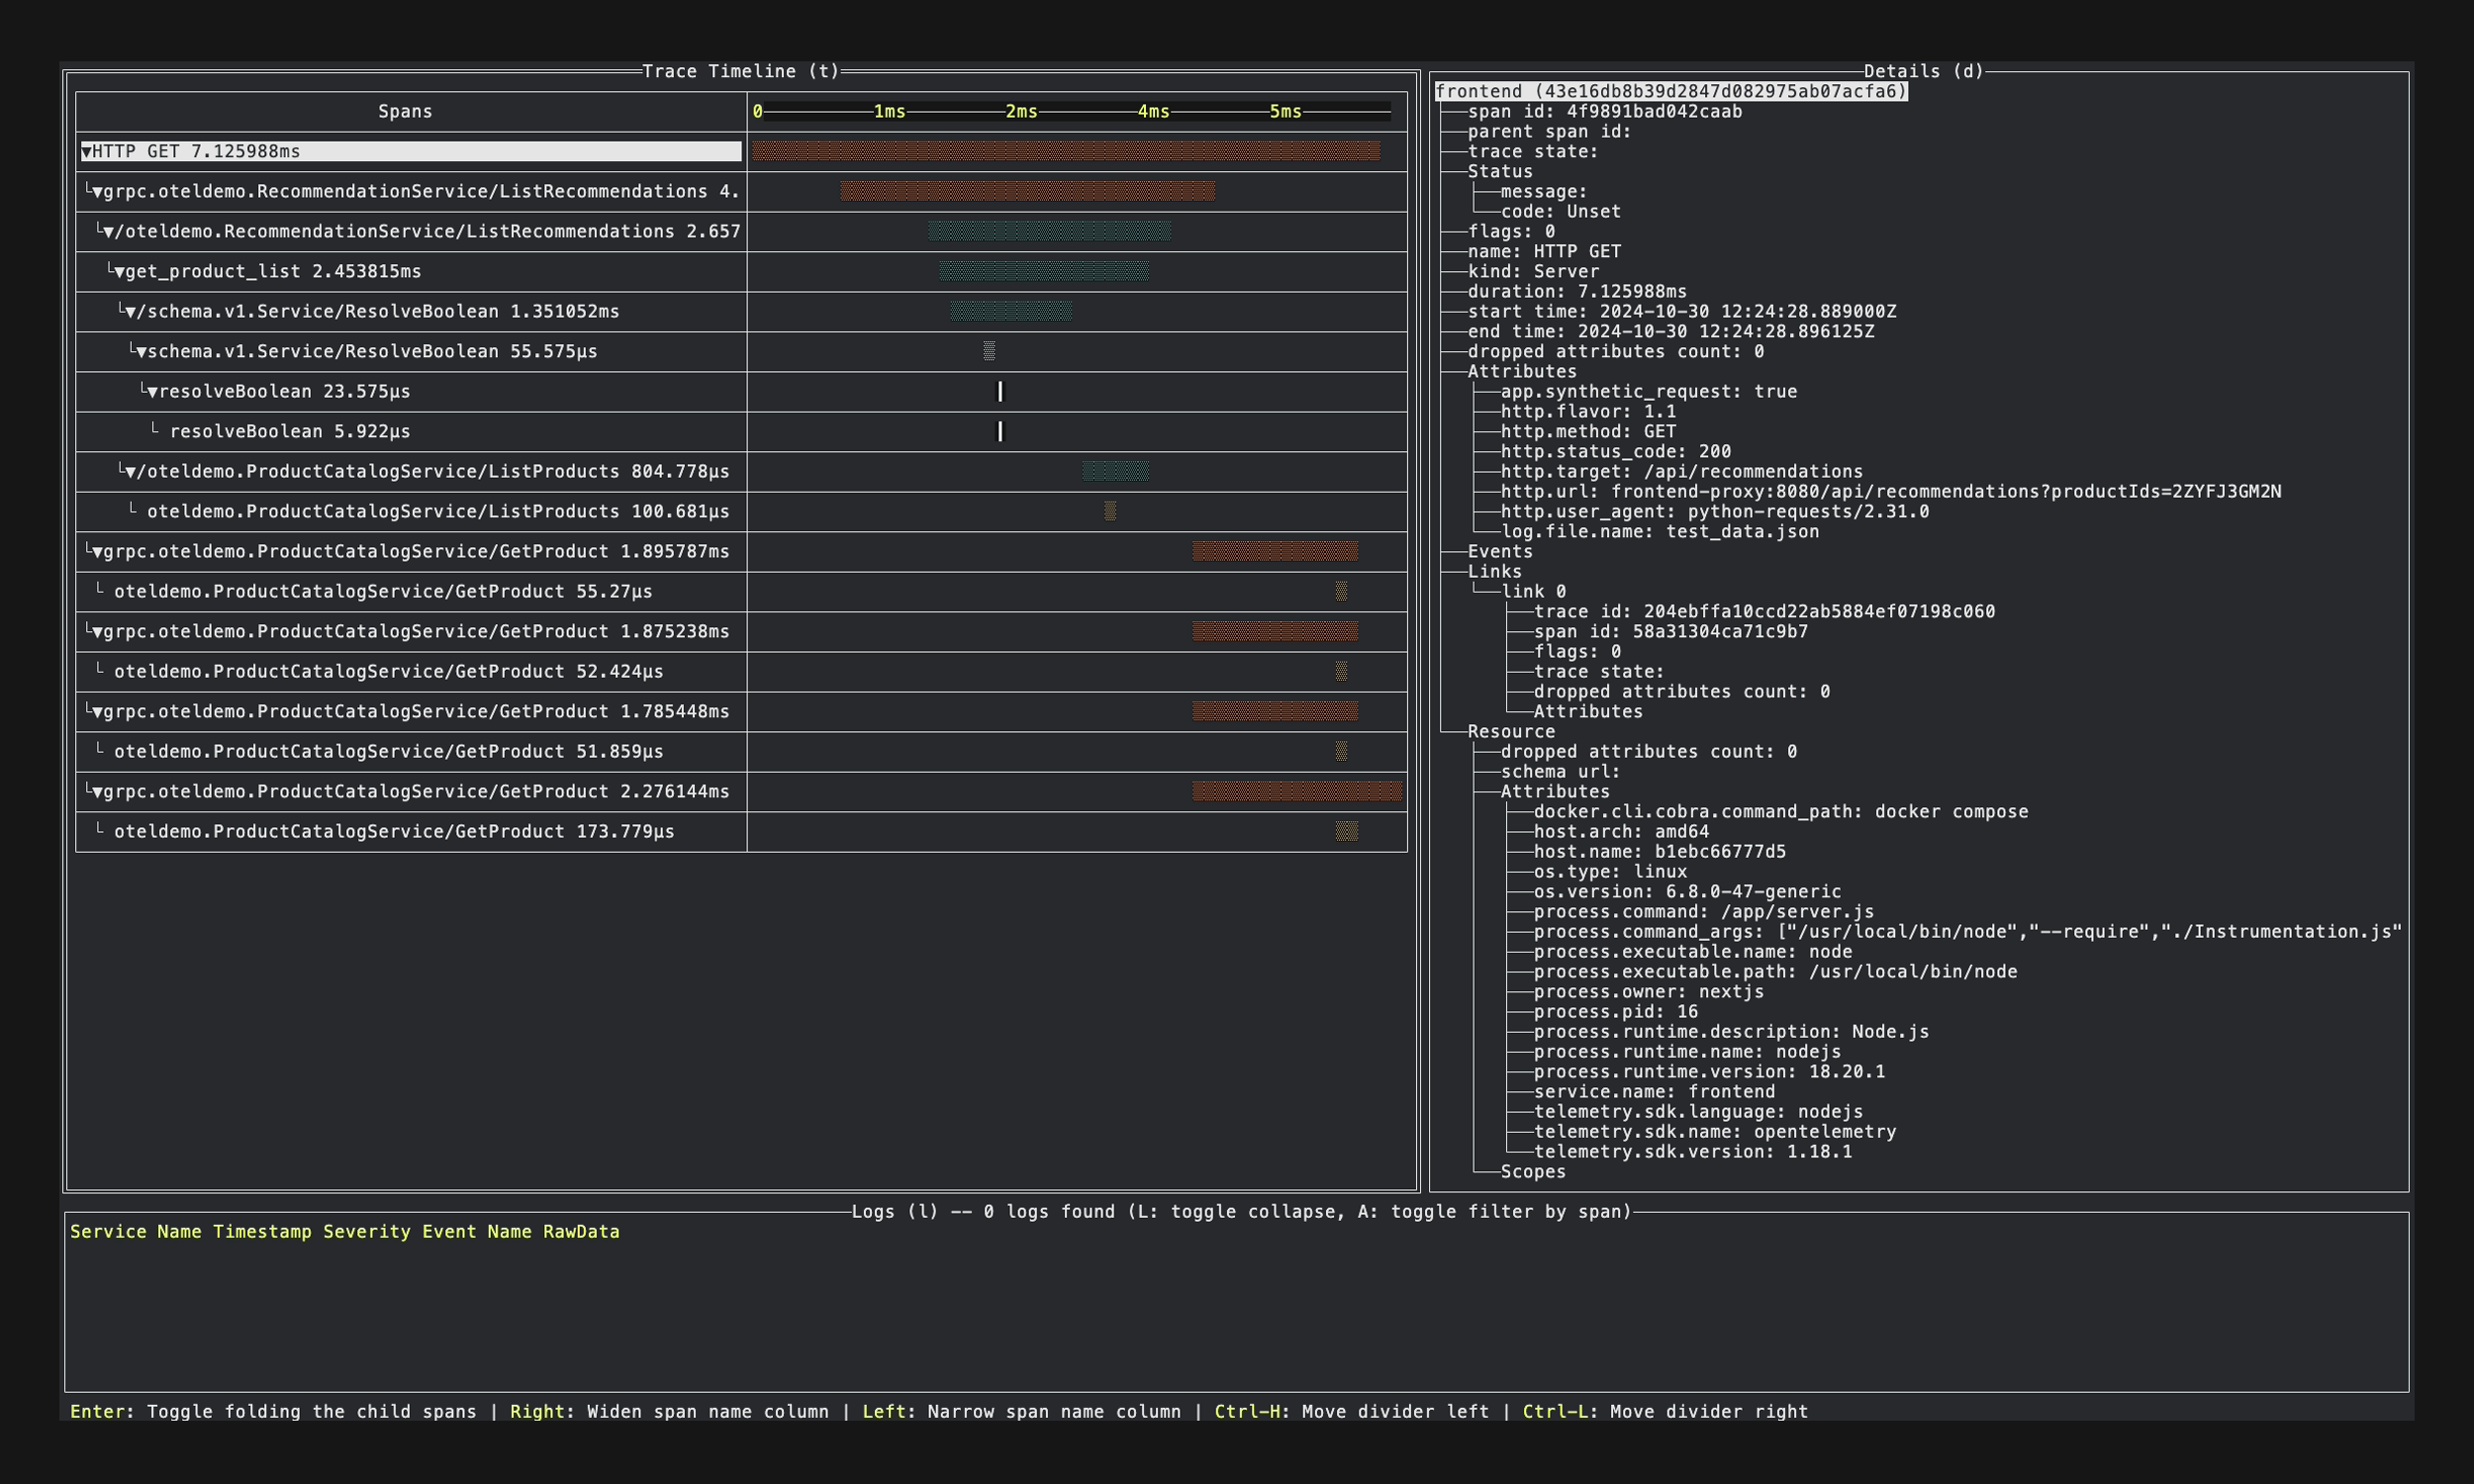
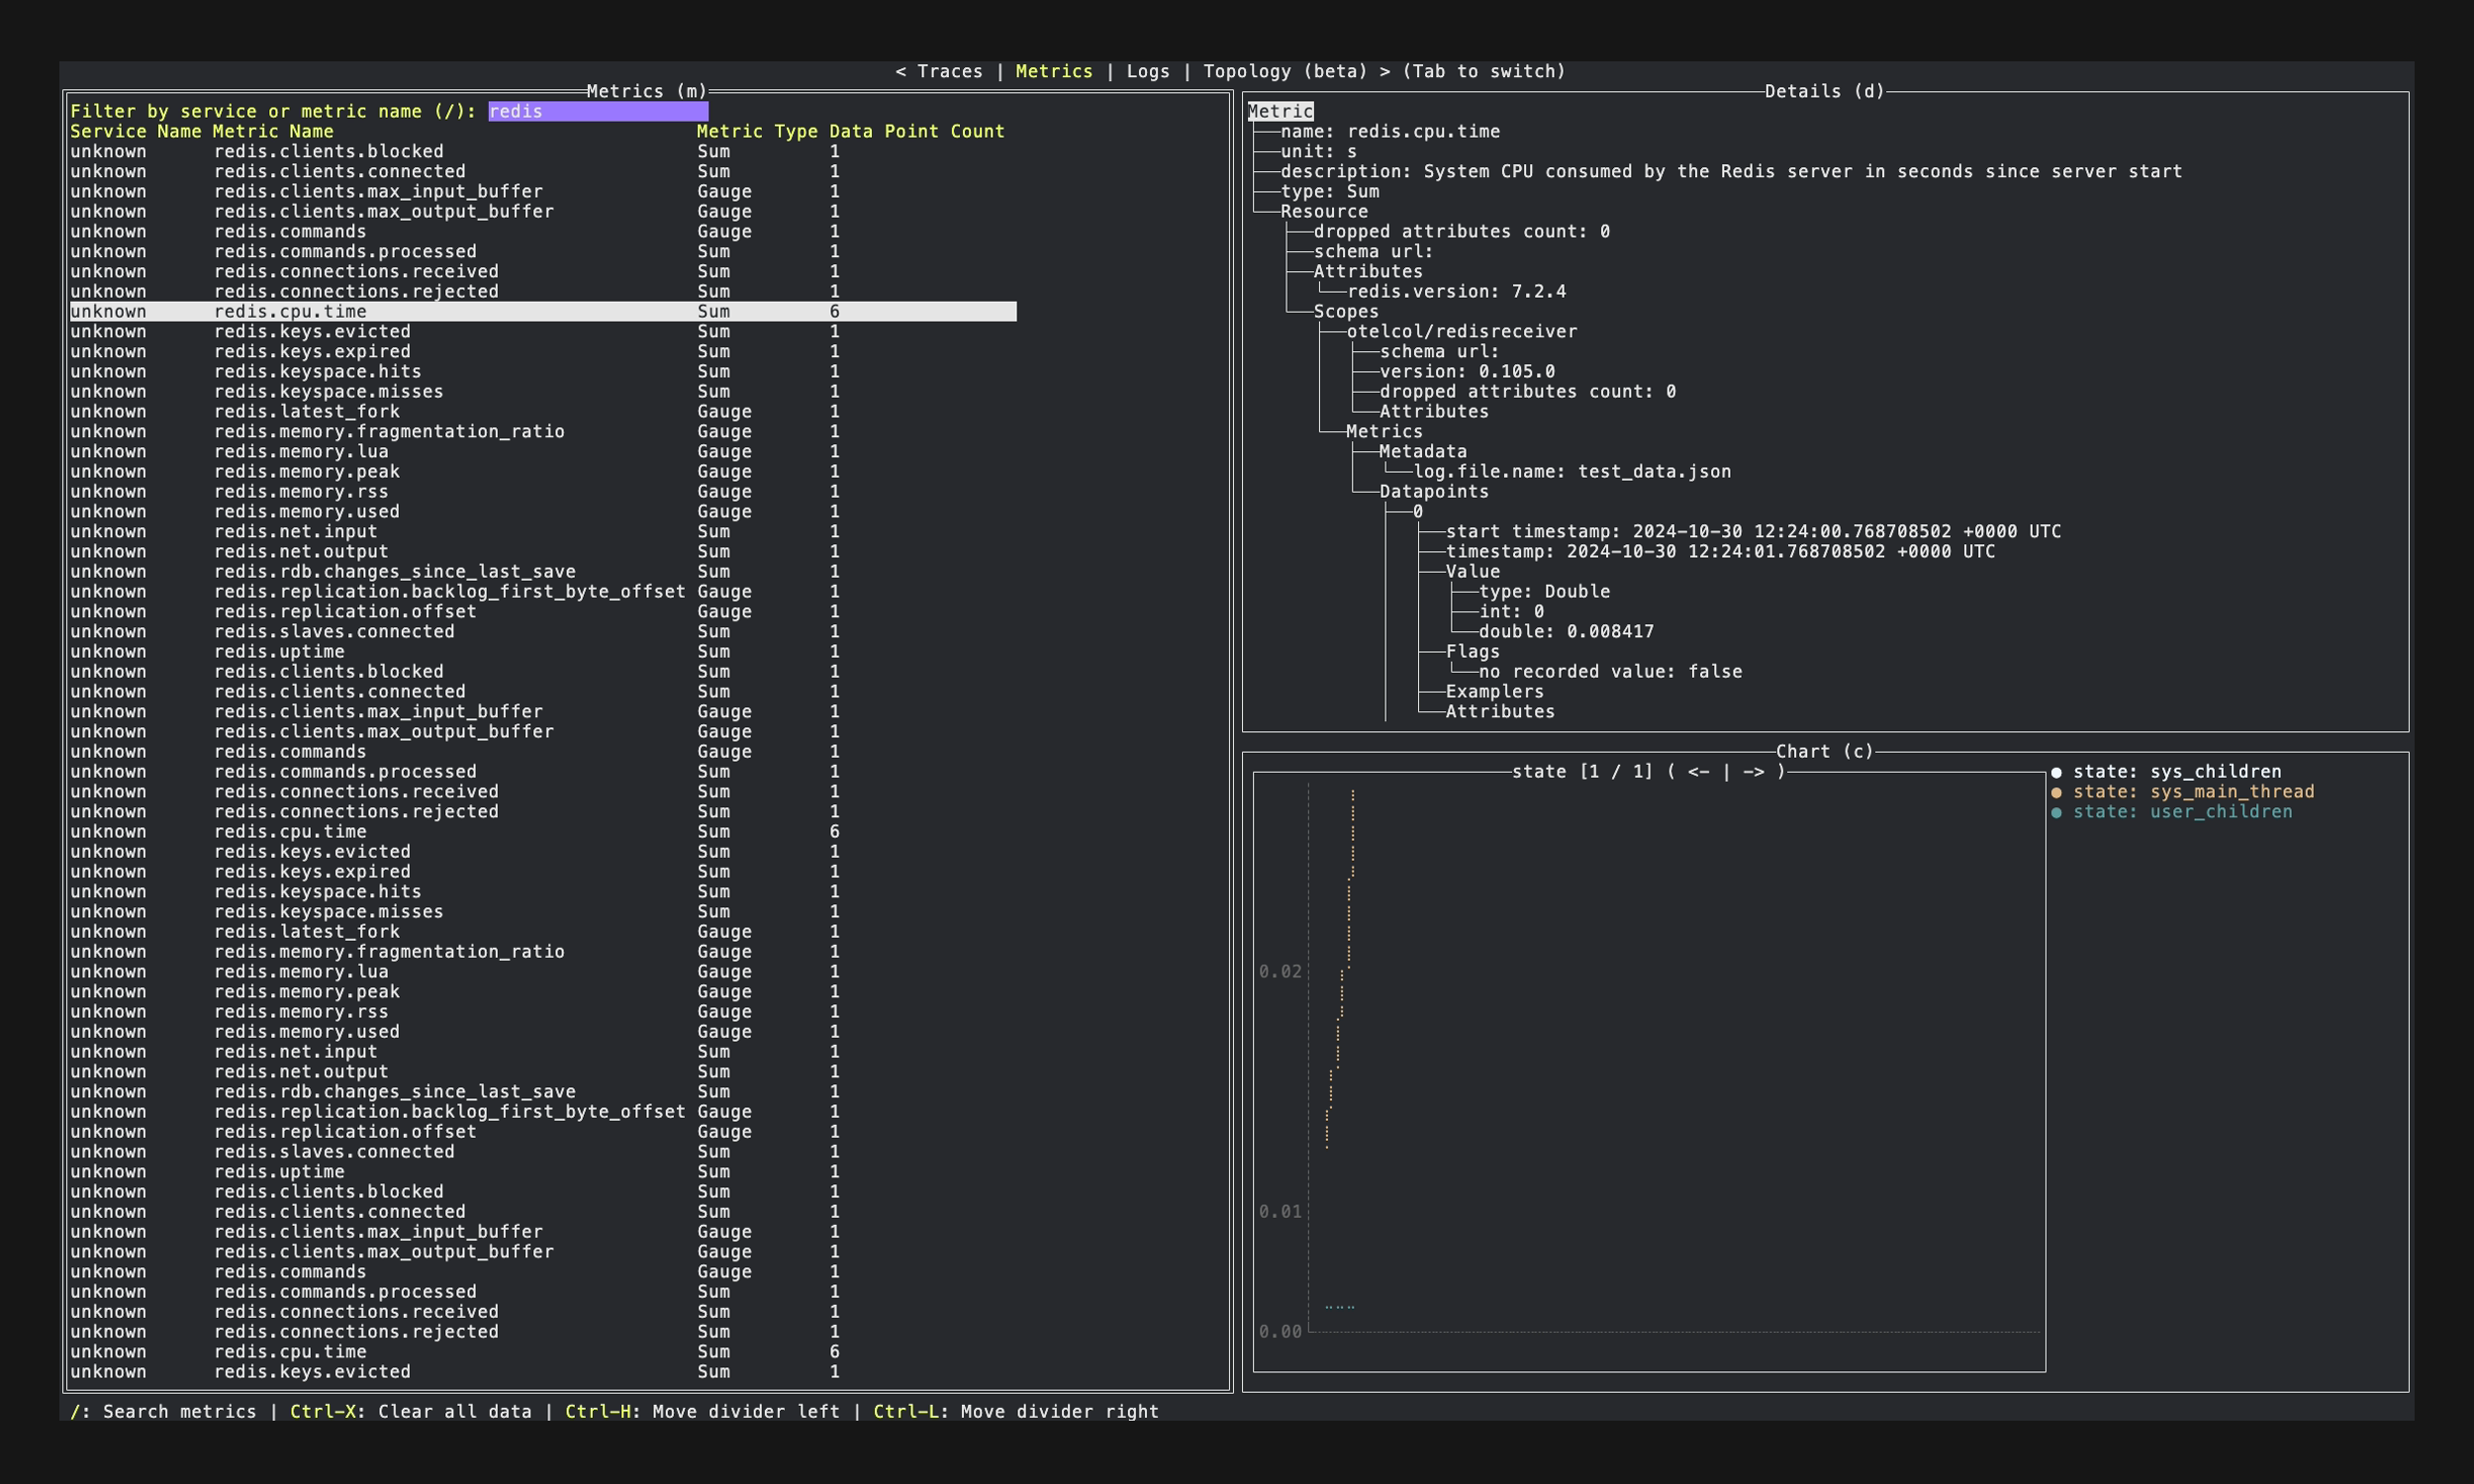
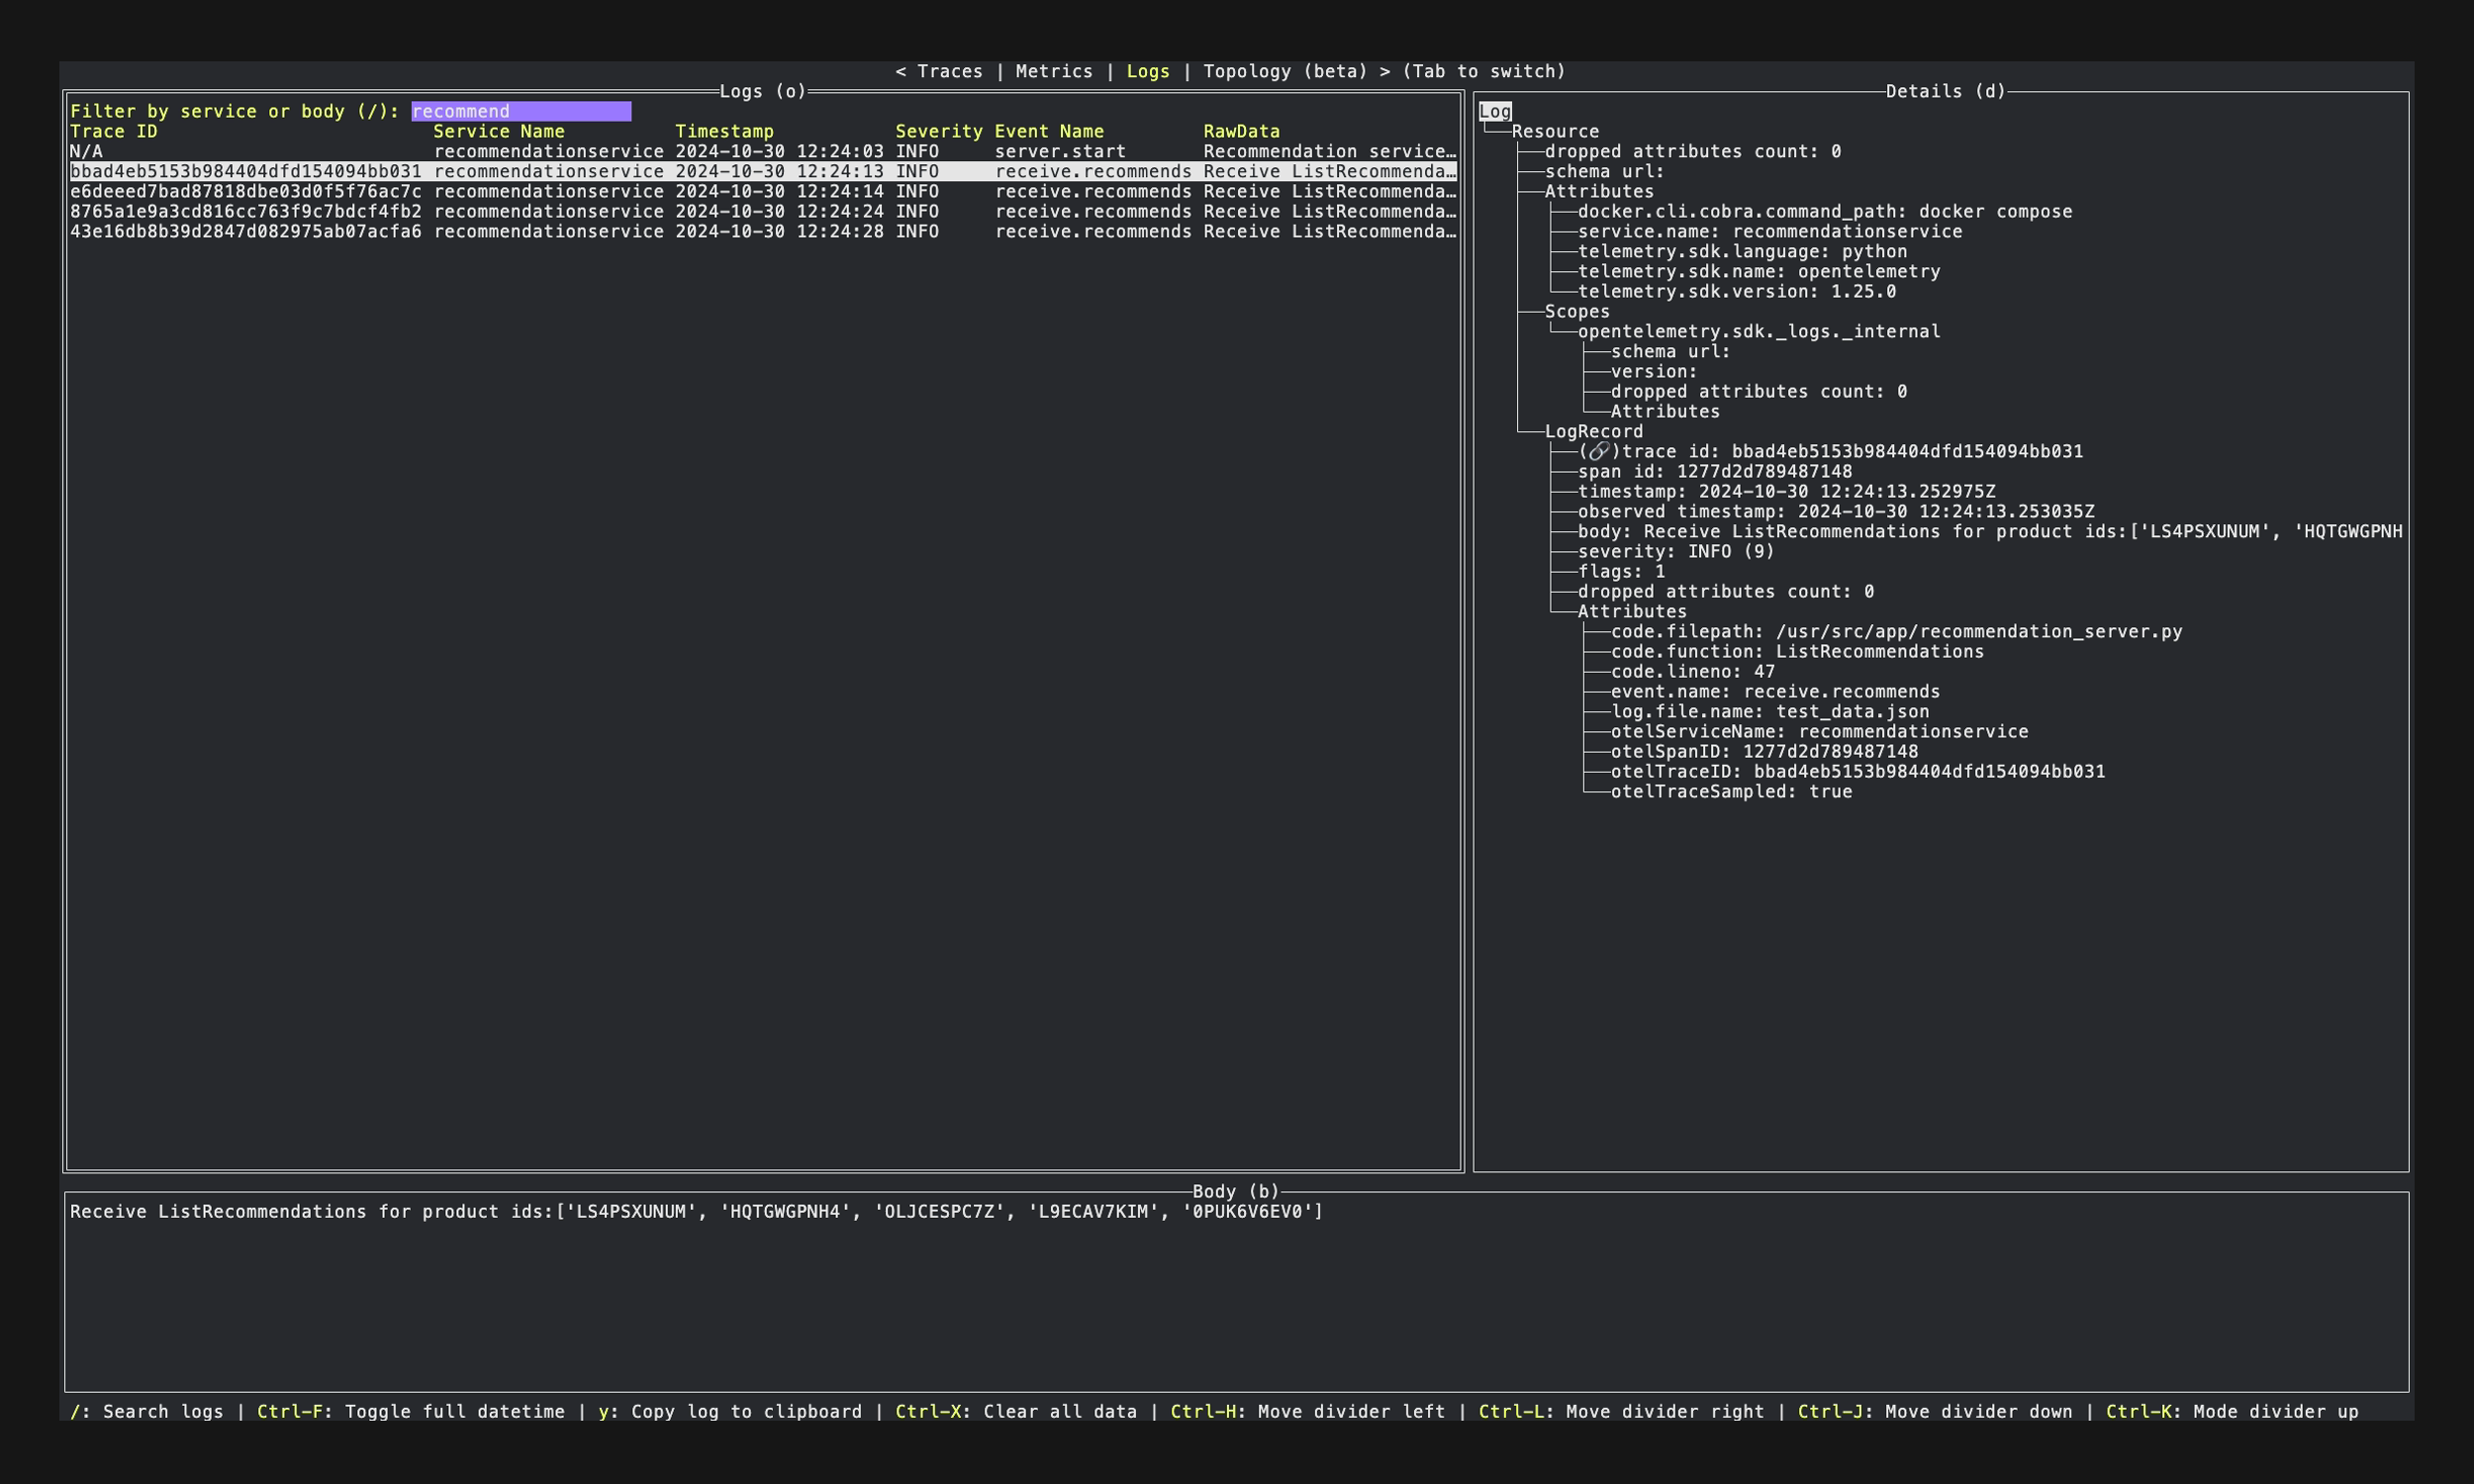
A terminal OpenTelemetry viewer inspired by otel-desktop-viewer.
This tool currently supports OpenTelemetry, Zipkin (Traces) and Prometheus (Metrics) formats.
Currently, this tool exposes the ports:
4317to receive OpenTelemetry signals (gRPC)4318to receive OpenTelemetry signals (HTTP)9411to receive Zipkin traces (enabled by--enable-zipkinoption)
Options:
Usage:
  otel-tui [flags]

Flags:
      --enable-prom               Enable the prometheus receiver
      --enable-zipkin             Enable the zipkin receiver
      --grpc int                  The port number on which we listen for OTLP grpc payloads (default 4317)
  -h, --help                      help for otel-tui
      --host string               The host where we expose our OTLP endpoints (default "0.0.0.0")
      --http int                  The port number on which we listen for OTLP http payloads (default 4318)
      --prom-target stringArray   The target endpoints for the prometheus receiver (--prom-target "localhost:9000" --prom-target "other-host:9000")
  -v, --version                   version for otel-tui
$ brew install ymtdzzz/tap/otel-tuiRun in the container simply:
$ docker run --rm -it --name otel-tui ymtdzzz/otel-tui:latestOr, run as a background process and attach it:
# Run otel-tui as a background process
$ docker run --rm -dit --name otel-tui ymtdzzz/otel-tui:latest

# Show TUI in your current terminal session
$ docker attach otel-tui

# Detach by pressing Ctrl+p -> Ctrl+qFirst, add service to your manifest (docker-compose.yaml) for the instrumanted app
  oteltui:
    image: ymtdzzz/otel-tui:latest
    container_name: otel-tui
    stdin_open: true
    tty: true
    # Override entrypoint if you want use options
    entrypoint: ["/otel-tui", "--enable-zipkin"]
Modify configuration for otelcol
exporters:
  otlp:
    endpoint: oteltui:4317
service:
  pipelines:
    traces:
      exporters: [otlp]
    logs:
      exporters: [otlp]
Run as a background process and attach it:
# Run services as usual
$ docker compose up -d

# Show TUI in your current terminal session
$ docker compose attach oteltui

# Detach by pressing Ctrl+p -> Ctrl+qhttps://github.com/ymtdzzz/otel-tui/releases
$ git clone https://github.com/ymtdzzz/otel-tui.git
$ cd otel-tui
$ go run ./...There're a lot of things to do. Here are some of them:
- Traces
- Display traces
- Filter traces
- Show trace information
- ...
- Metrics
- Metric stream
- Display metric stream
- Filter metrics
- Show metric information
- Display basic chart of the selected metric
- Gauge
- Sum
- Histogram
- ExponentialHistogram
- Summary
- Metric list
- Display metric stream
- Flexible chart (query, selectable dimensions, etc.)
- Auto refresh chart
- Asynchronous chart rendering
- ...
- Metric stream
- Logs
- Display logs
- Filter logs
- Show log information
- Show logs related to a specific trace or span
- ...
- UI
- Improve UI
- Add more keybindings
- ...
- Performance
- Timer based refresh
- Data rotation (current buffer size: 1000 service root spans and logs)
- ...
- Configurations
- Port
- Refresh interval
- Buffer size
- ...


